Journal of Chemical and Pharmaceutical Research, 2018, 10(6): 87-96
Research Article
CODEN(USA) : JCPRC5
ISSN : 0975-7384
87
Development and Validation of Absorbance Correction Method for
Simultaneous Estimation of Paracetamol, Ibuprofen and Dextromethorphan
Rakesh D Parmar, Dr. Pankaj Kapupara
and
Dr. Ketan Shah*
Department of Quality Assurance, School of Pharmacy, RK University, Kasturbadham, Rajkot-360020, Gujarat, India
____________________________________________________________________________
ABSTRACT
In current study infrared spectroscopy was performed for identification of Paracetamol (PCM), Ibuprofen (IBU) and Dextromethorphan (DEX). Simultaneous spectrophotometric determination of Paracetamol, Ibuprofen and Dextromethorphan was carried out by absorbance correction method using UV visible double beam spectrophotometer. Validation of simultaneous spectrophotometric method was performed with different parameter like accuracy, precision, recovery and LOD and LOQ. For absorbance correction method 226 nm, 247 nm and 279 nm were selected as working wavelength because at 279 nm and 226 nm Dextromethorphan, at 226 nm Ibuprofen and at 226 nm, 247 nm 279 nm Paracetamol showed significant absorbance. Linearity of Paracetamol, Ibuprofen and Dextromethorphan was found to be 2-40 µg/mL, 2-50 µg/mL and 1-10 µg/mL respectively. The % mean, standard deviation (S.D.), relative standard deviation (%R.S.D.) and standard error (S.E.) were calculated. The % R.S.D. was less than 2% as required by USP and ICH guideline. Present study revealed that absorbance correction method was found to be simple, accurate and precise. The experimental work involved is very simple, it requires only measurement of absorbance at selected wavelength. Current study revealed development and validation of simple, accurate, precise, rapid, cost effective, reproducible and reliable UV spectrophotometric method for estimation of Paracetamol, Ibuprofen and Dextromethorphan in bulk and synthetic mixture.
Keywords: UV; Validation; Analytical method; Paracetamol; Ibuprofen; Dextromethorphan
_____________________________________________________________________________
INTRODUCTION
88
MATERIALS AND METHODS
Paracetamol, Ibuprofen and Dextromethorphan
Preparation of standard stock solution [11]
10 mg each of Paracetamol, Ibuprofen and Dextromethorphan were weighed separately and transferred in three different 100 mL volumetric flask. All the drugs were dissolved in 50 mL of methanol with vigorous shaking and then volume was made up to the mark with methanol to obtain final concentration of 100 µg/mL of each solution of Paracetamol, Ibuprofen and Dextromethorphan.
Selection of analytical wavelength [11]
Using appropriate dilution of standard stock solution, the three solutions were scanned separately in order to get good result. By using overlay spectra of three drugs, working wavelength selected were 279 nm, 226 nm and 247 nm (5.2). Here, amount of Paracetamol was determined at 247 nm using standard calibration curve (using equations y=mx+c), where Paracetamol gives significant absorbance value. At 279 nm, Ibuprofen does not show absorbance, but Dextromethorphan and Paracetamol gives significant absorbance value. So, amount of Dextromethorphan was determined at 279 nm after correcting absorbance of Paracetamol. The concentration of Ibuprofen was determined at 226 nm after correcting absorbance of Paracetamol and Dextromethorphan.
Selection of analytical concentration range [11,12]
For each drug appropriate aliquots were pipette out from standard stock solution into series of 10 mL volumetric flask. The volume was made up to the mark with methanol to get a set of solution having the concentration of 1 to 10 µg/mL for Dextromethorphan and 2,4,6,8,10,15,20,25,30,35, 40, 45 and 50 µg/mL for Ibuprofen and 2, 4,6,8,10,15,20,25,30, 35 and 40 µg/mL for Paracetamol. The absorbance of Dextromethorphan was measured at 226 nm and 279 nm. The absorbance of Ibuprofen was measured at 226 nm; the absorbance of Paracetamol was measured at 226 nm, 247 nm and 279 nm. The absorbance was plotted against concentration. The concentration range over which the drugs obeyed beer’s law was chosen. The range was found to be 1µg/mL to 10 µg/mL for Dextromethorphan, 2 µg/mL to 50 µg/mL for Ibuprofen and 2 µg/mL and 40 µg/mL for Paracetamol (Tables 1-5) (Figures 1-8).
Determination of absorptivity at analytical wavelength
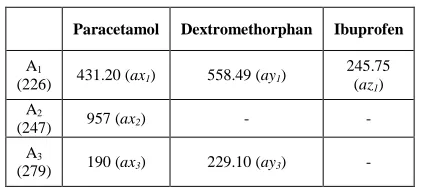
[image:2.612.201.414.478.572.2]The absorptivity of all three drugs was calculated at selected wavelength using data of calibration curve (Table 1). The absorptivity was used in forming equations for absorption correction method (equations 1, 2 and 3).
Table 1: Absorptivity measurement for absorbance correction method.
Paracetamol Dextromethorphan Ibuprofen
A1
(226) 431.20 (ax1) 558.49 (ay1)
245.75 (az1) A2
(247) 957 (ax2) - - A3
(279) 190 (ax3) 229.10 (ay3) -
The concentration CPCM, CDEX and CIBU can be obtained by solving equation (equation no X, Y and Z) [12].
For Paracetamol
Cpcm (gm/100 mL)=(A2)/ax2
=(A2)/957 ………… (1)
For Dextromethorphan
CDex (gm/100 mL)=(A3 – ax3 *CPcm)/ay3 =(A3 – 190 * CPcm)/229.10 ………… (2)
For Ibuprofen
Cibu=[A1 – (ax1 * Cpcm + ay1 Cdex)]/az1
89
Where,
A1=Absorbance of sample solution at 226 nm A2=Absorbance of sample solution at 247 nm A3=Absorbance of sample solution at 279 nm
IBU
(az1)=absorptivity Coefficients of IBU at 226 nm
PCM
(ax1)=absorptivity Coefficients of PCM at226 nm (ax2)=absorptivity Coefficients of PCM at 247 nm (ax3)=absorptivityCoefficientsof PCM at 279 nm
DEX
Ay1=absorptivity Coefficients of DEXat 226 nm Ay3=absorptivity Coefficients of DEX at 279 nm
CIBU, concentration of IBU in g/100 mL in mixture
CPCM, concentration of PCM in g/100 mL in mixture
CDEX, concentration of DEX in g/100 mL in mixture
Now if a mixture of Paracetamol, Ibuprofen and Dextromethorphan were to be analyzed, a solution of suitable dilution should be prepared in solvent. The absorbance of the solution at 226 nm, 247 nm and 279 nm were measured. The values were substituted in equation (1, 2 and 3) to get a concentration of Paracetamol, Dextromethorphan and Ibuprofen.
Procedure for analysis of powder mixture
Mixed solution of pure drug was prepared by taking suitable volume of standard drug solution. Here, 0.3 mL standard solution of Dextromethorphan (100 µg/mL), 3 mL standard solution of Paracetamol (100 µg/mL) and 3.7 mL standardsolution of Ibuprofen (100 µg/mL) were transferred into 10 mL volumetric flask to make final concentration of 3 µg/mL for Dextromethorphan, 30 µg/mL for Paracetamol and 37 µg/mL for Ibuprofen. Absorbance of this prepared mixed solution was measured at 226, 247 and 279 nm (Figures 3-8) Concentration of Dextromethorphan, Ibuprofen and Paracetamol was calculated by putting absorbance values into equations 1, 2 and 3. Results of this analysis of powder mixture are reported (Tables 1-7).
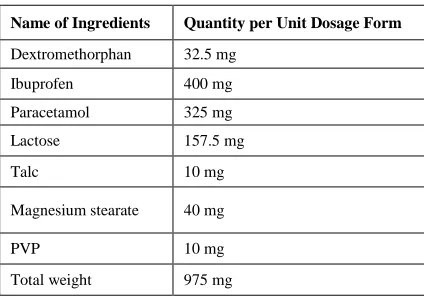
Procedure for preparation of synthetic mixture
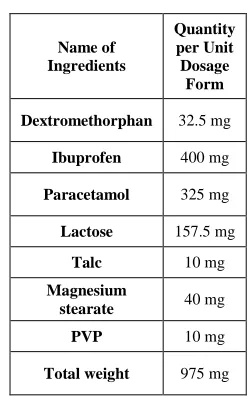
[image:3.612.242.367.428.630.2]Synthetic mixture was prepared by adding various tablet ingredients to the drugs.
Table 2: Formulation of synthetic mixture.
Name of Ingredients
Quantity per Unit Dosage
Form
Dextromethorphan 32.5 mg
Ibuprofen 400 mg
Paracetamol 325 mg
Lactose 157.5 mg
Talc 10 mg
Magnesium
stearate 40 mg PVP 10 mg
Total weight 975 mg
Procedure for analysis of synthetic mixture
90
µg/mL for Paracetamol, 37 µg/mL or Ibuprofen. Absorbance of this prepared solution was measured at 226 nm, 247 nm and 279 nm. Concentration of Dextromethorphan, Paracetamol and Ibuprofen in synthetic mixture was calculated by putting absorbance values into equations 1, 2 and 3. Results of this analysis of synthetic mixture are reported in Table 8 and 9.
Procedure for recovery studies[13]
Recovery studies were carried out by applying the method to drug sample present in synthetic mixture to which known amount of Paracetamol, Ibuprofen and Dextromethorphan corresponding to 80,100,120% of label claim was added (standard addition method). In 80% recovery study, amount of standard added is 260 mg of Paracetamol, 296 mg Ibuprofen and 26 mg Dextromethorphan (i.e., 80 addition). In 100% recovery study, amount of standard added is 325 mg of Paracetamol and 400 mg Ibuprofen and 32.5 mg Dextromethorphan. (i.e., 100% addition). In 120% recovery study, amount of standard added is 390 mg of Paracetamol and 480 mg Ibuprofen and 39 mg Dextromethorphan (i.e., 120 addition). After the addition of the standard the synthetic mixture were mixed properly. From this tablets and standard mixture, mixed powder (equivalent to 10 mg Paracetamol, 12.30 mg Ibuprofen and 1 mg of Dextromethorphan was weighed and transferred into 100 mL volumetric flask and dissolved in methanol and content was kept in ultrasonicator for 20 min. Finally the volume was made upto the mark with methanol. The solution was filtered through whatman filter paper No. 41.
From this solution 3 mL was transferred into 10 mL volumetric flask and volume was made up to mark. Absorbance of this prepared solution was measured at 226 nm, 247 nm and 279 nm. Concentration of Paracetamol, Ibuprofen and Dextromethorphan was calculated by putting absorbance values into equation (1, 2 and 3)
The statistical evaluation data for recovery studies are shown in Table 10.
Procedure for precision [14]
Precision of the method was determined with synthetic mixture. Average weight of synthetic mixture for unit dosage form was found to be 975 mg. From the synthetic mixture, 30 mg tablets powder (equivalent to 1 mg of Dextromethorphan, 10 mg of Paracetamol and 12.3 mg of Ibuprofen) was weighed and transferred into 100 mL volumetric flask and dissolve in methanol and the content was kept in ultra sonicator for 20 min. Finally the volume was made upto mark with methanol. The solution was filtrated through whatman filter paper number 41.
This solution was further diluted as per the analysis of synthetic mixture to obtain mixed sample solution in Beer Lambert’s range for each drug containing 30 µg/mL of Paracetamol, 37 µg/mL of Ibuprofen and 3 µg/mL of Dextromethorphan respectively. The mixed sample solutions were analyzed to obtain spectra and absorbance value at 226 nm, 247 nm and 279 nm were noted. The concentration of Paracetamol, Dextromethorphan and Ibuprofen were calculated from the equation. In intraday precision sample having concentration of 30 µg/mL of Paracetamol, 37 µg/mL of Ibuprofen and 3 µg/mL of Dextromethorphan was scanned six times at different time interval in the same day. Interday precision was obtained by the assay of six sample sets on different days as per the same procedure (Tables 11-13).
Determination of Limit of Detection and Limit of Quantitation
Limit of detection and limit of quantitation
Calibration curve was repeated six times and the standard deviation of the intercepts was calculated. Then LOD and LOQ were calculated as follow [15]:
……….. (4)
……….. (5)
Where, D=Standard Deviation of y-intercepts of regression line of calibration curves. S=Slope of the calibration curve
91
RESULTS, DISCUSSION AND CONCLUSION
[image:5.612.116.537.88.398.2]Figure 1: Mixture spectrum of Ibuprofen – 37 μg/mL, Dextromethorphan – 3 μg/mL and Paracetamol – 30 μg/mL in methanol
Figure 2: Overlay spectra of Ibuprofen – 37 μg/mL, Dextromethorphan – 3 μg/mL and Paracetamol – 30 μg/mL in methanol From examination of overlay spectra of drugs, the three wavelength chosen were 226 nm, 247 nm and 279 nm. Here, Dextromethorphan showed absorbance at 226 nm and 279 nm, Paracetamol showed absorbance at 226 nm, 247 nm and 279 nm, Whereas Ibuprofen showed absorbance at 226 nm.
Selection of Analytical Concentration Range
[image:5.612.207.402.504.704.2]Analytical concentration ranges for which drug obeys Beer Lambert’s law were determined for all three drugs at selected wavelengths.
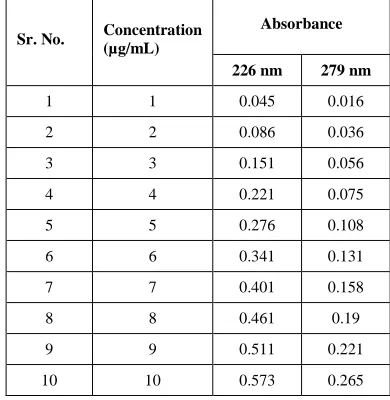
Table 3: Selection of analytical concentration range for Dextromethorphan (Linearity)
Sr. No. Concentration (µg/mL)
Absorbance
226 nm 279 nm
92
Figure 3: Calibration curve of Dextromethorphan at 279 nm
[image:6.612.159.531.280.407.2]From the calibration curve of Dextromethorphan at 279 nm, the linearity was observed for 2 µg/mL to 10 µg/mL with correlation coefficient (r2) value of 0.987
Figure 4: Calibration curve of Dextromethorphan at 226 nm
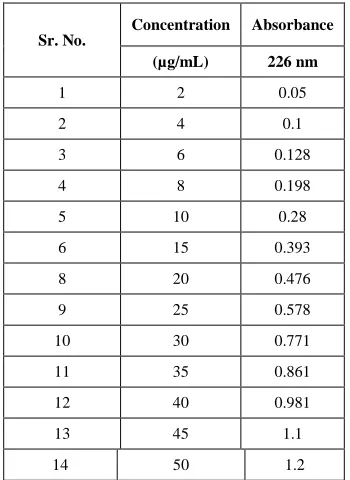
Table 4: Selection of analytical concentration range for Ibuprofen (Linearity)
Sr. No.
Concentration Absorbance
(µg/mL) 226 nm
1 2 0.05 2 4 0.1 3 6 0.128 4 8 0.198 5 10 0.28 6 15 0.393 8 20 0.476 9 25 0.578 10 30 0.771 11 35 0.861 12 40 0.981 13 45 1.1 14 50 1.2
y = 0.0271x - 0.023
R² = 0.9877
0
0.1
0.2
0.3
0
5
10
15
Ab
so
rb
ance
Concentration (µg/mL)
Dextromethorphan-at 279
y = 0.0599x - 0.0223 R² = 0.9989 0
0.5 1
0 5 10 15
Abs
or
ba
nce
[image:6.612.219.394.444.684.2]93
Figure 5: Calibration curve of Ibuprofen at 226 nm
[image:7.612.187.429.257.624.2]From the calibration curve of Ibuprofen at 226 nm, the linearity was observed for 2 µg/mL to 50 µg/mL with correlation coefficient (r2) value of 0.997.
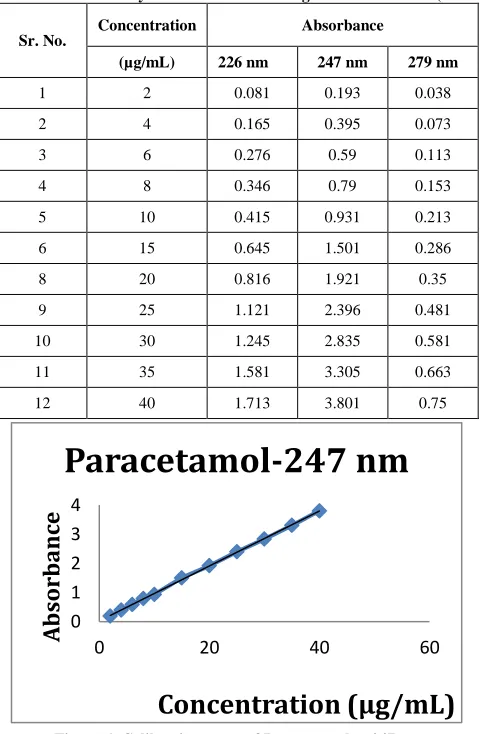
Table 5: Selection of analytical concentration range for Paracetamol (Linearity)
Sr. No.
Concentration Absorbance
(µg/mL) 226 nm 247 nm 279 nm
1 2 0.081 0.193 0.038 2 4 0.165 0.395 0.073 3 6 0.276 0.59 0.113 4 8 0.346 0.79 0.153 5 10 0.415 0.931 0.213 6 15 0.645 1.501 0.286 8 20 0.816 1.921 0.35 9 25 1.121 2.396 0.481 10 30 1.245 2.835 0.581 11 35 1.581 3.305 0.663 12 40 1.713 3.801 0.75
Figure 6: Calibration curve of Paracetamol at 247 nm
From the calibration curve of Paracetamol at 247 nm, the linearity was observed for 2 µg/mL to 40 µg/mL with correlation coefficient (r2) value of 0.999.
0 1 2 3 4
0 20 40 60
A
bsorba
n
ce
Concentration (µg/mL)
Paracetamol-247 nm
0 0.5 1 1.5
0 20 40 60
A
bsorba
n
ce
94
Figure 7: Calibration curve of Paracetamol at 226 nm
[image:8.612.185.464.253.389.2]From the calibration curve of Paracetamol at 226 nm, the linearity was observed for 2 µg/mL to 40 µg/mL with correlation coefficient (r2) value of 0.996.
Figure 8: Calibration curve of Paracetamol at 279 nm
[image:8.612.71.554.426.677.2]From the calibration curve of Paracetamol at 279 nm, the linearity was observed for 2 µg/mL to 40 µg/mL with correlation coefficient (r2) value of 0.997.
Table 6: Analysis of powder mixture
Sr. Amount Present Amount Found Amount Found
No. (µg/mL) (µg/mL) (%)
DEX IBU PCM DEX IBU PCM DEX IBU PCM
1 3 37 30 3 36.18 29.43 100.13 98.05 99.1 2 3 37 30 2.95 36.24 29.44 98.39 98.21 98.13 3 3 37 30 3.01 36.22 29.41 100.42 98.16 98.06 4 3 37 30 2.94 36.25 29.44 101.3 98.23 98.13 5 3 37 30 3.06 36.27 29.47 101.89 98.3 98.23 6 3 37 30 2.97 36.69 29.41 98.97 99.42 98.06
Table 7: Statistical validation for powder mixture
Drug
Mean* Standard Co– efficient of Variation*
Standard
% Deviation (% R.S.D) Error*
DEX 100.18 1.335 1.332 0.544 IBU 98.39 0.508 0.516 0.207 PCM 98.28 0.401 0.408 0.165
The % R.S.D. was found to be less than 2% as required by USP and ICH guideline.
Analysis of Synthetic Mixture
Synthetic mixture was prepared by adding various tablet ingredients to the drugs.
0 2
0 10 20 30 40 50
Absorbance
Concentration (µg/mL)
Paracetamol-226
nm
0 0.5 1
0 10 20 30 40 50
A
bsorba
n
ce
Concentration (µg/mL)
95
Table 8: Formulation for synthetic mixture
Name of Ingredients Quantity per Unit Dosage Form
Dextromethorphan 32.5 mg Ibuprofen 400 mg Paracetamol 325 mg Lactose 157.5 mg Talc 10 mg Magnesium stearate 40 mg PVP 10 mg Total weight 975 mg
Table 9: Analysis of synthetic mixture (SM)
Sr. Label Claim Amount of Drug Present in Prepared Synthetic Mixture Solution (µg/mL)
Amount Found
% Label Claim
No. (mg/SM) (µg/mL)
[image:9.612.200.412.88.236.2]DEX IBU PCM DEX IBU PCM DEX IBU PCM DEX IBU PCM 1 32.5 400 325 3 37 30 2.95 36.3 29.7 98.4 98.6 99 2 32.5 400 325 3 37 30 2.95 36.4 29.7 98.4 98.8 99.1 3 32.5 400 325 3 37 30 2.95 36.5 29.8 98.4 99 99.3 4 32.5 400 325 3 37 30 2.95 36.6 29.8 98.4 99.1 99.5 5 32.5 400 325 3 37 30 2.95 36.6 29.9 98.4 99.3 99.7 6 32.5 400 325 3 37 30 2.96 36.7 29.9 98.5 99.5 99.8
Table 10: Statistical validation for synthetic mixture
Drug
Mean* Standard Co–efficient of Variation* Standard
% Deviation* (% R.S.D) Error*
DEX 98.47 0.018 0.018 0.007 IBU 99.09 0.357 0.36 0.145 PCM 99.43 0.325 0.326 0.132
Table 11: Statistical validation for recovery studies
Level % Mean Standard Co-efficient Standard of Recovery* Deviation* of Error* % Recovery Variation*
(% R.S.D.)
DEX IBU PCM DEX IBU PCM DEX IBU PCM DEX IBU PCM
[image:9.612.90.516.412.696.2]96
Table 12: Statistical validation for intra-day precision
Drug
Mean* Standard Co–
efficient of Standard (%) Deviation* Variation* Error*
(%R.S.D.)
[image:10.612.137.477.226.328.2]DEX 99.88 1.145 1.146 0.467 IBU 100.75 0.781 0.775 0.319 PCM 100.32 1.106 1.102 0.451
Table 13: LOD and LOQ Data for Paracetamol, Ibuprofen and Dextromethorphan
Drug
LOD (µg/mL) LOQ (µg/mL)
226 nm 247 nm 279 nm 226 nm 247 nm 279 nm Paracetamol 1.296 2.482 2.31 3.928 7.521 7 Dextromethorphan 0.979 - 0.994 2.968 - 3.012 Ibuprofen 1.534 - - 4.65 - -
ACKNOWLEDGEMENT
The authors acknowledge the management of RK University for providing all necessary infrastructures for carrying out this research work.
REFERENCES
[1] J Lin; W Zhang; A Jones. Br J Med. 2004:324-329.
[2] https://www.slideshare.net/abdulwaheed45/nonsteroidal-anti-inflammatory-drugs-nsaids [3] http://www.newhealthguide.org/Anti-Inflammatory-Drugs.html
[4] RK Goyal; AA Mehta; R Balraman. Elements of Pharmacology, 7th edn, B.S. Shah Prakashan, Ahmedabad, India, 2006, 457.
[5] British Pharmacopeia, Stationary Office on Behalf of the Medicine and Healthcare products Regulatory agency (MHRA), The British Pharmacopeia Commission London, 2009, 1554-1555.
[6] SC Sweetman; Martindale. The Complete Drug Reference, 34th edn, The Royal Pharmaceutical Society of Great Britain, London, 2005, 76-79.
[7] British Pharmacopeia, Stationary Office on behalf of the Medicine and Healthcare Products Regulatory Agency (MHRA), The British Pharmacopeia Commission London, 2009, 1048-1049.
[8] SC Sweetman; Martindale. The Complete Drug Reference, 34th edn, The Royal Pharmaceutical Society of Great Britain, London, 2005, 45-47.
[9] British Pharmacopeia, Stationary Office on behalf of the Medicine and Healthcare Products Regulatory Agency (MHRA), The British Pharmacopeia Commission, London, 2009; 632-633.
[10]SC Sweetman; Martindale. The Complete Drug Reference, 34th edn, The Royal Pharmaceutical Society of Great Britain, London, 2005, 1117-1118.