Research Article
Evaluation of Wind Energy Potential as a Power Generation
Source in Chad
Djamal Hissein Didane, Nurhayati Rosly, Mohd Fadhli Zulkafli,
and Syariful Syafiq Shamsudin
Department of Aeronautical Engineering, Faculty of Mechanical and Manufacturing Engineering, Universiti Tun Hussein Onn Malaysia (UTHM), Parit Raja, 86400 Batu Pahat, Johor, Malaysia
Correspondence should be addressed to Djamal Hissein Didane; [email protected]
Received 21 January 2017; Revised 17 April 2017; Accepted 30 April 2017; Published 31 May 2017
Academic Editor: Li Ren
Copyright © 2017 Djamal Hissein Didane et al. This is an open access article distributed under the Creative Commons Attribution License, which permits unrestricted use, distribution, and reproduction in any medium, provided the original work is properly cited.
Long-term wind speed data for thirteen meteorological stations, measured over a five-year period, were statistically analyzed using the two-parameter Weibull distribution function. The purpose of this study is to reveal for the first time the wind power potentials in Chad and to provide a comprehensive wind map of the country. The results show that the values of the shape and scale parameters varied over a wide range. Analysis of the seasonal variations showed that higher wind speed values occur when the weather condition is generally dry and they drop considerably when the weather condition is wet. It was also observed that the wind speed increases as one moves from the southern zone to the Saharan zone. Although the wind power at each site varies significantly, however, the potentials of most of the sites were encouraging. Nevertheless, according to the PNNL classification system, they are favorable for small-scale applications only. A few stations in the middle of Sudanian and Sahel regions are found to be not feasible for wind energy generation due to their poor mean wind speed. The prevailing wind direction for both Saharan and Sahel regions is dominated by northeastern wind, while it diverged to different directions in the Sudanian zone.
1. Introduction
The fast growing population in developing countries and their lack of access to electricity supply particularly in rural or remote areas make some of these nations face the challenge of generating more energy sources and establishing a new form of energy supply structure in an effort to meet current and future increasing electricity demands. Permanent electricity supply is considered as one of the major factors responsible for sustainable economic and social development of a nation [1]. In Chad, for example, although the country is an oil producer, access to energy is extremely limited and incessant power outage is still an everyday burden that undermines its development possibilities and needs a rapid action with a view to coping with the minimum requirement of the twenty-first century’s lifestyle.
As such, the majority of people in Chad tend to rely on traditional biomass for cooking and heating purposes particularly in rural areas as it is the case for many African
nations [2]. A recent projection from the World Energy Outlook (WEO) [3] reported that more than 80% of the pop-ulation in sub-Saharan Africa and 50% of the poppop-ulation in developing Asia depend on traditional biomass for cooking and heating. This situation has become more critical due to high fuel price in the country (considered the highest in the region) and the ever-increasing rate of the desert encroach-ment towards the Sahel region which forces the governencroach-ment to set some policies that prohibit deforestation and use of charcoal for cooking. Additionally, the government is also creating a green belt from the extreme east to the west of the country in order to halt the desertification process and to pro-tect the region from economic and environmental impacts of land degradation.
Currently, a great deal of extensive research on wind energy is taking place almost all over the world due to the exceptional benefits that wind energy could offer. Many regional countries like Morocco, Egypt, Tunisia, Algeria, and so forth are already harvesting wind energy by establishing Volume 2017, Article ID 3121875, 10 pages
wind farms in the open Sahara desert and coastal areas [4, 5]. Chad was not an exception to embrace such sustainable renewable energy source as an alternative energy since the preliminary study in the region shows that the wind condi-tions are favorable for wind energy adoption [5].
Chad experiences wind and sunlight throughout the year. Thus, it is interesting to explore the abundant untapped potentials of the wind and the possibilities of using the Wind Energy Conversion System (WECS) as a source of electricity in the effort to fulfill the energy requirements in the country and to reduce this exclusive dependency on biomass and fos-sil fuels. However, although the region is found to be situated in the midst of enormous wind power potentials, to date, there is no extensive study undertaken to assess the prospects of wind energy as an alternative source in the country, except in [6] which covered only a single city (Ndjamena). Thus, this article could be the first of its kind to investigate the potentiality of wind power in Chad and it provides an initial assessment which together contributes towards the establish-ment of a comprehensive wind map/pattern for the country which may hopefully become the main wind energy reference for future development of wind power projects in the region.
2. Geographical Nature of Chad
Chad is a landlocked country with a 1,284,000 km2 area, situated in Central Northern Africa. It is the 5th largest in the African continent and 21st in the world in terms of land mass. It is bordered by Libya form the north, Sudan from the east, the Central African Republic from the south, Niger from the west, and Cameroon and Nigeria from the southwest. It lies at 7–23∘north of the equator and its larger part is Sahara desert. The vast majority of the area is flat with some plateaus around the country.
Unlike many countries in the world, the climate in Chad is highly varying throughout the country due to nonuniform geographical regions. These regions could be categorized into three in terms of geographical aspects as in Figure 1. The southern part is fertile agricultural land and is covered by tropical savanna, with a climate with longer raining season of about six months of precipitation. The raining season starts as early as May and ends around October. Meanwhile, the winter starts from November until February, and the summer takes place between February and May [7].
[image:2.600.363.496.75.247.2]The region in the middle has an arid subtropical climate and it forms a belt of about 500 kilometers wide in the center of the country between the Sahara and Sudanian savanna. The raining season in this region begins a bit late with almost three months of rainfall duration. The first water drops are seen in June and then raining ends in September, while winter is between October and February. The Sahara desert occupies the northern part of the country with less population though it is the largest region as shown in Figure 1. Most of the people here are farmers and/or ranchers. Rain is less likely to be seen in this locality and these people only depend on underground water for the living. Thus, only a hotter summer or colder and dry winter exists in this region [7].
Figure 1: Geographical map of Chad [8].
3. Wind Data Collection
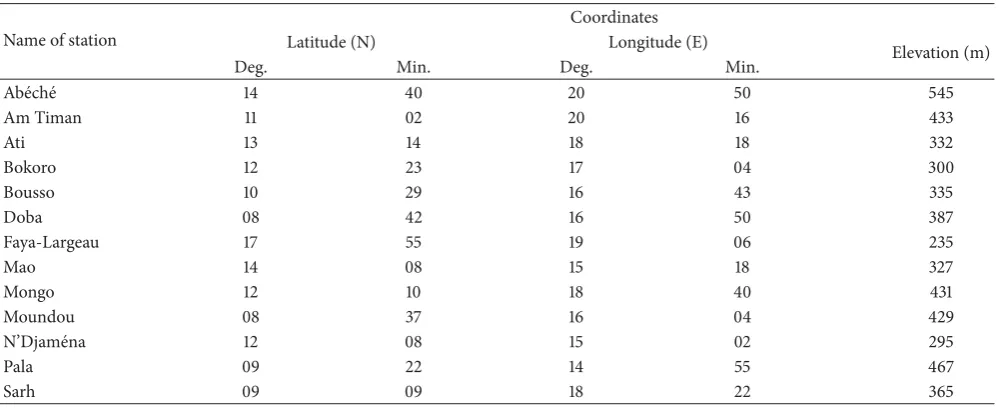
The wind data for this study are collected from the National Meteorological General Administration (Direction G´en´erale de la M´et´eorologie Nationale) at the Hassan Djamous Inter-national Airport in N’Djamena. The geographical coordi-nates of the thirteen major meteorological stations across the country are furnished in Table 1. The data extensively cover a wide range of five-year period and recorded in a monthly averaged form, at the standard 10 m height above ground level. These thirteen locations represent different geograph-ical and climatologgeograph-ical conditions, namely, Faya-Largeau, which is found in the Saharan zone; Ab´ech´e, Ati, Bokoro, Mao, Mongo, and Ndjamena, which are located in the Sahe-lian zone; and Am Timan, Bousso, Doba, Pala, Moundou, and Sarh, which are situated at the Sudanian zone as shown in Figure 1.
Furthermore, although most of the data involved in this study are recent, the last observation made by some stations was in late 1978. This might be attributed to the fact that some of these stations are no longer recording such data in a consis-tent manner. However, due to the need to uncover the poten-tial of these regions, they are being considered in this study by selecting five consecutive years, as it was learned that old or new data have a minor effect on the wind data assessment process as long as the study period is long enough [9, 10]. More so, [11, 12] stated that observation of less than 30 years may inherently cause variations in the long-term average, but for the sole purpose of resource assessment such period may be sufficient. However, covering longer periods would provide confidence to the interested investors that the wind potentials will be available in the coming years besides giving a more reliable evaluation [9, 10].
4. Analysis Procedure
Table 1: Physical features of the meteorological stations.
Name of station
Coordinates Latitude (N) Longitude (E)
Elevation (m)
Deg. Min. Deg. Min.
Ab´ech´e 14 40 20 50 545
Am Timan 11 02 20 16 433
Ati 13 14 18 18 332
Bokoro 12 23 17 04 300
Bousso 10 29 16 43 335
Doba 08 42 16 50 387
Faya-Largeau 17 55 19 06 235
Mao 14 08 15 18 327
Mongo 12 10 18 40 431
Moundou 08 37 16 04 429
N’Djam´ena 12 08 15 02 295
Pala 09 22 14 55 467
Sarh 09 09 18 22 365
misleading [13]. This is due to the fact that the wind speed fre-quency distribution and persistence at a site are not constant and they vary significantly with time. As such, merely taking the average wind speed for a specific period of time does not take such consideration into account. Thus, statistical meth-ods are used to reveal the wind characteristics of a potential site. Such statistical assessment of individual terrains or as a whole will collectively assist in establishing a clear wind map or wind pattern for a region while providing more detailed characteristics of the wind at the site such as wind distri-bution, stability, and direction, as the wind is known for its inherently intermittent behavior due to seasonal and tem-poral variations. The FirstLook software is commonly used to determine specific locations with higher wind power potentials, while the RIAM-COMPACT numerical model is responsible for suggesting the appropriate location to install a WECS during micrositing analysis of terrains.
4.1. Weibull Distribution Function. Many statistical methods
are available to closely estimate the wind power potentials and wind speed characteristics of a given terrain. Weibull distri-bution is among the widely accepted approaches to statisti-cally assess the wind behavior at a particular site clearly [14]. This technique consists of several methods to evaluate the shape and scale parameters of Weibull, depending on the form of data available and the level of sophistication required [15]. In this method, the variations of wind speed are char-acterized by probability density function (PDF) (see (1)) and cumulative distribution function (CDF) (see (5)) [16]. The PDF indicates the fraction of time or the probability of which the wind speed prevails at a certain direction and the CDF shows the probability of which the wind speed is equal to or lower than the average speed [17].
Thus, in the current study, the meteorological data are sta-tistically analyzed using the effective two-parameter Weibull distribution function. This approach is particularly useful in studying wind speed characteristics and wind energy density.
It is typically adopted due to its simplicity, flexibility, and abil-ity to show good agreement with the observed data [18–26]. In addition, the majority of the known commercial software packages for Annual Energy Production (AEP) estimation are based on the two-parameter Weibull distribution function [27].
The two parameters are the dimensionless shape function, 𝑘 (see (2)), and the scale function, 𝑐(see (3)), in meters per second unit. They, respectively, indicate the stability and strength of the wind at the site of interest [28].
𝑓 (V) = (𝑘𝑐) (V𝑐)𝑘−1exp[− (V
𝑐)
𝑘
] ,
(𝑘 > 0, V> 0, 𝑐 > 1) .
(1)
𝑓(V)is the probability of observing wind speedV.𝑐is the Weibull scale parameter and𝑘is the dimensionless Weibull shape parameter and they are given by [15] as follows:
𝑘 = 0.83𝑉0.5 (2)
𝑐 = 𝑉
Γ (1 + 1/𝑘). (3)
Γis the gamma function and𝑉is the average wind speed and can be expressed as
𝑉 =1
𝑛[
𝑛
∑
𝑖=1
V𝑖] . (4)
The cumulative distribution, given as in the equation below, is the integral of the probability density function:
𝐹 (V) = 1 − 𝑒−(V/𝑐)𝑘. (5)
4.2. Wind Speed Carrying Maximum Energy. 𝑉max.𝐸
and it is determined using the shape and scale parameters of the Weibull distribution. It is highly significant as it can expose the maximum energy possible at the given site, and it is expressed as in (6) [29]. The wind speed that carries maximum energy is different from the highest wind speed and the average wind speed because it takes into account the scale and shape parameters of the Weibull distribution which are responsible for indicating the persistence, stability, and strength of the wind at the site under investigation as was mentioned earlier.
Thus, such estimation is quite important for the sake of revealing the wind speed that may carry the highest energy which could probably assist in knowing the maximum amount that can be expected from a particular site. Moreover, it is also used in selecting a suitable wind turbine or an appro-priate rated wind speed [30]. As wind turbines perform effi-ciently at their rated wind speed, [31] suggests that the rated wind speed should be close to the wind speed carrying maxi-mum energy:
𝑉max.𝐸= 𝑐 (1 +2𝑘)
1/𝑘
. (6)
4.3. Wind Power Density. Generating electricity from kinetic
energy via wind that is flowing through a blade swept area,
A, is proportional to the cube of the velocity and it can be described as follows in (7). A wind turbine starts to operate at the starting speed and produces useful energy at the cut-in speed. The correspondcut-ing power cut-increases relative to the increase of the wind speed until the cut-out speed of the wind turbine. The maximum power is generated when the wind turbine is operated at the rated speed and power becomes constant when it operates between the rated speed and cut-out speed. At higher wind speeds above the cut-cut-out speed, the turbine stops to avoid damage due to the higher wind velocity.
𝑃 (V) = 1
2𝐴𝜌V3. (7)
The wind power density based on Weibull distribution analysis is calculated using the following equation [32]:
𝑃
𝐴 = ∫
∞
0
1
2𝜌V3𝑓 (V) 𝑑V=
1
2𝜌𝑐3Γ (
𝑘 + 3
𝑘 ) , (8)
where 𝜌is the air density (1.225 kg/m3) at sea level with a mean temperature of 15∘C and 1 atmospheric pressure.
4.4. Wind Energy Density. After knowing the wind power
density of a given site, one of the important wind character-istics could be estimated which is the wind energy density. It is the product of wind power density for a certain duration or period of time which can reveal the amount of energy density that could be expected at the site under study. The wind energy density for the desired time can easily be determined using the following equation [32]:
𝐸
𝐴=
1
2𝜌𝑐3Γ (
𝑘 + 3
𝑘 ) 𝑇, (9)
Abéché
Am Timan
Ati Doba
Faya-Largeau Pala
Bokoro
Bousso Mao
Mongo
Moundou Sarh
Feb Mar Apr May Jun Jul Aug Sep Oct Nov Dec --Jan
Months 0.0
0.5 1.0 1.5 2.0 2.5 3.0 3.5 4.0 4.5 5.0
M
ea
n wind sp
eed (m/s)
[image:4.600.314.542.71.334.2]Djaména N’
Figure 2: Monthly variation of wind speeds for all the selected sta-tions.
where 𝑇is the desired time; for example, for wind energy density for a time period of one month or a year, the time, 𝑇, can be taken as 720 h or 8640 h, respectively.
5. Results and Discussion
5.1. Wind Speed Variation. The potential of wind energy in
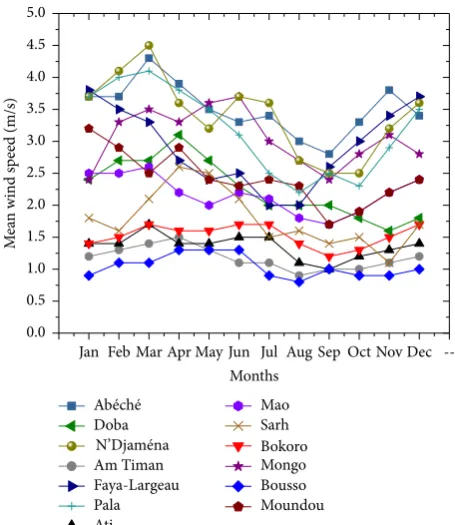
Chad was investigated at thirteen stations for a period of five years. Knowledge of monthly wind speed variations is essen-tial to draw a clear picture of the seasonal wind speed behav-ior at the potential site. These fluctuations are significant in designing and selecting an appropriate WCES, energy stor-age, and load scheduling. These variations were determined using (4) and presented in Figure 2.
The trends of monthly and yearly mean wind speed for all the stations under investigation exhibit almost a similar pat-tern. The monthly mean wind speed varies in the range of 2 to 4 m/s for the Saharan region and in the range of 1 to 4 m/s for the Sahel and tropical Savanna regime. It was also observed that the wind speed tends to increase significantly when the weather condition is generally dry (November to May) and decreases considerably when the weather condi-tions are wet (June to October). It was learned that the highest demand for electricity is also at the dry period [6]. However, a few stations such as Bousso, Bokoro, and Am Timan main-tained almost similar monthly mean wind speed throughout the year.
3 6 9 (m/s)
3 6 9
[image:5.600.132.469.70.293.2](m/s)
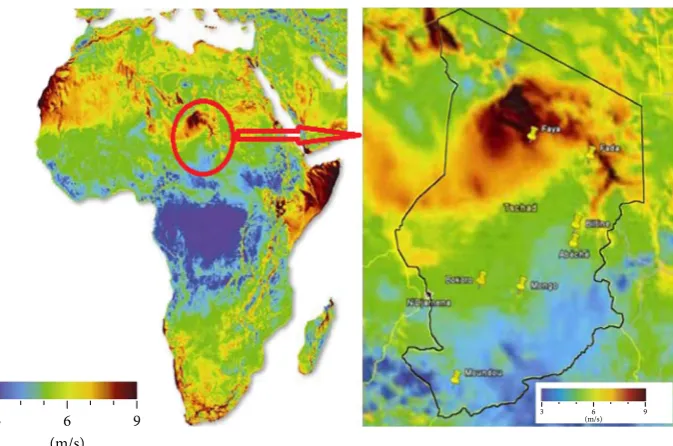
Figure 3: Wind speed pattern in Chad.
compared to the Sahel and Saharan regions with the excep-tion of Ati and Bokoro. This could partly be attributed to the fact that the southern region is tropical with heavy forest and the land becomes clearer as one moves towards the north. However, it was specifically found that the stations at the middle of the Sahel and Sudanian zones showed the lowest mean wind speed with an annual average wind speed of less than 2 m/s as it is evident in Figures 2 and 3. This suggests that this area is less likely to be a potential location for wind energy harvesting.
Moreover, the seasonal wind speed variations among the three regions become more noticeable particularly during winter, though this variation is marginal between the Sahel and Saharan regions. The month March showed the highest mean wind speed with the value of 4.5 m/s, and August showed the lowest mean wind speed value of 0.8 m/s.
The results presented also showed that, within five years under study, the highest corresponding annual average wind speed at 10 m height from the ground is approximately 3.5 m/s, and it was found in the eastern part of the country at Ab´ech´e specifically, while the minimum is found at Bousso with a wind speed of 1.0 m/s. Thus, according to the PNNL (Pacific Northwest National Laboratory) classification sys-tem, wind energy potentials in Chad could only be used for small-scale applications due to the current wind conversion technologies and cost factor [32]. As such, this could probably solve the incessant power outage if a WECS is installed at every household and would also be quite useful for the ranch-ers who depend only on wells and use conventional methods to pump water.
However, it is worth noting that although the presented station from the Saharan region (Faya-Largeau) showed a bit lower wind speed compared to some stations in the Sahel region, data for wind speed at 30 m height proves otherwise.
Thus, the Sahara zone could be considered more promising as depicted in Figure 3.
5.2. Wind Power and Energy Density. Although wind speed
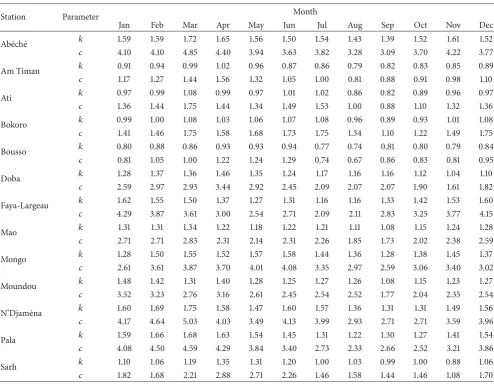
characteristics are essential in drawing a clear picture of the wind potentials of a site, wind power density is believed to be a better indicator than wind speed. In this study, the wind power and energy density are evaluated using the Weibull equations (8) and (9), respectively, and tabulated in Table 3. The results illustrated in Figure 4 show that the highest value of wind power density was found at Ab´ech´e (69 W/m2) fol-lowed by Ndjamena (65 W/m2) and Pala (55 W/m2), whereas the lowest wind power density was observed at Bousso, Am Timan, and Ati with the value of 7, 8, and 10 W/m2, respec-tively. On the other hand, the wind energy density ranged between 59 kWh/m2/year and 603 kWh/m2/year. The city of Ab´ech´e again showed the maximum value of energy with more than 600 kWh/m2/year and Bousso presented the mini-mum. Based on the presented data, it could be deduced that the maximum power density in Chad is around 70 W/m2and it is found in the eastern part of the country.
Table 2: Monthly Weibull parameters (𝑘, 𝑐).
Station Parameter Month
Jan Feb Mar Apr May Jun Jul Aug Sep Oct Nov Dec
Ab´ech´e 𝑘 1.59 1.59 1.72 1.65 1.56 1.50 1.54 1.43 1.39 1.52 1.61 1.52
𝑐 4.10 4.10 4.85 4.40 3.94 3.63 3.82 3.28 3.09 3.70 4.22 3.77
Am Timan 𝑘 0.91 0.94 0.99 1.02 0.96 0.87 0.86 0.79 0.82 0.83 0.85 0.89
𝑐 1.17 1.27 1.44 1.56 1.32 1.05 1.00 0.81 0.88 0.91 0.98 1.10
Ati 𝑘 0.97 0.99 1.08 0.99 0.97 1.01 1.02 0.86 0.82 0.89 0.96 0.97
𝑐 1.36 1.44 1.75 1.44 1.34 1.49 1.53 1.00 0.88 1.10 1.32 1.36
Bokoro 𝑘 0.99 1.00 1.08 1.03 1.06 1.07 1.08 0.96 0.89 0.93 1.01 1.08
𝑐 1.41 1.46 1.75 1.58 1.68 1.73 1.75 1.34 1.10 1.22 1.49 1.75
Bousso 𝑘 0.80 0.88 0.86 0.93 0.93 0.94 0.77 0.74 0.81 0.80 0.79 0.84
𝑐 0.81 1.05 1.00 1.22 1.24 1.29 0.74 0.67 0.86 0.83 0.81 0.95
Doba 𝑘 1.28 1.37 1.36 1.46 1.35 1.24 1.17 1.16 1.16 1.12 1.04 1.10
𝑐 2.59 2.97 2.93 3.44 2.92 2.45 2.09 2.07 2.07 1.90 1.61 1.82
Faya-Largeau 𝑘 1.62 1.55 1.50 1.37 1.27 1.31 1.16 1.16 1.33 1.42 1.53 1.60
𝑐 4.29 3.87 3.61 3.00 2.54 2.71 2.09 2.11 2.83 3.25 3.77 4.15
Mao 𝑘 1.31 1.31 1.34 1.22 1.18 1.22 1.21 1.11 1.08 1.15 1.24 1.28
𝑐 2.71 2.71 2.83 2.31 2.14 2.31 2.26 1.85 1.73 2.02 2.38 2.59
Mongo 𝑘 1.28 1.50 1.55 1.52 1.57 1.58 1.44 1.36 1.28 1.38 1.45 1.37
𝑐 2.61 3.61 3.87 3.70 4.01 4.08 3.35 2.97 2.59 3.06 3.40 3.02
Moundou 𝑘 1.48 1.42 1.31 1.40 1.28 1.25 1.27 1.26 1.08 1.15 1.23 1.27
𝑐 3.52 3.23 2.76 3.16 2.61 2.45 2.54 2.52 1.77 2.04 2.35 2.54
N’Djam´ena 𝑘 1.60 1.69 1.75 1.58 1.47 1.60 1.57 1.36 1.31 1.31 1.49 1.56
𝑐 4.17 4.64 5.03 4.03 3.49 4.13 3.99 2.93 2.71 2.71 3.59 3.96
Pala 𝑘 1.59 1.66 1.68 1.63 1.54 1.45 1.31 1.22 1.30 1.27 1.41 1.54
𝑐 4.08 4.50 4.59 4.29 3.84 3.40 2.73 2.33 2.66 2.52 3.21 3.86
Sarh 𝑘 1.10 1.06 1.19 1.35 1.31 1.20 1.00 1.03 0.99 1.00 0.88 1.06
𝑐 1.82 1.68 2.21 2.88 2.71 2.26 1.46 1.58 1.44 1.46 1.08 1.70
Mean wind speed Mean power density
Ab
éc
h
é
Sa
rh
--Am T
ima
n
Do
ba
F
aya-L
ar
ge
au
Ma
o
Pa
la
M
o
undo
u
Bo
k
o
ro
Bo
u
ss
o
At
i
M
o
ngo
0 1 2 3 4
M
ea
n wind sp
eed (m/s)
0 10 20 30 40 50 60 70 80
M
ea
n p
o
w
er den
si
ty (W/
m
2)
Dja
m
éna
[image:6.600.52.547.86.472.2]N’
Figure 4: Comparison of yearly mean wind speeds and mean wind power density.
5.3. Weibull Distribution. The monthly mean scale parameter
Table 3: Yearly Weibull parameters(𝑘, 𝑐), average wind speed, wind speed carrying maximum energy, wind power density, and wind energy density (at 10 m height).
Station Parameters
𝑘 𝑐 V 𝑉max.𝐸 𝑃/𝐴(W/m2) 𝐸/𝐴(kWh/m2)
Ab´ech´e 1.56 3.91 3.52 6.65 68.80 602.72
Am Timan 0.90 1.13 1.18 4.11 8.04 70.39
Ati 1.00 1.34 1.36 4.26 10.06 88.09
Bokoro 1.02 1.52 1.51 4.42 12.21 106.97
Bousso 0.85 0.96 1.04 4.02 6.73 58.95
Doba 1.24 2.40 2.25 5.20 26.03 228.0
Faya-Largeau 1.41 3.19 2.90 5.95 45.29 396.72
Mao 1.22 2.32 2.17 5.11 24.07 210.85
Mongo 1.45 3.36 3.05 6.11 50.54 442.77
Moundou 1.29 2.62 2.43 5.41 31.41 275.17
N’Djam´ena 1.53 3.79 3.42 6.54 64.63 566.18
Pala 1.48 3.51 3.17 6.26 54.80 480.01
Sarh 1.11 1.86 1.79 4.70 16.58 145.24
1 2 3 4 5 6 7 8 9 10 11 12
--0
Mean wind speed (m/s)
F
req
uenc
y
0.00 0.05 0.10 0.15 0.20 0.25 0.30 0.35 0.40
Abéché Am Timan Ati Bokoro Bousso Doba Faya-Largeau
Mao Mongo Moundou
Pala Sarh
Djaména N’
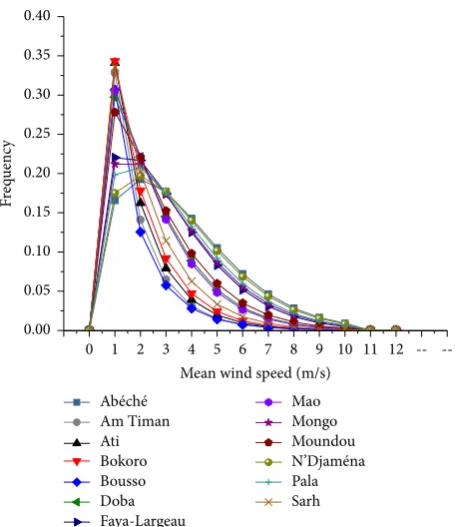
Figure 5: Frequency distributions of monthly mean wind speed for all stations.
a similar tendency of wind speeds on both frequency and cumulative density. However, the frequency peaks in the range of 2 to 3 m/s for the two regions in the upper part of the country and between 1 and 2 m/s for the lower part of the country. This indicates that most of the wind energy lies in these ranges. This information is very practical and can be used to determine the amount of power which can be gener-ated in a given speed band and could also help in selecting a suitable wind turbine for each particular site.
0 1 2 3 4 5 6 7 8 9 10 11
Mean wind speed (m/s) 0.0
0.2 0.4 0.6 0.8 1.0
F
(v)
Abéché Am Timan Ati Bokoro Bousso Doba Faya-Largeau
Mao Mongo Moundou
Pala Sarh
[image:7.600.57.287.320.584.2]Djaména N’
Figure 6: Cumulative distributions of monthly mean wind speed for all stations.
5.4. Polar Diagrams. Evaluation of wind direction helps to
[image:7.600.318.544.321.585.2]5%
10%
20%
15%
South
East North
West
Wind speed (m/s)
>10.0 (1.4%)
8.0–10.0 (6.3%)
6.0–8.0 (18.5%)
4.0–6.0 (33.4%)
2.0–4.0 (40.3%)
[image:8.600.62.278.71.329.2]<2.0 (0.1%)
Figure 7: Polar diagram: wind direction for Ab´ech´e.
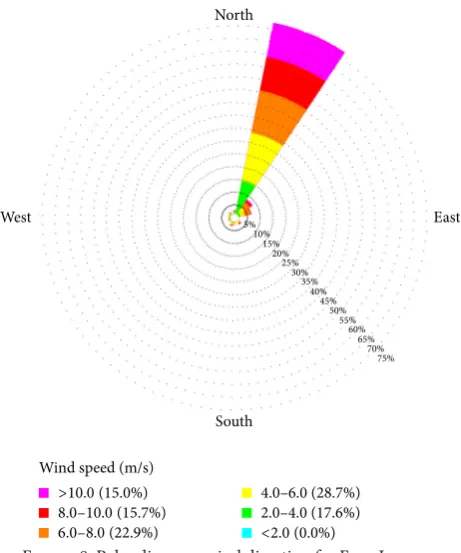
Wind speed (m/s)
>10.0(15.0%)
8.0–10.0(15.7%)
6.0–8.0(22.9%)
4.0–6.0 (28.7%)
2.0–4.0 (17.6%)
<2.0(0.0%)
10%
5%
15%
40%
45%
50%
55%
60%
65%
70%
75%
35%
20%
25%
30%
South
East North
West
Figure 8: Polar diagram: wind direction for Faya-Largeau.
in the Saharan and Sahel zones was northeast throughout the year, while in the Sudanian zone the direction prevailed at various directions. In Moundou, for example, the most frequent wind direction was dominated by the southwestern wind. Meanwhile, in Pala and Sarh, the wind direction pre-vailed, respectively, in north and south directions throughout 2014.
Wind speed (m/s)
>10.0(0.3%)
8.0–10.0 (0.8%)
6.0–8.0 (6.8%)
4.0
2.0–4.0 (61.0%)
<2.0(0.1%)
South
East North
West
5%
10%
15%
[image:8.600.335.524.74.307.2]–6.0 (31.0%)
Figure 9: Polar diagram: wind direction for Moundou.
Wind speed (m/s)
>10.0(0.3%)
8.0–10.0(1.2%)
6.0–8.0(8.6%)
4.0–6.0(28.6%)
2.0–4.0(53.0%)
<2.0(8.2%)
South
East North
West
5%
10%
15%
Figure 10: Polar diagram: wind direction for Ndjamena.
6. Conclusion and Future Direction
[image:8.600.323.530.344.590.2] [image:8.600.55.286.358.635.2]Wind speed (m/s)
10.0(0.3%)
>
8.0–10.0(2.3%)
6.0–8.0(11.8%)
4.0–6.0(21.9%)
2.0–4.0(63.5%)
<2.0(0.2%)
5%
10%
20%
25%
15%
South
East North
[image:9.600.65.275.73.316.2]West
Figure 11: Polar diagram: wind direction for Pala.
Wind speed (m/s)
>10.0(0.3%)
8.0–10.0(0.4%)
6.0–8.0(2.6%)
4.0–6.0(22.2%)
2.0–4.0(59.5%)
<2.0(15.1%)
5%
10%
20%
25%
15%
South
East North
[image:9.600.68.271.358.609.2]West
Figure 12: Polar diagram: wind direction for Sarh.
The seasonal variations of the mean wind speed data show that higher wind speeds are available when the weather condition is generally dry, that is, November to May, and lower wind speed is found when the weather condition is wet, that is, June to October. This trend is applicable for all the thirteen sites under investigation. Interestingly, it was learned that higher electrical energy demand in the country is also in this period (dry season).
Moreover, the data presented also revealed that the monthly mean wind speed varies in a wide range in each geographical zone. In the Sahel zone, for example, it ranged between 1 and 4 m/s, though most of the stations in this region have shown reasonably strong wind speed of more than 2 m/s. The same behavior was also noticed at the Sudan-ian zone.
It was observed that the sites in the middle of Sahel and Sudanian zones tend to show lower mean wind speed com-pared to the others. However, in general, higher wind poten-tials are witnessed as one moves towards the Saharan region. It is also worth noting that the peak monthly mean wind speed was 4.5 m/s and it was found in Ndjamena in the month of March. Meanwhile, the lowest monthly average wind speed was less than a unit and was found in Bousso.
Based on yearly averaged data, the most recommended site for wind energy generation in Chad would be Ab´ech´e, fol-lowed by Ndjamena, Pala, Mongo, and Faya-Largeau, which are the stations that possess mean wind speed of more than 3 m/s at 10 m height above ground level. These sites exhibited wind power density in the range of 45–69 W/m2 and cor-responding wind energy density values ranged between 400 and 600 kWh/m2/year. However, although the wind energy potential in Chad is promising for most of the sites under study for small-scale applications, it is concluded that few stations in the middle of Sudanian and Sahel regions (Am Timan, Bousso, Bokoro, and Ati) are not feasible for wind energy generation due to their weak mean wind speed of around 1 m/s.
In terms of wind direction, the prevailing wind direction for both Saharan and Sahel region was dominated by north-eastern wind. However, the wind direction in every station at the Sudanian region prevailed at different directions. The most probable wind speed direction was southwest in Moun-dou, dominated by northern wind in Pala and southern wind in Sarh.
It is recommended in the future to develop a wind map at the other parts of the Saharan region and some locations close to Lake Chad. The data should be recorded at various heights above ground level and it will then be used for developing wind atlas for Chad which will encourage the development of wind energy projects in the country.
Conflicts of Interest
The authors declare that there are no conflicts of interest regarding the publication of this paper.
Acknowledgments
References
[1] Y. S. Mohammed, M. W. Mustafa, and N. Bashir, “Status of renewable energy consumption and developmental challenges in Sub-Sahara Africa,”Renewable and Sustainable Energy Re-views, vol. 27, pp. 453–463, 2013.
[2] K. S. P. Kumar and S. Gaddada, “Statistical scrutiny of Weibull parameters for wind energy potential appraisal in the area of northern Ethiopia,”Renewables: Wind, Water, and Solar, vol. 2, no. 1, p. 1, 2015.
[3] International Energy Agency (IEA), World Energy Outlook, 2016, http://www.worldenergyoutlook.org/resources/energy-development/energyaccessdatabase.
[4] A. S. Ahmed, “Wind energy as a potential generation source at Ras Benas, Egypt,”Renewable and Sustainable Energy Reviews, vol. 14, no. 8, pp. 2167–2173, 2010.
[5] A. D. Mukasa, E. Mutambatsere, Y. Arvanitis, and T. Triki, “Development of wind energy in Africa,” Report, African Development Bank, 2013.
[6] D. H. Didane, A. A. Wahab, S. S. Shamsudin, N. Rosly, M. F. Zulkafli, and S. Mohd, “Assessment of wind energy potential in the capital city of Chad, N’Djamena,”AIP Conference Proceed-ings, vol. 1831, no. 1, p. 020049.
[7] C. McSweeney, M. New, and G. Lizcano, UNDP Climate Change Country Profiles, Chad, 2010, http://www.geog.ox.ac.uk/resea- rch/climate/projects/undp-cp/UNDP_reports/Chad/Chad.hir-es.report.pdf.
[8] Wikivoyage, 2016 https://en.wikivoyage.org/wiki/Chad. [9] S. Rehman, “Wind energy resources assessment for Yanbo,
Saudi Arabia,”Energy Conversion and Management, vol. 45, no. 13-14, pp. 2019–2032, 2004.
[10] R. Kose, M. A. Ozgur, O. Erbas, and A. Tugcu, “The analysis of wind data and wind energy potential in Kutahya, Turkey,”
Renewable and Sustainable Energy Reviews, vol. 8, no. 3, pp. 277– 288, 2004.
[11] I. Y. Lun and J. C. Lam, “A study of Weibull parameters using long-term wind observations,”Renewable Energy, vol. 20, no. 2, pp. 145–153, 2000.
[12] R. M. R. Kainkwa, “Wind speed pattern and the available wind power at Basotu, Tanzania,”Renewable Energy, vol. 21, no. 2, pp. 289–295, 2000.
[13] M. Siti, M. Norizah, and M. Syafrudin, “The evaluation of wind energy potential in peninsular Malaysia,”International Journal, vol. 2, no. 4, 2011.
[14] S. Mathew and G. S. Philip, Eds.,Advances in Wind Energy and Conversion Technology, vol. 20, Springer, Berlin, Germany, 2011. [15] C. G. Justus, W. R. Hargraves, A. Mikhail, and D. Graber, “Methods for estimating wind speed frequency distributions,”
Journal of Applied Meteorology, vol. 17, no. 3, pp. 350–353, 1978. [16] D. Wood, “Small wind turbines,” inAdvances in Wind Energy Conversion Technology, pp. 195–211, Springer, Berlin, Germany, 2011.
[17] M. R. Islam, R. Saidur, and N. A. Rahim, “Assessment of wind energy potentiality at Kudat and Labuan, Malaysia using Wei-bull distribution function,”Energy, vol. 36, no. 2, pp. 985–992, 2011.
[18] A. A. Shata and R. Hanitsch, “Evaluation of wind energy poten-tial and electricity generation on the coast of Mediterranean Sea in Egypt,”Renewable Energy, vol. 31, no. 8, pp. 1183–1202, 2006. [19] P. Ram´ırez and J. A. Carta, “Influence of the data sampling interval in the estimation of the parameters of the Weibull wind
speed probability density distribution: a case study,” Energy Conversion and Management, vol. 46, no. 15, pp. 2419–2438, 2005.
[20] K. Ulgen and A. Hepbasli, “Determination of Weibull param-eters for wind energy analysis of Izmir, Turkey,”International Journal of Energy Research, vol. 26, no. 6, pp. 495–506, 2002. [21] A. S. S. Dorvlo, “Estimating wind speed distribution,”Energy
Conversion and Management, vol. 43, no. 17, pp. 2311–2318, 2002. [22] M. Y. Sulaiman, A. M. Akaak, M. A. Wahab, A. Zakaria, Z. A. Sulaiman, and J. Suradi, “Wind characteristics of Oman,”
Energy, vol. 27, no. 1, pp. 35–46, 2002.
[23] V. M. Karsli and C. Gec¸it, “An investigation on wind power potential of Nurdaˇgı-Gaziantep, Turkey,”Renewable Energy, vol. 28, no. 5, pp. 823–830, 2003.
[24] R. Tchinda and E. Kaptouom, “Wind energy in Adamaoua and North Cameroon provinces,”Energy Conversion and Manage-ment, vol. 44, no. 6, pp. 845–857, 2003.
[25] A. N. Celik, “A statistical analysis of wind power density based on the Weibull and Rayleigh models at the southern region of Turkey,”Renewable Energy, vol. 29, no. 4, pp. 593–604, 2004. [26] E. K. Akpinar and S. Akpinar, “An assessment on seasonal
analy-sis of wind energy characteristics and wind turbine character-istics,”Energy Conversion and Management, vol. 46, no. 11, pp. 1848–1867, 2005.
[27] O. A. Jaramillo and M. A. Borja, “Bimodal versus Weibull wind speed distributions: an analysis of wind energy potential in La Venta, Mexico,”Wind Engineering, vol. 28, no. 2, pp. 225–234, 2004.
[28] D. Weisser, “A wind energy analysis of Grenada: an estimation using the ‘Weibull’ density function,”Renewable Energy, vol. 28, no. 11, pp. 1803–1812, 2003.
[29] M. Jamil, S. Parsa, and M. Majidi, “Wind power statistics and an evaluation of wind energy density,”Renewable Energy, vol. 6, no. 5, pp. 623–628, 1995.
[30] S. O. Oyedepo, M. S. Adaramola, and S. S. Paul, “Analysis of wind speed data and wind energy potential in three selected locations in South-East Nigeria,”International Journal of Energy and Environmental Engineering, vol. 3, no. 1, p. 7, 2012. [31] S. Mathew and K. P. Pandey, “Analysis of wind regimes for
energy estimation,”Renewable Energy, vol. 25, no. 3, pp. 381– 399, 2002.
,QWHUQDWLRQDO-RXUQDORI
$HURVSDFH
(QJLQHHULQJ
+LQGDZL3XEOLVKLQJ&RUSRUDWLRQ
KWWSZZZKLQGDZLFRP 9ROXPH
Robotics
Journal ofHindawi Publishing Corporation
http://www.hindawi.com Volume 2014
Hindawi Publishing Corporation
http://www.hindawi.com Volume 2014
Active and Passive Electronic Components
Control Science and Engineering
Journal of
Hindawi Publishing Corporation
http://www.hindawi.com Volume 2014
Machinery
Hindawi Publishing Corporation
http://www.hindawi.com Volume 2014
Hindawi Publishing Corporation http://www.hindawi.com
Journal of
(QJLQHHULQJ
Volume 201Submit your manuscripts at
https://www.hindawi.com
VLSI Design
Hindawi Publishing Corporation
http://www.hindawi.com Volume 201
-Hindawi Publishing Corporation
http://www.hindawi.com Volume 2014
Shock and Vibration
Hindawi Publishing Corporation
http://www.hindawi.com Volume 2014
Civil Engineering
Advances inAcoustics and VibrationAdvances in Hindawi Publishing Corporation
http://www.hindawi.com Volume 2014
Hindawi Publishing Corporation
http://www.hindawi.com Volume 2014
Electrical and Computer Engineering
Journal of
Advances in OptoElectronics
Hindawi Publishing Corporation
http://www.hindawi.com Volume 2014
The Scientific
World Journal
Hindawi Publishing Corporation
http://www.hindawi.com Volume 2014
Sensors
Journal ofHindawi Publishing Corporation
http://www.hindawi.com Volume 2014
Modelling & Simulation in Engineering Hindawi Publishing Corporation
http://www.hindawi.com Volume 2014
Hindawi Publishing Corporation
http://www.hindawi.com Volume 2014
Chemical Engineering
International Journal of Antennas and
Propagation International Journal of
Hindawi Publishing Corporation
http://www.hindawi.com Volume 2014
Hindawi Publishing Corporation
http://www.hindawi.com Volume 2014
Navigation and Observation International Journal of
Hindawi Publishing Corporation
http://www.hindawi.com Volume 2014
![Figure 1: Geographical map of Chad [8].](https://thumb-us.123doks.com/thumbv2/123dok_us/8754097.892531/2.600.363.496.75.247/figure-geographical-map-of-chad.webp)