Simulation of Comparison from NRZ and RZ Pulse in
Free Space Optics with Different Weather Conditions
Muhammad Rangga Hadisiswoyo, Octarina Nur Samijayani
*, Ary Syahriar, Indrawan Arifianto
Department of Electrical Engineering, University of Al Azhar Indonesia, Indonesia
Copyright©2019 by authors, all rights reserved. Authors agree that this article remains permanently open access under the terms of the Creative Commons Attribution License 4.0 International License
Abstract
FSO (Free Space Optic) is a form of optical technology communication by transmitting light to media free space. In the FSO system, the data transmission can be larger, namely 1-100 Gbps, and this is due to the large bandwidth width. FSO runs at a wavelength of 850 nm and 1550 nm. FSO is usually with a maximum distance of 2-4 km. This paper simulates the FSO optical transmission system using NRZ and RZ line coding in bright and rainy weather conditions. The parameters analyzed are Eye diagram, Optical Spec-trum, photocurrent, and received signal power. In the FSO line coding system, NRZ has an eye height value, received signal power and received photocurrent is greater than the RZ line coding at a distance of 1 km and 5 km in bright and rainy conditions. In the trial of this FSO communication system, it is better to use it at a distance of 1 km, because the received signal power is above 20 dBm and received photocurrent is still above 800 mA for NRZ and RZ line coding. This is due to the attenuation value of sunny weather conditions that are smaller between 0.2-3 dB/km, while in rain conditions between 4-17 dB/km.Keywords
FSO, Eye Diagram, Signal Power,Photocurrent, Optical Spectrum
1. Introduction
FSO (Free Space Optics) is an optical communication technology in which data is transmitted by light propagation in empty space that allows optical connectivity. The FSO works almost similar to the OFC (Optical Fiber Optics) network but the only difference is that the FSO is sent by free air while the OFC is sent using glass fiber using cables. FSO communication offers a wide bandwidth potential that can provide high data rates [17]. Making this type of communication system is very interesting in meeting the consumers’ large demand supported by high internet.
FSO is an environmentally friendly communication system because it has low price, high-speed data transmission and is easy licensed in the building window. Using an FSO can send data over 1-100 Gbps due to the large bandwidth width. FSO runs at a wavelength of 850 nm and 1550 nm [16]. FSO data links can be fully integrated into current short and longhaul high speed optical networks. Utilizing current 1550 nm technology platforms FSO data links can fully attain current system architectures, additionally the systems can be completely scaled to higher data rates and configurations. So that the FSO system provides comfort to the user [18]. FSO is usually with a maximum distance of 2-4 km.
There are several shortcomings of the FSO (Free Space Optics) communication system in poor weather conditions, which will affect the work of the FSO, like in obstruction of rain, fog, and dew. In addition to weather factors, there are also technical factors, like the lack of precision in the installation of light between FSO, blocked by escalators.
2. Theoretical Foundation
2.1. FSO Communication System (Free Space Optics)
Figure 1. FSO Network System [2]
Figure 2. FSO Communication Work System [3]
2.2. FSO Communication Work System
In the FSO communication work system, network traffic becomes pulses that have binary numbers, namely numbers 1 and 0. After that, the transmitter works to send data through an air intermediary with light. Then, the receiver will receive data from the transmitter via the photodetector. In the end, the signal obtained from the receiver will be connected to fiber or copper connected to the network.
For the formula at [13]:
PReceived = PTransmitted dR 2
(dT+θR)210
−α10R (1)
Where: dR = Receiver aperture diameter (m) dT = Transmitter aperture diameter (m)
θ = Beam divergence (mrad) R = Range (km)
α = Atmospheric attenuation (dB/km)
2.3. Damping Concept on Geometry
In the concept of geometric attenuation caused by deviations from beam optic transmission between the transmitter and receiver with the following equation [7]:
Lgeo(dB) = 10 log�d1+100Lθd2 � 2
(2)
With 𝐿𝐿𝑔𝑔𝑒𝑒𝑜𝑜 is geometric attenuation (dB), 𝑑𝑑1 and 𝑑𝑑2 are optical transmitters and receivers (cm), L is the distance between sender and receiver (km), and θ is the angle of divergence (mrad) [8].
2.4. Signal to Noise Ratio (SNR)
Noise in the FSO system can be divided into two parts, namely thermal noise and shot noise. The SNR value on the FSO system is as follows [9]:
SNRFSO =
(ℜPR)2
2qiSB+4kTB/RL (3) ℜis the recipient's responsiveness at λ = 1550 nm, q is the large electron charge (C), B is the bandwidth (Hz), i_S the received signal current (mA), k is the Boltzman constant (J/K), T is the temperature (K) and RL is load resistance (Ω) [8].
2.5. Bit Error Rate
The FSO system BER parameter Algorithm defines the numerical method to use for the BER estimation. Assuming Gaussian noise with the standard deviations σ0 and σ1, the BER is [12]:
Pe =
M
N+M Pe0+ N
Where P0 and P1 are the probabilities of the symbols, M is the number of samples for the logical 0, and N is the number of samples for the logical 1. Also, Pe0 and Pe1 are:
Pe0=12erfc� S-μ0 √2σ0�
(5) Pe1=
1
2erfc� 𝜇1-S
√2𝜎1� (6)
Where µ0, µ1, σ0 and σ1 are average values and standard deviations of the sampled values respectively, and S is the threshold value.
An enhancement of the simple Gaussian approximation can be achieved by averaging the separately estimated BERs for different sampled symbols [14]. For M sampled values for the logical 0 and N sampled values for the logical 1, the corresponding error rates are:
Pe1=
1
2N∑ erfc
N
i=1 �
𝜇1𝑖-S
√2𝜎1𝑖� (7) Peo=2M1 ∑ erfc
M
i=1 �
µ0i-S
√2σ0i� (8) The eye height is calculated by [15]
EH =
(
u1−3σ1)
−(u0+ 3σ0) (9)2.6. Receiver Power
In the equation to calculate the receiving power as follows [10]:
P𝑟= P𝑡 L𝑎𝑡𝑚 L𝑎X + 𝑛𝑛FSO(t) (10)
At 𝐿𝐿𝑎𝑎𝑡𝑡𝑚𝑚 is atmospheric losses which include loss of weather and scintillation losses (𝐿𝐿𝑠𝑠𝑖𝑖𝑛𝑛t), while 𝐿𝐿𝛼𝛼 includes geometric losses (𝐿𝐿𝐺𝐺𝑒𝑒𝑜𝑜), and system losses (𝐿𝐿𝑠𝑠𝑖𝑖𝑠𝑠𝑡𝑡𝑒𝑒𝑚𝑚), 𝑋𝑋 are variations in signal fading un-der turbulence conditions with probability of fluctuating indices bias, 𝑛𝑛𝐹𝐹𝑆𝑆𝑂𝑂 (𝑡𝑡) is the characteristic of AWGN (Additive white Gaussian noise), and 𝑃𝑃𝑡𝑡 and 𝑃𝑃𝑟𝑟 are calculated in mW [8]. After that, it can only calculate the signal power (dBm).
2.7. NRZ and RZ Pulse
In telecommunication, NRZ and RZ systems pulse is a type of line coding. Line coding is a process of converting digital data into digital signals, assuming that data contains or takes the form of faxes, numbers, images, audio, or video stored in computer memory as bit sequences [10]. In nonre-turn to zero (NRZ) modulation is a binary code that is represented by one significant condition, usually a posi-tive voltage, while zero is represented by a negative voltage. Pulses on NRZ have more energy than return to zero (RZ). While modulation of return to zero (RZ) describes line code used where at the time the signal drops to zero between each pulse in the telecommunications signal. This will occur even if 0 or 1 consecutive numbers occur in the converted signal [4].
The NRZ Pulse component produces rectangular non-return to zero (NRZ) electrical pulses with the
following edge shapes is exponential [5]:
E(t) =
⎩ ⎪ ⎨ ⎪
⎧1− 𝑒𝑒−�𝐶𝑟𝑡�
, 0 ≤ 𝑡𝑡 ≤ 𝑡𝑡1 1 ,𝑡𝑡1≤ 𝑡𝑡 <𝑡𝑡2
𝑒𝑒−� 𝑡
𝐶𝑓� ,𝑡𝑡2≤ 𝑡𝑡 <𝑇
(11)
And the RZ Pulse component produces rectangular return to zero (RZ) electrical pulses with the following edge shapes is exponential [5]:
E(t) =
⎩ ⎪ ⎨ ⎪
⎧1− 𝑒𝑒−�𝐶𝑟𝑡�, 0 ≤ 𝑡𝑡 ≤ 𝑡𝑡1 1 ,𝑡𝑡1≤ 𝑡𝑡 <𝑡𝑡2
𝑒𝑒−� 𝑡
𝐶𝑓� ,𝑡𝑡2≤ 𝑡𝑡 <𝑡𝑡𝑐 0 ,𝑡𝑡𝑐 ≤ 𝑡𝑡 <𝑇
(12)
2.8. Different Weather Conditions
The bad weather conditions will affect the performance of the communication system of the FSO, such as sunny, rainy, snowy, thin fog and thick weather. The following is the weakening distance of the FSO communication system, namely:
Table 1. Attenuation with Different Weather Conditions [6]
Condition Attenuation
Bright 0.2-3 dB/km
Rain 4-17 dB/km
Snow 20-30 dB/km
Luminous Mist 40-17 dB/km
[image:3.595.342.476.95.152.2]Thick fog 80-200 dB/km
Figure 3. FSO System Design Flow Chart
2.9. Free Space Optics System Design
[image:3.595.310.534.375.614.2]analyzer (Bit Error Rate Analyzer), then the eye diagram will be obtained in this simulation.
2.10. FSO Communication System Design Specifications
[image:4.595.311.533.165.479.2]The following are the design specifications of the combined FSO communication system, below this:
Table 2. FSO Communication System Design Specifications [11]
Design Parameters Value
Bit Rate 1 Gps
Power 20 dBm
Frequency 1550 nm
Transmitter aperture diameter 10 cm
Receiver aperture diameter 30 cm
Link Range 1-5 km
Beam divergence 0.2 mrad
Detector gain 10
Responsivity 9
Attenuation 0.7 and 5 dB/km
Sequence length 128 bit
2.11. Results from Eye Diagram and Optical Spectrum Analyzer
[image:4.595.59.288.207.384.2]The following is a comparison of the simulation results from eye diagrams with attenuation of 0.7 dB/km as well as bright weather conditions within 1 km using NRZ and RZ coding line, below this:
Figure 4. Graph of Comparison on Eye Diagrams in NRZ and RZ Line Coding
Figure 5 is a Graph of comparison on eye diagrams in NRZ and RZ Line Coding. In this graph the distance used is 1 km. In the picture above, the eye diagram of the NRZ line coding is more perfect than the eye diagram of the RZ
line coding. While figure 5 (a) and figure 5 (b) are the results of a graph of the comparison of the Optical Spectrum Analyzer using NRZ and RZ line coding with bright weather conditions at 1 km. This makes the results of the Optical Spectrum Analyzer characteristic of NRZ and RZ line coding.
(a)
(b)
Figure 5. (a) Graph of the Optical Spectrum Analyzer between wavelengths with power uses NRZ line coding in bright and rainy conditions at attenuation 0.7 and 5 dB/km, (b) Graph of the Optical Spectrum Analyzer between wave-length with power uses RZ line coding in bright and rainy conditions at attenuation 0.7 and 5 dB/km
2.12. Eye Height Graph Results
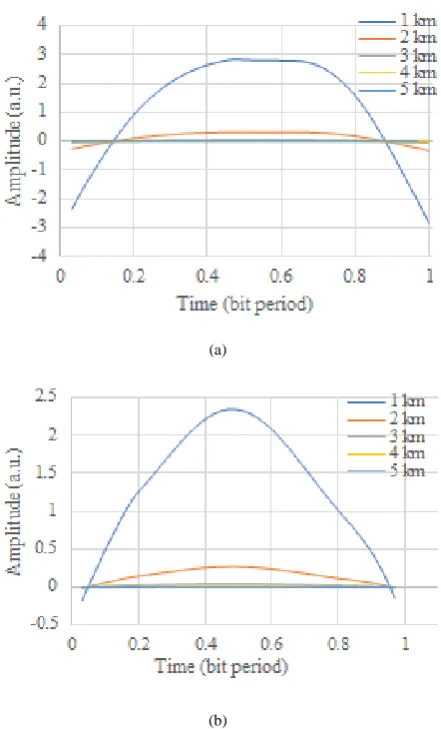
Figure 6 (a) and figure 7 (a) are two graphs of eye height in the NRZ line coding in bright weather conditions and rain with attenuation of 0.7 and 5 dB/km. Eye height is the result of one of the eye diagram graphs. In figure 6 (a) the highest amplitude is at eye height at 1 km, its maximum amplitude is 7.49 at 0.5 s. While in figure 7 (a) the highest amplitude is at eye height at 1 km, the maximum amplitude is 2.83 at 0.46 s.
[image:4.595.70.285.489.659.2]2.13. Results of Data Processing Comparison of NRZ with RZ Line Coding in Bright Weather
Figure 8 (a) is a graph of between received signal power with distance using NRZ and RZ line coding in bright conditions at attenuation of 0.7 dB/km. In figure 8 (a) NRZ line coding has a received signal power value greater than the RZ line coding at its highest point at 44.78 dBm and its lowest point at 16.61 dBm at a distance of 1 km and 5 km. While the RZ line coding is at its highest point at 40 dBm and its lowest point is at 11.89 dBm at a distance of 1 km and 5 km.
Figure 8 (b) is a graph of between the received photocurrent with distance using line coding NRZ and RZ in bright conditions at attenuation of 0.7 dB/km. In figure 8 (b) NRZ line coding has a received photocurrent value greater than the line coding RZ at its highest point at 4367.65 mA and its lowest point at 170.49 mA at a distance of 1 km and 5 km. While the RZ line coding is at its highest point at 2187.65 mA and its lowest point is at 85.39 mA at a distance of 1 km and 5 km.
(a)
[image:5.595.312.533.76.441.2](b)
Figure 6. (a) Graph of eye height on the NRZ line coding in bright weather conditions with attenuation of 0.7 dB/km, (b) Graph of eye height on the RZ line coding in bright weather conditions with attenuation of 0.7 dB/km.
(a)
[image:5.595.64.284.335.637.2](b)
Figure 7. (a) Graph of eye height on NRZ line coding in rainy weather conditions with attenuation of 5 dB/km, (b) Graph of eye height on RZ line coding in rainy weather conditions with attenuation of 5 dB/km
[image:5.595.311.530.496.676.2](b)
Figure 8. (a) Graph of between received signal power with distance using NRZ and RZ line coding in bright conditions at attenuation of 0.7 dB/km, (b) Graph of between received photocurrent with distance using NRZ and RZ line coding in bright conditions at attenuation of 0.7 dB/km.
2.14. Results of Data Processing Comparison of NRZ with RZ Line Coding in Rainy Weather
Figure 9 (a) is a graph of between received signal power with distance using NRZ and RZ line coding in rain conditions in attenuation 5 dB/km. In figure 9 (a) the NRZ line coding has the received signal power value greater than the RZ line coding at its highest point at 36,18 dBm and its lowest point at -26.38 dBm at a distance of 1 km and 5 km. While the RZ line coding is at its highest point at 31.47 dBm and its lowest point is -31.09 dBm at a distance of 1 km and 5 km.
In rainy conditions it has a decrease in the received signal power value to distance. NRZ line coding at a distance of 4 km received signal power decreased by more than 0 dBm which is -12.9 dBm. Meanwhile, in the RZ line coding, a distance of 3 km is received signal power which is -3.24 dBm. This is because the characteristics of the physical attenuation will be different in different weather conditions too. The attenuation value of bright weather conditions is smaller between 0.2-3 dB / km, while in rain conditions between 4-17 dB / km.
Figure 9 (b) is a graph of between the received photocurrent with distance using NRZ and RZ line coding in the rain conditions in attenuation 5 dB/km. In figure 9 (b) NRZ line coding has a received photocurrent value greater than the RZ line coding at its highest point at 1622.73 mA and its lowest point at 1.2 mA at a distance of 1 km and 5 km. While the RZ line coding is at its highest point at 812.79 mA and the lowest point is at 0.6 mA at a distance of 1 and 5 km.
2.15. Results of Data Processing Comparison of NRZ with RZ Line Coding in Bright and Rainy Weather
Figure 10 (a) is a graph of between received signal
power and distance using NRZ line coding in bright and rainy conditions at attenuation of 0.7 and 5 dB/km. In figure 10 (a) line coding NRZ bright conditions have a received signal power value greater than the NRZ coding line rain conditions at the highest point at 44.78 dBm and the lowest point at 16.61 dBm at a distance of 1 km and 5 km. Whereas NRZ rain conditions at the highest point at 36.18 dBm and the lowest point at -26.38 dBm at a distance of 1 km and 5 km.
Figure 10 (b) is a graph of between received signal power and distance using RZ line coding in bright and rainy conditions at attenuation of 0.7 and 5 dB/km. In figure 10 (b) line coding of RZ bright conditions has a received signal power value greater than the RZ coding line the condition of rain at its highest point at 40 dBm and the lowest point at 11.89 dBm at a distance of 1 km and 5 km. Whereas NRZ rain conditions at its highest point at 31.47 dBm and the lowest point at -31.09 dBm at a distance of 1 km and 5 km.
(a)
(b)
[image:6.595.64.285.82.259.2] [image:6.595.311.535.330.706.2](a)
[image:7.595.62.286.79.410.2](b)
Figure 10. Graph of between received signal power with distance using NRZ line coding in bright and rainy conditions at attenuation 0.7 and 5 dB/km, (b) Graph of between received signal power with distance using RZ line coding in bright and rain conditions at attenuation 0.7 and 5 dB/km.
3. Conclusions
Based on the simulation results, it can be concluded that each NRZ and RZ line coding has its own characteristics, as seen from the results of different Eye Diagram and Optical Spectrum Analyzer diagrams. In the system, the FSO line coding NRZ has an eye height value, received signal power, and receives currents greater than the RZ line encoding at a distance of 1 km and 5 km in bright and rainy conditions. In the trial of this FSO communication system, it is better to use it at a distance of 1 km, because the received signal power is above 20 dBm and received photocurrent is still above 800 mA for NRZ and RZ line coding. This is because the weakening value of sunny weather conditions is smaller between 0.2-3 dB/km, while the weather conditions are between 4-17 dB/km.
Acknowledgements
I am very grateful to Mrs. Octa Octarina Nur Samijayani and Ary Syahriar for guiding me to this international publication and my friends like Indrawan
Arifianto, Salim Burdah, and Rahmat Alamtaha for their participation in this publication.
REFERENCES
Avrina Arum M., Bambang Supeno, S.T., M.T., Ike Fibriani, [1]
S.T., M.T.2014. Throughput Analysis on Free Space Optical Communication for Two Sites. Jember University: Jember.
Hemani Kaushal, Georges Kaddoum.2015. Free Space [2]
Optical Communication: Challenges and Mitigation Techniques. Département de génie électrique, École de technologie supérieure, Montréal (Qc), Canada.
John Schuster.2002. Free Space Optics (FSO) Technology [3]
Overview. Terabeam Corporation.
Shaina, Amit Gupta.2015. Comparative analysis of NRZ, [4]
RZ and Gaussian Pulse generation method in OWC link at different transmitter powers. Department of ECE Chandigarh University: Gharuan, India.
From Optiwave systems Inc. in optical software. [5]
Ashish Kumar, Aakash Dhiman, Devender Kumar, Naresh [6]
Kumar.2013. Free Space Optical Communication System under Different Weather Conditions. Department of Electronics and Communication Engineering, Shoolini University:Solan, India.
Willebrand, Heinz & Ghuman, Baksheesh S. 2002. [7]
“Free-Space Optics: Enabling Optical Connectivity in To-day’s Networks”. Indiana 46240 USA. Sams Publishing.
Juma'inah, Erfan Achmad Dahlan, Onny Setyawati. [8]
Performance Analysis of Orthogonal Frequency Division Multiple Access (OFDMA) Free Space Optic System (FSO) in Bright Weather Conditiob According to Standard ITU-R P.1817. Brawijaya University: Malang.
B. Y. Zhang, Y. Kim, Y. Park, and K. -D. Kim.2011. [9]
“Performance Anlysis of Hybrid FSO/RF System”, presented at the 2011 third International Conference Ubiquitous and Future Networks (ICUFN), Dallian, China IEEE, June 15-17.
Bekkali, Abdelmoula dkk. 2009. Performance Analysis of [10]
SCM-FSO Link for Transmission of CDMA Signal under Gamma-Gamma Turbulent Channel. In Proceedings of the IEEE Military.
Sindhu C, Aparnadevi P S.2016. Effect of Ternary Optical [11]
Linecode in Free Space Optics under Atmospheric Disturbances. Dept. of ECE, Govt. Model Engineering College, Ernakulam, Kerala, India.
G.P. Agrawal, (1997) "Fiber Optic Communication [12]
Systems," John Wiley & Sons, New York, 1997.
S. Bloom, E. Korevaar, J. Schuster, H. Willebrand, [13]
J.C. Cartledge, G.S. Burley, “The Effect of Laser Chirping [14]
on Lightwave System Performance,” IEEE Journal of Lightwave Technology, Vol. 7, No. 3, 1989, S. 568-573.
D. Derickson, “Fiber Optic Test and Measurement,” Prentice [15]
Hall, New Jersey, 1998.
Haryadi, Sigit, & Martinus Hadi Satria. 2004. Wireless [16]
Optical Communication for Outside Use. [Online]. Available:
http://telecom.ee.itb.ac.id/~sigit/Wireless_Optical_Commu nication_Outdoor_SH.pdf
Aditi Malik, Preeti Singh.2015. Free Space Optics: Current [17]
Applications and Future Challenges. University Institute of Engineering & Technology, Panjab University, Chandigarh, India.
Thomas Malcolm ChaffeePaul, F. Szajowski.2018. [18]
![Figure 1. FSO Network System [2]](https://thumb-us.123doks.com/thumbv2/123dok_us/8753274.892378/2.595.126.466.78.422/figure-fso-network-system.webp)
![Table 1. Attenuation with Different Weather Conditions [6]](https://thumb-us.123doks.com/thumbv2/123dok_us/8753274.892378/3.595.310.534.375.614/table-attenuation-different-weather-conditions.webp)
![Table 2. FSO Communication System Design Specifications [11]](https://thumb-us.123doks.com/thumbv2/123dok_us/8753274.892378/4.595.311.533.165.479/table-fso-communication-system-design-specifications.webp)