International Journal of Emerging Technology and Advanced Engineering
Website: www.ijetae.com (ISSN 2250-2459,ISO 9001:2008 Certified Journal, Volume 3, Issue 7, July 2013)
582
Review on different Surface Energy Balance algorithms for
Estimation of Evapotranspiration through Remote Sensing
Er. Anju Bala
1, Dr. Ram Karan Singh
2, Dr V. Gayathri
3 1Assistant Professor and Coordinator, Department of Civil Engineering, World College of Technology and Management, Gurgaon
2Professor and Head, 3Associate Professor, Department of Civil Engineering, ITM University, Gurgaon
Abstract-- Evapotranspiration (ET), which governs the water cycle and energy transport among the biosphere, atmosphere and hydrosphere as a controlling factor, plays an important role in hydrology, meteorology, and agriculture. On a global basis, the mean ET from the land surface accounts for approximately 60% of the average precipitation. It is therefore indispensable to have reliable information on the land surface ET when natural hazards such as floods and droughts are predicted and weather forecasting and climate change modelling are performed. Irrigation water use accounts for about 70% of water withdrawals worldwide and for more than 90% of the water consumption and irrigation water use has been believed to be the most important cause of the increase of water use in most countries. Evapotranspiration is perhaps the most difficult hydrological flux to measure or model especially at regional scales and greater. The surface energy balance provides through latent heat flux a direct assessment of actual ET which is highly useful for water management. The main objective of this paper to review different surface energy balance algorithms which are used for estimation of ET through remote sensing and detail out their advantages and disadvantages.
Keywords- Evapotranspiration, Remote Sensing, Water
Management, Surface Energy Balance algorithm
I. INTRODUCTION
Evapotranspiration (ET) is a term used to describe the loss of water from the Earth’s surface to the atmosphere by the combined processes of evaporation from the open water bodies, bare soil and plant surfaces, etc. and transpiration from vegetation or any other moisture containing living surface. Evapotranspiration is perhaps the most difficult hydrological flux to measure or model especially at regional scales and greater. Major progress in linking evapotranspiration processes with energy exchange came about in the 20th century where the work of penman 1948 laid the foundation for relating evapotranspiration to meteorological variable (Allen et al; 1998 ). Today one of the most commonly used methods for estimating Evapotranspiration is the Penman-Monteith method .But this method is point based not applicable for large heterogeneous areas.
However physically- based models like the Penman – Monteith equation often require large amount of detailed information that may be impractical to obtain over large areas (jiang et al, 2004).
Because of such reason there is need of technologies which can give ET value on a continuous basis for shorter time duration & this is possible only through Remote sensing. In the recent time number of satellites has been launched in the space which can provide imageries on a continuous basis for a shorter time interval which can be used in ET computation for a particular crop pattern which will be very useful tool for precision farming system in the years to come. Estimation of water consumption based on ET models using remotely sensed data has become one of the hot topics in water resources planning and management. and remotely sensed images have provided a promising source of data for examining the characteristics of land surfaces.
There are several energy balance algorithm till date which are available for calculating ET through Remote Sensing. Various scientists used different algorithm in different parts of world and also gave satisfactory results. Like Aymn Elhaddad et al (2011) used ReSET model (This model is built on the same theoretical basis of METRIC) (Allen et al. 2007 a.b ) and SEBAL (Bastiaansen et al 1998 a.b.) with the additional ability to handle data from multiple weather stations of that uses a procedure to deal with the spatial and temporal variability of ET at Arkansas River Basin in Colarado. And found ReSET model as a tool for water management.
In Notwane sub catchment of Limpop basin of Bostwana, B. F. Alernaw & B. Mungal (2009) used Remote Sensing to determine ET based on (S-Sebi) using Modis data and found this model provides a relatively less data-intensive method of determining the spatial variation of ET in semi arid regions also recommended that more time series satellite imagery data should be acquired and further used for calibration and verification.
International Journal of Emerging Technology and Advanced Engineering
Website: www.ijetae.com (ISSN 2250-2459,ISO 9001:2008 Certified Journal, Volume 3, Issue 7, July 2013)
583
II. SURFACE ENERGY BALANCE MODELS
Remote sensing based energy balance algorithms convert satellite sensed radiances into land surface characteristics such as albedo, leaf area index, vegetation indices, surface roughness, surface roughness, surface emissivity, and surface temperature to estimate ET as a ―residual‖ of the land surface energy balance equation: LE = – G - H (1)
Net Radiation (Rn) = Net radiation (Rn) represents the total heat energy that is partitioned into G, H and LE. It can be estimated from the sum of the difference between the incoming (Rs) and the reflected outgoing shortwave solar radiation (0.15 to 5 μm), and the difference between the downwelling atmospheric and the surface emitted and
reflected longwave radiation (3 to 100 μm), which can be expressed as (Jackson 1985, Kustas 1999)
= (1- αs) Rs + ϵsϵaϭTa4-εsϭTs4 (2)
Where αs is surface shortwave albedo, usually
calculated as a combination of narrow band spectral reflectance values in the bands used in the remote sensing (Liang 2004), Rs is determined by a combined factors of solar constant, solar inclination angle, geographical location and time of year, atmospheric transmissivity, ground elevation, etc (Allen(2007). ϵs is surface emissivity
evaluated either as a weighted average between bare soil and vegetation (Li 1999) or as a function of NDVI (Bastiaansen 1998), ϵa is atmospheric emissivity estimated
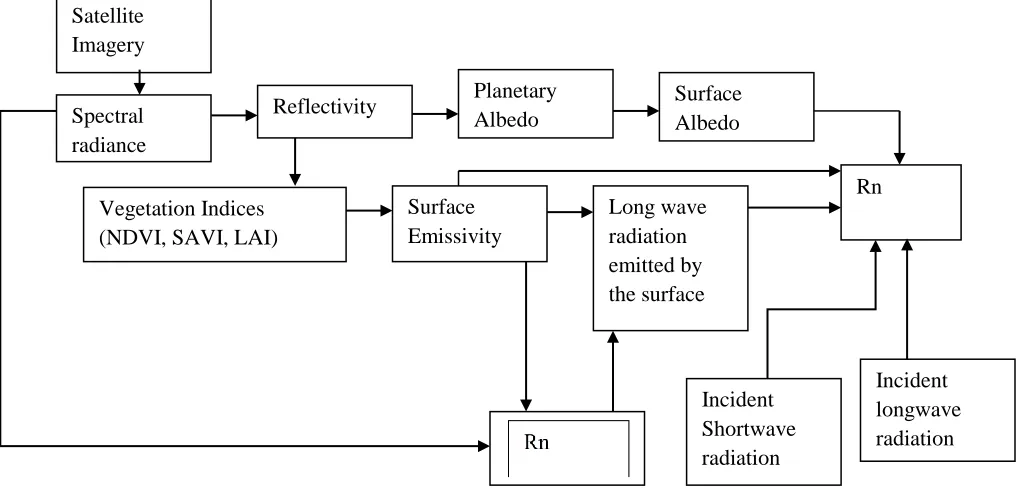
[image:2.612.49.559.324.569.2]as a function of vapour pressure (Brutsaert 1985).
Figure 1. - Flowchart of computational steps used to obtain Rn at the land surface.( Zhao-Liang Li,2009)
Ground Heat Flux (G): It is measured with the sensors buried beneath the surface soil. It is the heat energy used for warming or cooling the soil surface. Due to its variability from dry bare soil to highly well watered vegetated areas it is not accurately calculated. But the value is G is very small as compared to Rn at the daytime overpass time of satellites. Estimation error of G will thus have a small effect on the calculated latent heat flux (Jackson 1985, Kustas 1996)
Sensible Heat Flux (H): It is the heat transfer between ground and atmosphere and is the driving force to warm/cool the air above the surface. In the energy balance algorithm it is calculated by combining the difference of aerodynamic and air temperatures with the aerodynamic resistance ( ) from:
H = (Taero -Ta)/ra (3)
Satellite
Imagery
Spectral
radiance
Reflectivity
Planetary
Albedo
Surface
Albedo
Rn
Vegetation Indices
(NDVI, SAVI, LAI)
Incident
longwave
radiation
Incident
Shortwave
radiation
Surface
Emissivity
International Journal of Emerging Technology and Advanced Engineering
Website: www.ijetae.com (ISSN 2250-2459,ISO 9001:2008 Certified Journal, Volume 3, Issue 7, July 2013)
584
Where ρa is air density (kg m-3), Cp is specific heat
capacity of the air (J kg-1 K-1), and ra is aerodynamic
resistance for heat transfer (s m-1). Tsand Taare surface and
air temp expressed in Kelvin. For example, Brown and Rosenberg (1973) and Brown (1974) used the surface radiometric temperature and air temperature difference (Ts - Ta) and the aerodynamic resistance (ra) to estimate H,
where the canopy or surface temperature was obtained from remotely sensed radiometric temperature using thermal scanners having a bandwidth mostly in the range of 10 to 12 μm. Later, Rosenberg et al. (1983) incorporated the term surface aerodynamic temperature (To) in the H
model, instead of Ts, considering that the temperature
gradient (for H) was a gradient between the air temperature within the canopy (at a height equal to the zero plane displacement plus the roughness length for heat transfer) and the air temperature above the canopy (at a height where wind speed was measured or height for rah). They indicated that for partially vegetated areas and water‐ stressed biomass, the radiometric and aerodynamic temperatures of the surface were not equal. Accurate estimates of H are very difficult to achieve using a direct, absolute equation for H (eq. 3) when Tsis used instead of Toand atmospheric effects and surface emissivity are not
considered properly. In such cases, H prediction errors have been reported to be around 100 Wm-2 (Chavez and Neale, 2003). Consequently, more recent Energy Balance models differ mainly in the manner in which H is estimated.
Different Surface Energy Balance Algorithms
SEBI: Menenti and Choudhury (1983) proposed SEBI(Surface Energy Balance Index) method and It is based on Crop water Stress Index (CWSI; Jackson et al 1981). In this the dry limit is assumed to have a zero surface ET (latent heat flux) for a given set of boundary layer characteristics (potential temperature, wind speed and humidity, etc.). So the sensible heat flux is then equal to the surface available energy, with the Ts,max(maximum surface
temperature)inverted from the bulk transfer equation being expressed as ( Ven Den Hurk 2001).
= Tpbl+ ra,max (4)
Tpbl Average planetary boundary layer temperature in K. ra,max Maximum aerodynamic resistance to sensible heat transfer s/m.
The minimum surface temperature can be
evaluated from the wet limit, where surface is regarded as to evaporate potentially and the potential ET is calculated from Penman-montieth equation with a zero internal- resistance. The Ts,min is expressed as
= Tpbl+
( )
(5)
ra,min is minimum aerodynamic resistance s/m and VPD
vapour pressure difference.∆ is Slope of saturated vapor pressure as a function of Ta kPa/°C.ϒ is Psychrometric constant kPa/°C . The relative evaporative fraction can then be calculated by interpolating the observed surface temperature with the maximum and minimum surface temperature in the following form(Van and Durk,2001).
=
( ) ( )
( ) ( ) (6)
LE Latent heat flux density W/m2 and LEp Potential ET W/m2 .The second part of the right hand side of the equation (6) is so called SEBI, which varies between 0(actual = potential ET) and 1(no ET).
International Journal of Emerging Technology and Advanced Engineering
Website: www.ijetae.com (ISSN 2250-2459,ISO 9001:2008 Certified Journal, Volume 3, Issue 7, July 2013)
[image:4.612.116.497.143.399.2]585
Figure 2. Theoretically schematic relationship between surface temperature and albedo in the S-SEBI ( Zhao-Liang Li,2009)
In S-SEBI, the evaporative fraction(EF) is bounded by the dry and wet limits and formulated by interpolating the reflectance (albedo) dependent surface temperature between the reflectance (albedo) dependent maximum surface temperature and the reflectance (albedo) dependent minimum surface temperature, which can be expressed as
EF =
(7)
Where Ts,max corresponds to the minimum latent heat flux (LEdry = 0) and maximum sensible heat flux (Hdry =
Rn-G) [the upper decreasing envelope when Ts is plotted against surface reflectance (albedo)], Ts,min is indicative of the maximum latent heat flux (LEwet = Rn-G) and minimum sensible heat flux (Hwet = 0) (the lower increasing envelope when Ts is plotted against surface reflectance).Ts,max and Ts,min are regressed to the surface reflectance αs (albedo) :
Ts, max = amax +bmaxαs (8)
Ts, min = amin +bminαs (9)
Where amax, bmax, amin and bminare empirical coefficients
estimated from the scatter plot of Ts and αs over study
area. After calculating Ts,max and Ts,min the EF is calculated.
EF =
α (10)
The major advantages of this S-SEBI are that: 1) besides the parameters of the surface temperature and reflectance (albedo) derived from remote sensing data, no additional ground-based measurement is needed to derive the EF if the surface extremes are present in the remotely sensed imagery; 2) the extreme temperatures in the S-SEBI for the wet and dry conditions vary with changing reflectance (albedo) values, whereas other methods like SEBAL try to determine a fixed temperature for wet and dry conditions. However, it should be noted that atmospheric corrections to retrieve Ts and αs from
International Journal of Emerging Technology and Advanced Engineering
Website: www.ijetae.com (ISSN 2250-2459,ISO 9001:2008 Certified Journal, Volume 3, Issue 7, July 2013)
586
III. SEBAL AND METRIC
Bastiaanssen (1995) and Bastiaanssen et al. (1998) developed SEBAL (Surface Energy Balance algorithm for Land), to evaluate ET with minimum ground-based measurements, has been tested at both field and catchment scales under several climatic conditions in more than 30 countries worldwide, with the typical accuracy at field scale being 85% and 95% at daily and seasonal scales, respectively Bastiaanssen(2000, 2001, 2005).
One of the main considerations in SEBAL, when evaluating pixel by pixel sensible and latent heat fluxes, is to establish the linear relationships between Ts and the surface-air temperature difference dT
dT = a + b (11)
Where a and b are empirical coefficients derived from two anchor points (dry and wet points).
At the dry (hot) pixel, latent heat flux is assumed to be zero and the surface-air temperature difference at this pixel is obtained by inverting the single-source bulk aerodynamic transfer equation:
dT dry =
(12)
Where (Sensible heat flux at dry limit W/m2) is
equal to -G.
At the wet (cold) pixel, latent heat flux is assigned a value of Rn-G (or a reference ET), which means sensible heat flux under this condition is equal to zero (when reference ET is applied, both H and dT at this pixel will not equal zero any more). Obviously, the surface-air temperature difference at this point is also zero (dTwet = 0). After calculating surface-air temperature differences at both dry (hot) and wet (cold) points, coefficients a and b in Equation (11) can be obtained. Providing that a and b are known, the surface-air temperature difference dT at each pixel over the study area is estimated with Ts using Equation (11).
Finally, H can be obtained iteratively with corrected for stability using Equation (7). This procedure requires wind speed measured at ground to be extrapolated to a blending height of about 100 to 200 m where wind speed at this level is assumed to not be affected by surface variations.
One of the assumptions made in the SEBAL model is that full hydrological contrast (i.e., wet and dry pixels) is presented in the area of interest.
The most key aspect in the SEBAL is to identify the dry pixels while wet pixels are often determined over a relatively large calm water surface or at a location of well-watered areas. The advantages of the SEBAL over previous approaches to estimate land surface fluxes from thermal remote sensing data are: 1) it requires minimum auxiliary ground-based data; 2) it does not require a strict correction of atmospheric effects on surface temperature due to its automatic internal calibration, and 3) internal calibration can be done within each analyzed image.
However, SEBAL has several drawbacks: 1) it requires subjective specifications of representative hot/dry and wet/cool pixels within the scene to determine model parameters a and b; 2) it is often applied over flat surfaces. When SEBAL is applied over mountainous areas, adjustments based on a digital elevation model need to be made to Ts and u to account for the lapse rate; 3) errors in surface temperatures or surface-air temperature differences have great impacts on H estimate; 4) radiometer viewing angle effects, which can cause variation in Ts of several degrees for some scenes, have not been taken into account.
To avoid the limitations of the SEBAL in mapping regional ET over more complicated surfaces, Allen et al.
(2005, 2007) highlighted a similar SEBAL-based approach, named METRIC (Mapping Evapotranspiration at high Resolution and with Internalized Calibration) to derive ET from remotely sensed data in the visible, near-infrared and thermal infrared spectral regions along with ground-based wind speed and near surface dew point temperature. In METRIC, an automatic internal calibration method similar to SEBAL (linearly relating Ts to the surface-air temperature difference) is used to calculate the sensible and latent heat fluxes.
Gowda et al. (2008) have evaluated the performance of the METRIC model in the Texas High Plains using Landsat 5 TM data acquired on two different days in 2005 by comparison of resultant daily ET with measured values derived from soil moisture budget. Santos et al. (2008) have found that combining a water balance model with ET estimated from METRIC model could provide significant improvements in the irrigation schedules in Spain. Tasumi
International Journal of Emerging Technology and Advanced Engineering
Website: www.ijetae.com (ISSN 2250-2459,ISO 9001:2008 Certified Journal, Volume 3, Issue 7, July 2013)
587
Main distinctions between METRIC and SEBAL are: 1) METRIC does not assume Hwet = 0 or LEwet = Rn-G at the wet pixel, instead a daily surface soil water balance is run to confirm that for the hot pixel, ET is equal to zero, and for the wet pixel, ET is set to 1.05 ETr (Reference ET over the standardized 0.5 m tall alfalfa in mm/h), where ETr is the hourly (or shorter time interval) tall reference (like alfalfa) ET calculated using the standardized ASCE Penman- Monteith equation; 2) wet pixels in METRIC are selected in an agricultural setting where the cold pixels should have biophysical characteristics similar to the reference crop (alfalfa); 3) the interpolation (extrapolation) of instantaneous ET to daily value is based on the alfalfa ETrF (defined as the ratio of instantaneous ET to the reference ETr that is computed from meteorological station data at satellite overpass time) instead of the actual evaporative fraction, which can better account for the impacts of advection and changing wind and humidity conditions during the day.
IV. RESULTS AND DISCUSSION
After reviewing all the algorithms it is found that every algorithm has its own advantages and disadvantages but they are important tools for estimating evapotranspiartion on regional basis like in S- SEBI algorithm besides the parameters of the surface temperature and reflectance (albedo) derived from remote sensing data no additional ground-based measurement is needed to derive the EF if the surface extremes are present in the remotely sensed imagery; 2) the extreme temperatures in the S-SEBI for the wet and dry conditions vary with changing reflectance (albedo) values, whereas other methods like SEBAL try to determine a fixed temperature for wet and dry conditions. The advantages of the SEBAL over previous approaches to estimate land surface fluxes from thermal remote sensing data are: 1) it requires minimum auxiliary ground-based data; 2) it does not require a strict correction of atmospheric effects on surface temperature due to its automatic internal calibration, and 3) internal calibration can be done within each analyzed image. This algorithm has been tested at both field and catchment scales under several climatic conditions in more than 30 countries worldwide, with the typical accuracy at field scale being 85% and 95% at daily and seasonal scales, respectively Bastiaanssen(2000, 2001, 2005). When SEBAL is applied over mountainous areas, adjustments based on a digital elevation model need to be made to Ts and u to account for the lapse rate. To overcome this limitation METRIC model is developed.
It is found that SEBAL/METRIC models had high potential for successful ET estimates in the semi-arid US by comparing the derived ET with lysimeter measured values(Tasumi et al. 2009). This will be also a promising tool for computing ET in Indian conditions.
V. CONCLUSIONS
Land surface energy balance (EB) models, using remote sensing data from ground, airborne, or satellite platforms at different spatial resolutions, have been found to be promising for mapping daily and seasonal ET at a regional scale. In this article, a brief review of numerous remote sensing based models was made to assess the current status of research, the underlying principle for each method, their data requirements, and their strengths and weaknesses. Reliable regional ET estimates are essential to improve spatial crop water management. The spatial and temporal remote sensing data from the existing set of earth observing satellite sensors are not sufficient enough to use their ET products for irrigation scheduling. This will be constrained further by the possible disappearance of thermal sensors on future Landsat satellites. However, research opportunities exist to improve the spatial and temporal resolution of ET by developing data fusion/ subpixel extraction algorithms to improve spatial resolution of surface temperature data derived from Landsat/ASTER/ MODIS thermal images using same/other sensor high resolution visible, NIR, and SWIR images.
REFERENCES
[1 ] Allen, R.G.; Morse A.; Tasumi, M.; Bastiaanssen, W.; Kramber, W.; Anderson, H.Evapotranspiration from Landsat (SEBAL) for water rights managementand compliance withmulti-state water compacts. IGARSS. 2001, 2, 830-833.
[2 ] Allen, R.G.; Pereira, L.S.; Raes, D.; Smith, M. (1998). Crop Evapotranspiration—Guidelines for Computing Crop Water Requirements. FAO Irrigation and drainage paper 56. Rome, Italy: Food and Agriculture Organization of the United Nations
[3 ] Allen, R.G.; Tasumi, M.; Morse, A. Satellite-based evapotranspiration by METRIC and Landsat for western states water management. Presented at the US Bureau of Reclamation Evapotranspiration Workshop, Ft. Collins, CO, USA, Feb. 2005. [4 ] Allen, R. G., M. Tasumi, and R. Trezza. 2007a. Satellite‐based
energy balance for mapping evapotranspiration with internalized calibration (METRIC): Model. ASCE J. Irrig. Drain. Eng.133(4): 380‐394.
[5 ] Allen, R. G., M. Tasumi, and R. Trezza. 2007b. Satellite‐based energy balance for mapping evapotranspiration with internalized calibration (METRIC): Applications. ASCE J. Irrig. Drain. Eng.133(4): 395‐406.
International Journal of Emerging Technology and Advanced Engineering
Website: www.ijetae.com (ISSN 2250-2459,ISO 9001:2008 Certified Journal, Volume 3, Issue 7, July 2013)
588
[7 ] Bastiaanssen, W.G.M.; Noordman, E.J.M.; Pelgrum, H.; Davids, G.;Thoreson, B.P.; Allen, R.G.SEBAL model with remotely sensed data to improve water-resources management under actual field conditions. ASCE J. Irrig. Drain. E. 2005, 131, 85-93.
[8 ] Bastiaanssen, W.G.M.; Pelgrum, H.; Wang, J.; Ma, Y.; Moreno, J.F.; Roerink, G.J.; van der, W.T. A Surface Energy Balance Algorithm for Land (SEBAL ): Part 2 validation. J. Hydrol. 1998, 212-213, 213-229.
[9 ] Brutsaert, W. Catchment-scale evaporation and the atmospheric boundary layer. Water Resour. Res. 1986, 22, 39-45.
[10 ]Brutsaert, W. Aspect of bulk atmospheric boundary layer similarity under free-convective conditions. Rev Geophys. 1999, 37, 439-451. [11 ]Brown, K. W. 1974. Calculations of evapotranspiration from crop
surface temperature. Agric. Meteorol. 14: 199‐209.
[12 ]Brown, K.W.; Rosenberg, N.J. A resistance model to predict evapotranspiration and its application to a sugar beet field. Agron. J.
1973, 65, 199-209.
[13 ]Choudhury, B.J. Synergism of multi-spectral satellite observations for estimating regional land surface evaporation. Remote Sens. Environ. 1994, 49, 264-274.
[14 ]Courault, D.; Seguin, B.; Olioso, A. Review to estimate evapotranspiration from remote sensing data: some examples from the simplified relationship to the use of mesoscale atmospheric models. In ICID workshop on remote sensing of ET for large regions, Montpellier, France, Sept. 2003; pp. 1-17.
[15 ]Carlson, T.N.; Buffum, M.J. On estimating daily evapotranspiration from remote surface temperature measurements. Remote Sens. Environ. 1989, 29, 197-207.
[16 ]Chavez, J. L., and C. M. U. Neale. 2003. Validating airborne multispectral remotely sensed heat fluxes with ground energy balance tower and heat flux source area (footprint) functions. ASAE Paper No. 033128. St. Joseph, Mich.: ASAE.
[17 ]Elhaddad, A. and Garcia, L. (2011). ‖ReSET-Raster: Surface Energy Balance Model for Calculating Evapotranspiration Using a Raster Approach.‖ J. Irrig. Drain Eng., 137(4), 203–210.
[18 ]Gowda, P.H.; Chavez, J.L.; Colaizzi, P.D.; Evett, S.R.; Howell, T.A.; Tolk, J.A. ET mapping for agricultural water management: present status and challenges. Irrig. Sci. 2008, 26, 223-237. [19 ]Jackson, R.D.; Reginato, R.J.; Idso, S.B. Wheat canopy temperature:
a practical tool for evaluating water requirements. Water Resour. Res. 1977, 13, 651-656.
[20 ]Jackson, R.D.; Idso, S.B.; Reginato, R.J.; Pinter, P.J. Canopy temperature as a crop water stress indicator. Water Resour. Res.
1981, 17, 1133-1138.
[21 ]Jackson, R.D. Evaluating evapotranspiration at local and regional scales. Proc. IEEE. 1985, 73, 1086-1096.
[22 ] Jiang, L.; Islam, S. An intercomparison of regional latent heat flux estimation using remote sensing data. Int. J. Remote Sens. 2003, 24, 2221-2236.
[23 ]Kustas, W.P.; Perry, E.M.; Doraiswamy, P.C.; Moran, M.S. Using satellite remote sensing to extrapolate evapotranspiration estimates in time and space over a semiarid rangeland basin. Remote Sens. Environ. 1994, 49, 275-286.
[24 ]Kustas, W.P.; Norman, J.M. Use of remote sensing for evapotranspiration monitoring over land surfaces. Hydrol. Sci. J.
1996, 41, 495-516.
[25 ]Kustas, W.P.; Norman, J.M. A two-source approach for estimating turbulent fluxes using multiple angle thermal infrared observations. Water Resour. Res. 1997, 33, 1495-1508.
[26 ]Kustas, W.P.; Norman, J.M. A two-source energy balance approach using directional radiometric temperature observations for sparse canopy covered surfaces. Agron. J. 2000, 92, 847-854.
[27 ]Liang, S. Quantitative Remote Sensing of Land Surfaces. Wiley-Interscience: Hoboken, NJ,USA, 2004.
[28 ]Li, F.; Lyons, T.J. Estimation of regional evapotranspiration through remote sensing. J. Appl Meteorol. 1999, 38, 1644-1654.
[29 ]Menenti, M.; Choudhury, B. Parameterization of land surface evaporation by means of location dependent potential evaporation and surface temperature range. Proceedings of IAHS conference on Land Surface Processes. IAHS Publ. 1993, 212, 561-568.
[30 ]Monteith, J.L. Principles of environmental physics, Edward Arnold Press: London, UK, 1973
[31 ]Roerink, G.J.; Su, Z.; Menenti, M. S-SEBI: a simple remote sensing algorithm to estimate the surface energy balance. Phys. Chem. Earth (B). 2000, 25, 147-157.
[32 ]Rosenberg, N. J., B. L. Blad, and S. B. Verma. 1983. Microclimate:The Biological Environment. 2nd ed. New York, N.Y.: John Wiley and Sons.
[33 ]Santos, C.; Lorite, I.J.; Tasumi, M.; Allen, R.G.; Fereres, E. Integrating satellite-based evapotranspiration with simulation models for irrigation management at the scheme level. Irrig Sci. 2008, 26, 277-288.
[34 ]Seguin, B.; Courault, D.; Guérif, M. Surface temperature and evapotranspiration: Application of local scale methods to regional scales using satellite data. Remote Sens. Environ. 1994, 49, 287- 295.
[35 ]Su Z. A Surface Energy Balance System (SEBS) for estimation of turbulent heat fluxes from point to continental scale. In: Su, Z.; Jacobs, J.(Eds.), Advanced Earth Observation—Land Surface Climate. Publications of the National Remote Sensing Board (BCRS), USP-2. 2001, 01-02, 91-108.
[36 ]Tasumi, M.; Trezza, R.; Allen, R.G.; Wright, J.L. Operational aspects of satellite-based energy balance models for irrigated crops in the semi-arid U.S. Irri. Drain. Sys. 2005, 19, 355-376.
[37 ]Teixeira, A.H.D.C.; Bastiaanssen, W.G.M.; Ahmadd, M.D.; Bos, M.G. Reviewing SEBAL input parameters for assessing evapotranspiration and water productivity for the Low-Middle São Francisco River basin, Brazil Part A: Application to the regional scale. Agric. For. Meteorol.2009, 149, 462-476.
[38 ] Van den Hurk, B. Energy balance based surface flux estimation from satellite data, and its application for surface moisture assimilation. Meteorol. Atmos. Phys. 2001, 76, 43-52.
[39 ]Wu, M.; Wang, Y.; Fang, C. & Huang, Y. (2006). An Image Information System for Management of Watersheds in Remote Sensing Education, Proceedings of IEEE Geoscience and Remote Sensing Society ( IGARSS 2006) , pp.2017-2020, Denver, CO, U. S. A., July 31 to August 4, 2006.