International Journal of Emerging Technology and Advanced Engineering
Website: www.ijetae.com (ISSN 2250-2459,ISO 9001:2008 Certified Journal, Volume 3, Issue 6, June 2013)
226
Optimization of Milling Parameters for Minimizing Surface
Roughness Using Taguchi‘s Approach
Avinash A. Thakre
Assistant Professor, Department of Mechanical Engineering, Visvesvaraya National Institute of Technology, Nagpur 440010, India.
Abstract— Present work includes understanding the effects
of various milling parameters such as spindle speed, feed rate, depth of cut and coolant flow on the surface roughness (Ra) of finished products. The experimental plan was based on Taguchi’s technique including L9 orthogonal array with four factors and three levels for each variable and studying the contribution of each factor on surface roughness. The experiments were conducted on 1040 MS material on CNC vertical milling machine using carbide inserts. The analysis of mean and variance technique is employed to study the significance of each machining parameter on the surface roughness. The results indicated that coolant flow with the contribution of 60.69% is the most important parameter in controlling the surface roughness, followed by spindle speed. The optimal parameters for surface roughness is obtained as spindle speed of 2500 rpm, feed rate of 800 mm/min, 0.8 mm depth of cut, 30 lit/min coolant flow.
Keywords- Carbide inserts, CNC vertical milling machine, L9 Orthogonal Array, Taguchi Method.
I. INTRODUCTION
For success of the manufacturing organization finding the optimum balance between higher production rate and improved quality is most important. Productivity can be interpreted in terms of material removal rate in the machining processes and quality represents product characteristics as desired by the customers which will give competitative edge over the competitors. Both these criterions are conflicting but important for the success of the organization. Quality can be expressed in terms of different attributes such as higher dimensional accuracy, form stability, surface smoothness and fulfillment of functional requirements for specific applications etc. Thus improvement in the quality of a product ensures its demand from the costumer thus helping the organization for achieving the higher revenue.
Literature [1-9] indicated different researchers tried to optimize various machining processes for improving the quality of the product. Among different quality attributes surface finish of the component obtained after various machining processes is considered to be most important.
Surface milling is widely used in most of the manufacturing industries due to its capability of producing complex geometric surfaces with reasonable accuracy and surface finish. However, with the inventions of CNC milling machine, the flexibility has been adopted along with versatility in surface milling process. Cutting parameters as spindle speed, feed, depth of cut, type and flow of cutting fluid affects the surface finish of the product. Thus optimizing the parameters for the minimum surface roughness is important in CNC surface milling process. The Taguchi method is a powerful experimental design tool uses simple, effective, and systematic approach for deriving of the optimal machining parameters in lower time
II. LITERATURE REVIEW
Various machining processes were optimized by the researchers for improving the quality of the product G. Akhyar et al. [1] applied Taguchi optimization method to optimize cutting parameters in turning Ti-6%Al-4%V extra low interstitial with coated and uncoated cemented carbide tools under dry conditions and high cutting speeds for improved surface finish. L27 orthogonal array including four factors such as Cutting speed, feed rate, depth of cut and tool grades with three levels for each factor was used to identify the optimal combination. ANOVA is used to determine the cutting speed and tool grade to be significant factors affecting the surface finish.
International Journal of Emerging Technology and Advanced Engineering
Website: www.ijetae.com (ISSN 2250-2459,ISO 9001:2008 Certified Journal, Volume 3, Issue 6, June 2013)
227 The results showed the cutting feed as the most dominant factor and interactions cutting feed-depth of cut, and cutting feed-spindle speed the most significant.
Ghhani J. A. et al. [4] optimized cutting parameters in end milling process while machining hardened steel AISI H13 with TiN coated P10 carbide insert tool under semi-finishing and semi-finishing conditions of high speed cutting. The effect of milling parameters such as cutting speed, feed rate and depth of cut along with their interactions on the process is studied using Taguchi method of experimental design (DOE).The study indicated the suitability of Taguchi method to solve the stated problem with minimum number of trials as compared with a full factorial design. Yang L.J. et al. [5] used Taguchi‗s parameter design approach in process control of individual milling machines. The Taguchi parameter design was used in order to identify the optimum surface roughness performance with a particular combination of cutting parameters in an end-milling operation. Kopac et al. [6] designed various flank milling parameters for the optimization of the cutting forces, milled surface roughness and the material removal rate (MRR) in the machining of an Al-alloy casting plate for injection moulds. The optimal combination of milling parameters for multiple process responses was determined using Grey-Taguchi method combined the orthogonal array design of experiments with grey-relational analysis (GRA). Suresh et. al. [7] adopted a two stage approach towards optimization of surface roughness. First, experimental results were used to build mathematical models for surface roughness by RSM. Then, the second order mathematical model was taken as an objective function and was optimized using genetic algorithm (GA) to obtain the machining conditions for a desired surface finish. Mathematical model was determined to predict surface roughness of 190 BHN steel in end milling in terms of three variables depth of cut, spindle speed and feed rate by using Response Surface Methodology (RSM) by Alauddin et al. [8]. Regression model was further used to explore the effect of cutting parameters on surface roughness parameter
Ra (centre line average roughness).Oktem et al. had focused on the development of an effective methodology to determine the optimum cutting conditions leading to minimum surface roughness in milling of mould surfaces by coupling Response Surface Methodology (RSM) with a developed genetic algorithm [9].
III. METHODOLOGY
The present study includes effects of new parameter coolant flow on surface finish along with other parameters such as spindle speed, feed, depth of cut.
The solution obtained from Taguchi method was verified experimentally.
3.1 Taguchi’s Technique
Dr. Genichi Taguchi developed efficient statistical tools for the design of high quality manufacturing system to achieve rapid improvements in cost and quality by optimizing product design and manufacturing processes [10].Sullivan reported that the term ―Taguchi methods‖ (TM) refers to the parameter design, tolerance design, quality loss function, on-line quality control, design of experiments using orthogonal arrays, and methodology applied to evaluate measuring systems [11]. Quality is measured by the deviation of a functional characteristic from its target value. Noises (uncontrolled variables) can cause such deviations resulting in loss of quality. Taguchi methods seek to remove the effect of noises [12].
Taguchi defined the quality of a product, in terms of the loss imparted by the product to the society from the time the product is shipped to the customer. Some of these losses are due to deviation of the product‘s functional characteristic from its desired target value, and these are called losses due to functional variation. The uncontrollable factors, which cause the functional characteristics of a product to deviate from their target values, are called noise factors, which can be classified as external factors (e.g. temperatures and human errors), manufacturing imperfections (e.g. unit to unit variation in product parameters) and product deterioration. The overall aim of quality engineering is to make products that are robust with respect to all noise factors [12].
Taguchi‘s methodology consists of following steps that can be grouped into three major categories of planning experiments, conducting them, and then analyzing and verifying the results.
1) Planning of experiment
a)Identify the main function, side effects, and failure modes.
b)Identify the noise factors and the testing condition for evaluating quality loss.
c)Identify the quality characteristic to be observed and the objective function to be optimized.
d)Identify the control factors and their levels.
e)Design the matrix experiment and define the data analysis procedure
2) Performing the experiment\
International Journal of Emerging Technology and Advanced Engineering
Website: www.ijetae.com (ISSN 2250-2459,ISO 9001:2008 Certified Journal, Volume 3, Issue 6, June 2013)
228
3) Analyzing and verifying the experiment results
g) Analyze the data, determine optimum levels for the control factors, and predict performance under these levels. (ANOM and ANOVA)
h) Conduct the verification experiment.
3.2 Experimental Details
Present work involves the optimization of surface roughness in the milling process which is dependent upon factors such as spindle speed, feed rate, depth of cut and use of coolant. However, factors such as tool geometry, tool wear, and chip formation or the material properties of both tool and work piece cannot be controlled easily.
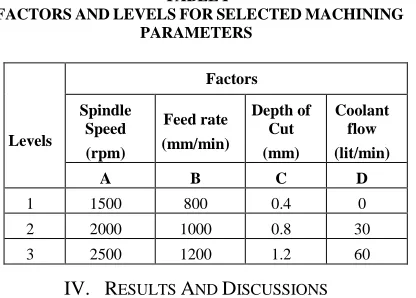
The experiments were conducted on CNC vertical milling machine, Agni, BMV45 TC24, with FANUC controller while machining AISI 1040 MS material. For designing the experiments, four factors viz. spindle speed, feed rate, depth of cut and coolant flow, and three levels of each factor were considered as shown in table 1. L9 orthogonal array was used for milling the work piece using carbide inserts at different combinations in random order. The coolant used is Blastocut 500 which includes water and coolant in 80:20 ratio be volume. The surface roughness (Ra) was measured on Surface roughness tester SV514, Mitutoyo. The optimal results were verified with the help of analysis of variance (ANOVA).
TABLEI
FACTORSANDLEVELSFORSELECTEDMACHINING PARAMETERS
IV. RESULTS AND DISCUSSIONS
[image:3.612.334.576.126.288.2]Figure 1 shows the surface roughness and waviness profile curves for few experiments.
Figure 1 Surface Roughness and Waviness Profiles
The quality characteristic for surface roughness is smaller-the-better for which equation 1 is used to calculate the signal to noise ratios (η) where yi is the value of quality characteristics at ith experiment, n is number of runs for an experiment. The experimental data for surface roughness and calculated signal-to-noise ratio for all nine combinations are shown in table 2.
(1)
TABLEII
Experimental Results of Surface Roughness and Calculated S/N Ratios
Levels
Factors
Spindle Speed (rpm)
Feed rate (mm/min)
Depth of Cut (mm)
Coolant flow (lit/min)
A B C D
1 1500 800 0.4 0
2 2000 1000 0.8 30
3 2500 1200 1.2 60
Run
Control Factors Spindle
Speed (rpm)
Feed rate (mm/min)
Depth of cut (mm)
Coolant flow (lit/min)
Surface Roughness
(µm)
S/N ratio (dB)
1 1500 800 0.4 0 2.0450 -6.2139
2 1500 1000 0.8 30 0.8053 1.8808
3 1500 1200 1.2 60 2.9128 -9.2860
4 2000 800 0.8 60 0.6866 3.2659
5 2000 1000 1.2 0 2.3710 -7.4986
6 2000 1200 0.4 30 0.4220 7.4938
7 2500 800 1.2 30 0.4398 7.1358
8 2500 1000 0.4 60 1.0468 -0.3968
9 2500 1200 0.8 0 1.2810 -2.1509 A1, B3, C3, D3
A2, B1, C2, D3
[image:3.612.70.278.434.583.2]International Journal of Emerging Technology and Advanced Engineering
Website: www.ijetae.com (ISSN 2250-2459,ISO 9001:2008 Certified Journal, Volume 3, Issue 6, June 2013)
[image:4.612.382.532.203.298.2]229 The main effect plots of S/N ratios and means for surface roughness (Ra) is plotted graphically using Minitab 15. (Figure 2 and 3). Both the figures indicate the influence of various factors on the material removal rate. The coolant flow is identified as the most significant factor controlling the surface roughness because of its larger deviation from the mean as compared to others. The second largest deviation is for spindle speed, then depth of cut and finally feed rate. But, all the factors are significant for controlling the surface roughness. From the main effect plots for the means the optimal solution for surface roughness is evident at combination of ―A3 B1 C2 D2‖. i.e. spindle speed of 2500 rpm, feed rate of 800 mm/min, 0.8 mm depth of cut, 30 lit/min coolant flow for which the surface roughness is experimentally found to be 0.357 µm lower than other combinations
Figure 2 Main Effects Plot For S/N Ratios Of Surface Roughness (Ra)
Figure 3 Main Effect S Plot For Means Of Surface Roughness (Ra)
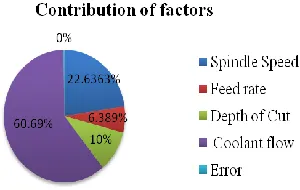
[image:4.612.50.294.314.483.2]The pie chart (Figure 4) indicates the contributions of various factors on the surface roughness. All factors have dominant effect on the surface roughness. But, it can be seen that coolant flow with the highest contribution of 60.69% is the most important parameter in controlling the surface roughness followed by the spindle speed.
Figure 4 Contributions Of Factors Affecting Roughness.
V. CONCLUSIONS
1)The optimal solution for minimizing the surface roughness value is A3 B1 C2 D2 i.e. spindle speed of 2500 rpm, feed of 800 mm/min, 0.8 mm depth of cut, 30 lit/ min coolant flow.
2)For this combination the experimentally found surface roughness value 0.357 µm is lower than other combinations.
3)Surface roughness was mainly controlled by coolant flow. Its contribution is approximately 60%. Optimal coolant flow rate ensures a better surface finish. The second most important factor was spindle speed (≈ 22%).
4)Taguchi method has been successfully applied in optimizing material removal rate and surface roughness for face-milling operation.
REFERENCES
[1] G. Akhyar, C. H. Che Haron, J. A. Ghani, 2008, Application of Taguchi Method in the Optimization of Turning Parameters for Surface Roughness, International Journal of Science Engineering and Technology, Vol.1.No.3,pp 60-66.
[2] M.Y.Noordin,V.C.Venkatesh,S.Sharif,S.Elting,A.Abdullah,2004,Ap plication of response surface methodology in describing the performance of coated carbide tools when turning AISI 1045 steel, Journal of Material Processing Technology,Vol.145, pp 46—58. [3] Mohammed T. Hayajneh, Montasser S. Tahat, Joachim
Bluhm,2007,A Study of the effects of Machining Parameters on the Surface Roughness in the End –Milling process, Jordan Journal of Mechanical and Industrial Engineering,vol.1, pp1-5.
[image:4.612.50.292.511.697.2]International Journal of Emerging Technology and Advanced Engineering
Website: www.ijetae.com (ISSN 2250-2459,ISO 9001:2008 Certified Journal, Volume 3, Issue 6, June 2013)
230 [5] Yang L. J. and Chen C.J., 2001. A systematic approach for
identifying optimum surface roughness performance in end-milling operations, Journal of Industrial Technology, Vol 17, pp.1-8. [6] Kopac J. and Krajnik P., 2007. Robust design of flank milling
parameters based on grey-Taguchi method, Journal of Material Processing Technology, Vol. 191, No. 1-3, pp. 400-403.
[7] V.S. Suresh, P. Venkateswara Rao, S. G. Deshmukh, 2002. A genetic algorithmic approach for optimization of surface roughness prediction model, International Journal of Machine Tools and Manufacture, , Vol. 42, pp. 675-680
[8] Alauddin M, Baradie M A El, Hashmi M S J 1995 Computer-aided analysis of a surface roughness model for end milling. Journal of Material Processing Technology. 55: 123–127
[9] Oktem H., Erzurumlu T. and Kurtaran H., 2005. Application of response surface methodology in the optimization of cutting conditions for surface roughness, Journal of Material Processing Technology, Vol. 170, No. 1-2, pp. 11-16.
[10] M. S. Phadke, ―Quality Engineering using Robust Design‖, P T R Prentice Hall, Englewood Cliffs, New Jersey.
[11] Sullivan L. P., ―Power of Taguchi Methods‖, Quality Progress, June p 76-79.