Electrical-Field Activated Sintering and Forming of Micro-Components
Muhammad Bin Zulkipli
Electrical-Field Activated Sintering and Forming of Micro-Components
Muhammad Bin Zulkipli
This thesis is submitted to the Department of Design, Manufacture and Engineering Management,
University of Strathclyde for the degree of Doctor of Philosophy
Dedication
iii
Acknowledgement
Abstract
v Published Research Papers and Posters
a) Research Papers:
1. Muhammad Bin Zulkipli, Yi Qin, Kunlan Huang, Hasan Hazma Hijji, Yihui Zhao and Jie Zhao (6th to 9th August 2015), “Forming of titanium and titanium alloy miniature-cylinder by electrical- field activated powder sintering and forming”. 4th International Conference on New Forming Technology (ICNFT2015) – Glasgow, Scotland, United Kingdom. (http://dx.doi.org/10.1051/matecconf/20152110006).
2. Jie Zhao, Yi Qin, Kunlan Huang, Muhammad Bin Zulkipli and Hasan Hazma Hijji (6th to 9th August 2015), “Forming of micro-components by electrical-field activated sintering”. 4th International Conference on New Forming Technology (ICNFT2015) – Glasgow, Scotland, United Kingdom. (http://dx.doi.org/10.1051/matecconf/20152110001).
3. Kunlan Huang, Yi Qin, Jie Zhao, Muhammad Bin Zulkipli and Hasan Hazma Hijji (6th to 9th August 2015), “Fabrication of NiTi shape memory alloy by Micro-FAST”. 4th International Conference on New Forming Technology (ICNFT2015) – Glasgow, Scotland, United Kingdom. (http://dx.doi.org/10.1051/matecconf/20152110003).
4. Hasan Hijji, Yi Qin, Kunlan Huang, Muhammad Bin Zulkipli, Song Yang and Jie Zhao (6th to 8th September 2016), “Forming Alumina (Al2O3) by Micro-FAST”. 14th International Conference on Manufacturing Research (ICMR2016) – Loughborough, England, United Kingdom. (http://ebooks.iospress.nl/volumearticle/44320).
b) Research Posters:
1. Muhammad Bin Zulkipli & Yi Qin (27th June 2013) “Development of a New Process for the Forming of Micro-Components”. Poster presentation. Faculty Engineering Research Presentation Day (RPD 2013) – University of Strathclyde Glasgow, Scotland, United Kingdom. (2nd Prize for Best Poster Presentation).
2. Muhammad Bin Zulkipli & Yi Qin (20th and 25th June 2014) “Development of a New Process for the Forming of Micro-Components”. Poster presentation. Department Design, Manufacture & Engineering Management Poster Critique 2014 and Faculty Engineering Research Presentation Day (RPD 2014) – University of Strathclyde Glasgow, Scotland, United Kingdom.
3. Hasan Hazma Hijji, Muhammad Bin Zulkipli & Yi Qin (31st January 2014), “Development of a New Process for the Manufacture of Micro Parts by Using a Combination of Micro Forming and Fast Technology”. Poster presentation. 8th Saudi Student Conference – Imperial College London, United Kingdom.
4. Muhammad Bin Zulkipli & Yi Qin (17th and 24th June 2015) “Development of a New Process for the Forming of Micro-Components”. Poster presentation. Department Design, Manufacture & Engineering Management Poster Critique 2015 – University of Strathclyde Glasgow, Scotland, United Kingdom.
vii Contents
Declarations of Authenticity and Author's Rights ... i
Dedication ... ii
Acknowledgement ... iii
Abstract ... iv
Published Research Papers and Posters ... v
Contents ... vii
List of Tables ... xii
List of Figures ... xviii
Chapter 1: Introduction ... 1
1.1. Research Background ... 2
1.2. Aims and Objectives ... 4
1.3. Research Methodology ... 5
1.4. Thesis Structure... 7
Chapter 2: Literature Review ... 10
2.1. Micro-Manufacturing ... 11
2.1.1. Challenges to Manufacture Micro-Products ... 13
2.1.2. Classification of Micro-Manufacturing Processes ... 14
2.1.3. Developments of Multi Processes Equipment ... 17
2.1.4. Size Effects in Micro-Forming Processes ... 18
2.2. Powder Metallurgy ... 23
2.2.1. Mixing ... 25
2.2.2. Pressing ... 25
2.2.3. Sintering ... 26
2.3. Electroplasticity ... 27
2.3.1. Research Based on Electroplasticity for Bulk Materials Forming ... 29
2.3.2.1. Titanium ... 31
2.3.2.2. Titanium Alloys ... 34
2.3.2.3. Copper ... 35
2.4. Summary of the Findings ... 37
Chapter 3: Process Concept of Electrical-Field Activated Sintering and Forming ... 40
3.1. Introduction ... 41
3.2. Comparison with Spark Plasma Sintering ... 42
3.3. Densification Mechanism ... 43
3.3.1. Stage 1: Low-Temperature Pressing ... 45
3.3.2. Stage 2: High-Temperature Pressing ... 46
3.3.3. Stage 3: Sintering with Pressing ... 48
3.3.4. Stage 4: Post-Sintering Cooling ... 49
3.4. Summary of the Chapter ... 49
Chapter 4: Die Sets Development ... 51
4.1. Introduction ... 52
4.2. Features of the Die Sets ... 53
4.3. Material Selection for Die Sets... 54
4.3.1. Thermal Expansion Coefficient of the Die and Punches Materials ... 55
4.3.2. Thermal Expansion Coefficient of the Die Sets and Sample Materials ... 56
4.3.3. Maximum Service Temperature of the Die Sets and Sample Materials ... 58
4.4. Summary of the Chapter ... 60
Chapter 5: Coupled FE Thermal-Electrical Analysis ... 61
5.1. Introduction ... 62
5.2. Theory of Coupled Thermal-Electrical Analysis ... 62
5.3. Procedure ... 64
ix
5.4.1. Die Set A ... 66
5.4.2. Die Set B ... 68
5.5. Summary of the Chapter ... 70
Chapter 6: Process Investigation with a Gleeble® 3800 Machine ... 73
6.1. Introduction ... 74
6.2. Equipment and Powder Materials ... 75
6.2.1. Gleeble® 3800 Machine ... 75
6.2.2. Relative Density Test ... 77
6.2.3. Scanning Electron Microscope (SEM)... 79
6.2.4. Surface Hardness Test ... 80
6.2.5. Powder Materials ... 82
6.3. Parameters of Experiments ... 83
6.3.1. Titanium (Ti) ... 84
6.3.2. Titanium Tin Alloy (90Ti10Sn) ... 86
6.4. Procedures of the Experiment ... 87
6.4.1. Preparation of Powder Materials ... 88
6.4.2. Preparation of Gleeble® 3800 Operating System ... 88
6.4.3. Preparation for the Ejection ... 90
6.5. Results and Discussions ... 90
6.5.1. Samples Dimensions and Weights Measurements ... 90
6.5.1.1. Titanium (Ti) ... 91
6.5.1.2. Titanium Tin Alloy (90Ti10Sn) ... 94
6.5.2. Samples Relative Density ... 97
6.5.2.1. Titanium (Ti) ... 97
6.5.2.2. Titanium Tin Alloy (90Ti10Sn) ... 103
6.5.3. Samples Microstructures... 107
6.5.3.1. Titanium (Ti) ... 107
6.5.3.2. Titanium Tin Alloy (90Ti10Sn) ... 110
6.5.4. Samples Hardness ... 113
6.5.4.2. Titanium Tin Alloy (90Ti10Sn) ... 117
6.6. Summary of the Chapter ... 119
Chapter 7: Open-Air Sintering with a Projection Welding Machine ... 121
7.1. Introduction ... 122
7.2. Tooling for Projection Welding Machine ... 124
7.3. Force Management ... 127
7.4. Heating Control ... 130
7.4.1. Sequence of the Machine Control ... 132
7.4.2. Energy Required for Heating the Die Set and the Sample Material ... 135
7.4.3. Reference Heating Temperatures ... 138
7.4.3.1. Heating Current: 2.00 kA ... 141
7.4.3.2. Heating Current: 4.00 kA ... 141
7.4.3.3. Heating Current: 6.00 kA ... 142
7.5. Procedures of Experiment ... 143
7.5.1. Preparation of Projection Welding Operating System ... 145
7.6. Results and Discussions ... 146
7.6.1. Titanium Tin Alloy (90Ti10Sn) ... 146
7.6.1.1. Cylindrical Sample 90Ti10Sn-A ... 151
7.6.1.2. Cylindrical Sample 90Ti10Sn-B ... 153
7.6.1.3. Cylindrical Sample 90Ti10Sn-C ... 155
7.6.1.4. Cylindrical Sample 90Ti10Sn-D ... 157
7.6.2. Copper (Cu) ... 159
7.6.2.1. Domed Hollow Cylinder Samples ... 161
7.6.2.1.1. Domed Hollow Cylinder Sample DHC-1... 163
7.6.2.1.2. Domed Hollow Cylinder Sample DHC-2... 165
7.6.2.2. Turbine Samples ... 167
7.6.2.2.1. Turbine Sample TR-1 ... 170
7.6.2.2.2. Turbine Sample TR-2 ... 173
xi
Chapter 8: Conclusions and Recommendations for Future Work ... 179
8.1. Conclusions ... 180
8.2. Contributions to Knowledge ... 182
8.3. Recommendations for Future Work ... 189
List of Tables
Table 2.1-1: General processes of micro-manufacturing [4], [29], [42]... 15 Table 2.1-2: Examples of hybrid micro-manufacturing processes. ... 16 Table 2.1-3: Examples of development of multi processes equipment. ... 17 Table 2.1-4: Examples of classification of feature sizes and specimen sizes on several
processes. ... 20 Table 2.1-5: Types of size effects and characteristic parameters [63]. ... 20 Table 2.2-1: Comparison of four powder processing methods of the conventional press
and sinter, metal injection moulding (MIM), hot-isostatic pressing (HIP) and powder metallurgy forging [72]. ... 24 Table 2.2-2: Common compacting pressure for various applications in powder metallurgy
process [74]. ... 25 Table 2.2-3: Common sintering temperature for some common metals [75]. ... 26 Table 2.3-1: Parameter of previous research using electroplasticity sintering process on
titanium powder. ... 33 Table 2.3-2: Parameter of previous research using electroplasticity sintering process on
titanium alloys powder. ... 34 Table 2.3-3: Parameter of previous research using electroplasticity sintering process on
copper powder. ... 36 Table 4.2-1: Comparison of the features between die set A and B for cylindrical
sample. ... 54 Table 4.3-1: Mechanical and thermal properties between graphite(C) and tungsten carbide
(WC) materials based on compressive strength, thermal expansion coefficient and maximum service temperature [134]. ... 55 Table 4.3-2: Selection combination of the die sets materials of graphite (C) and tungsten
carbide (WC) by comparing thermal expansion coefficient among the materials for the punches and body of the die. ... 56 Table 4.3-3: Selection combination of die sets materials of graphite (C) and tungsten
xiii
Table 4.3-4: Selection combination of die sets materials of graphite (C) and tungsten carbide (WC) with powder that need to be sintered which is titanium (Ti) and titanium tin alloy (90Ti10Sn) by comparing their maximum service temperature of the die sets and sintering temperature of the powder during the electrical-field activated sintering and forming process. ... 59 Table 4.3-5: Classification on the sample dimension produced, the material used, section
drawing of the die sets and pictures of the die sets used for electrical-field activated sintering and forming process. ... 59 Table 5.3-1: Physical properties of part materials used in the thermal-electrical analysis
[123], [134]. ... 65 Table 5.3-2: Global seeds used for meshing the simulation of thermal-electrical
analysis. ... 65 Table 5.4-1: Temperature data for contour of the die set A and the titanium sample as
presented in Figure 5.4-2. ... 67 Table 5.4-2: Temperature data for contour of die set B and titanium sample as presented
in Figure 5.4-4. ... 69 Table 5.5-1: Comparison of highest temperature data for die sets A and B during step one:
electrical and thermal analysis and step two: heat transfer analysis. ... 71 Table 6.2-1: General specification of the thermal system for Gleeble® 3800 machine
[123]. ... 77 Table 6.2-2: General specification of the mechanical systems for Gleeble® 3800 machine
[123]. ... 77 Table 6.2-3: The classification of the nominal chemistry and physical properties for Ti and
90Ti10Sn powder used in the electrical-field activated sintering and forming process which performed by Gleeble® 3800 machine. ... 83 Table 6.3-1: Experiment parameters for Ti powder material performed by Gleeble® 3800
machine for electrical-field activated sintering and forming process. ... 84 Table 6.3-2: List chart of heating temperature and applied pressure parameters for Ti
Table 6.3-4: List chart of heating temperature and applied pressure parameters for 90Ti10Sn samples. ... 87 Table 6.5-1: Results of the dimensions and weight measurements for Ti samples using the
die set A for the electrical -field activated sintering and forming process which performed by Gleeble® 3800 machine. ... 92 Table 6.5-2: Ti samples before and after the cleaning process of edge-burr and
carbon. ... 94 Table 6.5-3: Results of the dimensions and weight measurements for 90Ti10Sn samples
using the die set B for the electrical -field activated sintering and forming process which performed by Gleeble® 3800 machine. ... 95 Table 6.5-4: 90Ti10Sn samples before and after cleaning process of edge-burr and
carbon. ... 97 Table 6.5-5: Results of the relative densities of Ti samples using the die set A for the
electrical-field activated sintering and forming process which performed by Gleeble® 3800 machine. ... 98 Table 6.5-6: Reduction of Gleeble® 3800 stroke punches during electrical-field activated
sintering and forming process for Ti samples. ... 100 Table 6.5-7: The heating temperature and shrinkage of stroke punches of Gleeble® 3800
machine towards compaction of Ti samples as a function of time. ... 101 Table 6.5-8: Results of the relative densities of 90Ti10Sn samples using the die set B for
the electrical-field activated sintering and forming process which performed by Gleeble® 3800 machine. ... 104 Table 6.5-9: Reduction of Gleeble® 3800 stroke punches during electrical-field activated
sintering and forming process for 90Ti10Sn samples. ... 105 Table 6.5-10: The heating temperature and shrinkage of stroke punches of Gleeble® 3800
machine towards compaction of 90Ti10Sn samples as a function of time. ... 106 Table 6.5-11: Comparison of SEM micrograph at centre position Ti sample (Magnification:
1.40 k SE). ... 108 Table 6.5-12: Comparison of SEM micrograph at edge position Ti sample (Magnification:
xv
Table 6.5-13: Chemical element weight percentage of carbon (wt%) at the positions centre
and edge of Ti samples. ... 109
Table 6.5-14: Comparison of SEM micrograph at centre position 90Ti10Sn sample (Magnification: 1.40 k SE). ... 111
Table 6.5-15: Comparison of SEM micrograph at edge position 90Ti10Sn sample (Magnification: 1.40 k SE). ... 112
Table 6.5-16: Chemical element weight percentage of carbon (wt%) at the positions centre and edge of 90Ti10Sn samples. ... 112
Table 6.5-17: Micro-hardness test (HV) data for surface and inside (half of the full height sample: 2.00 mm) microstructure of Ti-4 sample. ... 114
Table 6.5-18: Average value for nano-hardness test for Ti-4 by using NanoTest Vantage hardness tester. ... 116
Table 6.5-19: Average value for nano-hardness test for 90Ti10Sn-4 by using NanoTest Vantage hardness tester. ... 118
Table 7.1-1: Technical specifications for type 100 of Projection Welding machine. ... 123
Table 7.2-1: Summary of die set holder tooling. ... 126
Table 7.2-2: Summary of Neoprene Rubber Pad. ... 127
Table 7.3-1: Percentage of differentiate force before and after installation of neoprene rubber pad at Projection Welding machine. ... 128
Table 7.4-1: Constant parameter of heating control process for 2.00 kA, 4.00 kA and 6.00 kA with the range of pulsation from one to nine pulses. ... 132
Table 7.4-2: Data for the heating temperature of the Projection Welding machine by usage of the die set B without powder material in the open-air electric-field activated sintering and forming process. ... 139
Table 7.5-1: The classification of the nominal chemistry and physical properties for 90Ti10Sn and Cu powder used in the open-air electrical-field activated sintering and forming process which performed by Projection Welding machine. ... 145
Table 7.6-2: Result of measurement, chemical element weight percentage of carbon and relative densities of 90Ti10Sn cylinder design samples for open-air electrical-field activated sintering and forming process. ... 149 Table 7.6-3: (a) SEM micrograph at the centre and edge of cylindrical sample 90Ti10Sn-A
(Magnification: 600 SE) (b) Sample 90Ti10Sn-A pictures at the top and side. ... 152 Table 7.6-4: (a) SEM micrograph at the centre and edge of cylindrical sample 90Ti10Sn-B
(Magnification: 600 SE) (b) Sample 90Ti10Sn-B pictures at the top and side. ... 154 Table 7.6-5: (a) SEM micrograph at the centre and edge of cylindrical sample 90Ti10Sn-C
(Magnification: 600 SE) (b) Sample 90Ti10Sn-C pictures at the top and side. ... 156 Table 7.6-6: (a) SEM micrograph at the centre and edge of cylindrical sample 90Ti10Sn-D
(Magnification: 600 SE) (b) Sample 90Ti10Sn-D pictures at the top and side. ... 158 Table 7.6-7: Detail parameters of the experiment for the forming of the Cu domed hollow
cylinder sample. ... 162 Table 7.6-8: Results of the experiment for the forming of the Cu domed hollow cylinder
samples. ... 162 Table 7.6-9: Detail parameters data of the highest temperature recorded based on the first
and the second weld current, the first and the second percentage of heat and the pulsations for sample DHC-1. The descriptions times of repetition for heating, force test and elevation bottom stage of the Projection Welding machine also have been described. ... 163 Table 7.6-10: Detail parameters data of the highest temperature recorded based on the first
and the second weld current, the first and the second percentage of heat and the pulsations for sample DHC-2. The descriptions times of repetition for heating, force test and elevation bottom stage of the Projection Welding machine also have been described. ... 165 Table 7.6-11: Detail parameters of experiment for the forming of the Cu turbine
xvii
Table 7.6-13: Detail parameters data of the highest temperature recorded based on the first and the second weld current, the first and the second percentage of heat and the pulsations for sample TR-1. The description times of repetition for heating, force test and elevation bottom stage of the Projection Welding machine also have been described. ... 171 Table 7.6-14: Detail parameters data of the highest temperature recorded based on the first
and the second weld current, the first and the second percentage of heat and the pulsations for sample TR-2. The description times of repetition for heating, force test and elevation bottom stage of the Projection Welding machine also have been described. ... 174 Table 8.2-1: The summary of the contributions to knowledge based on the previous
List of Figures
Figure 1.3-1: Experimental design process. ... 6
Figure 2.1-1: The revolutionary of industrial towards productions of complex parts [21], [22]. ... 11
Figure 2.1-2: Sample micro-extruded parts [24]. ... 12
Figure 2.1-3: Classification of micro-manufacturing methods and processes. ... 15
Figure 2.1-4: Hybrid production processes [43]. ... 17
Figure 2.1-5: Classification of sizes effects in micro-forming processes. ... 18
Figure 2.1-6: Illustration of microstructures (a) grain and (b) feature/specimen size effects [25]. ... 19
Figure 2.1-7: Classification of featured/specimen size effect. ... 19
Figure 2.1-8: Effect of 𝑁 on material flow stress under different testing conditions [25]. ... 21
Figure 2.1-9: Grain and specimen size effect as function on 𝑁 against the flow stress of the components [25]. ... 21
Figure 2.1-10: Surface layer model in bulk metal [12]. ... 22
Figure 2.2-1: Illustration of traditional powder metallurgy which consists of three major steps of mixing, pressing and sintering [73]. ... 24
Figure 2.2-2: Sequence of the sintering process consist of preheat or burn off, high-temperature and cooling stage. ... 27
Figure 2.2-3: Solid-state sintering based on preheat or burn off (stage one), high-temperature (stage two) and cooling (stage three) [73]. ... 27
Figure 3.1-1: Die set with powder material during the experiment using Gleeble® 3800 machine. ... 41
Figure 3.1-2: Schematic drawing of the Gleeble® 3800 machine tooling and current flows (red arrows) during the electrical-field activated sintering and forming process. ... 42
Figure 3.3-1: Illustration of stage level for electrical-field activated sintering and forming process. ... 44
xix
Figure 5.3-1: Simplified parts used in the simulation of coupled thermal-electrical analysis. ... 64 Figure 5.4-1: Heating temperature distribution of the die set A and the titanium sample for
step one: electrical and thermal analysis and step two: heat transfer analysis after the current switch off. ... 67 Figure 5.4-2: Contour of the die set A and the titanium sample for heating temperature
distribution at integration points of step one and two. ... 68 Figure 5.4-3: Heating temperature distribution of die set B and titanium sample for step
one: electrical and thermal analysis and step two: heat transfer analysis after the current switch off. ... 69 Figure 5.4-4: Contour of die set B and titanium sample for heating temperature distribution
at integration points of step one and two. ... 70 Figure 5.5-1: Comparison heating temperature of die sets A and B for electrical analysis in
step one. ... 71 Figure 5.5-2: Comparison heating temperature of die sets A and B for thermal analysis in
step two. ... 72 Figure 6.2-1: Gleeble® 3800 machine. ... 76 Figure 6.2-2: Density determination kit (Sartorius YDK03) and powder measuring scale
(Sartorious Practum). ... 79 Figure 6.2-3: Tungsten Filament Scanning Electron Microscope (W-SEM) from HITACHI S-3700 (2010)... 80 Figure 6.2-4: ZHVμ Vickers hardness tester. ... 81 Figure 6.2-5: NanoTest Vantage System. ... 81 Figure 6.4-1: Small amount of the high-temperature specimen graphite lubricant (Thred
Gard) and stickers was put at both the punches of the Gleeble® 3800 machine. ... 89 Figure 6.5-1: (a) Before experiment and (b) during experiment for the condition gap
Figure 6.5-2: Measurement of the dimension and weight of Ti samples using die set A performed by Gleeble® 3800 machine for the electrical-field activated sintering
and forming process. ... 93
Figure 6.5-3: Ti samples after the ejection process. ... 93
Figure 6.5-4: Measurement of the dimension and weight of 90Ti10Sn samples using die set B performed by Gleeble® 3800 machine for the electrical-field activated sintering and forming process. ... 96
Figure 6.5-5: 90Ti10Sn samples after the ejection process. ... 96
Figure 6.5-6: Comparison of relative density with parameters of experiment for Ti samples. ... 99
Figure 6.5-7: Comparison of relative density with parameter of experiment for 90Ti10Sn samples. ... 104
Figure 6.5-8: Comparison of chemical element weight percentage of carbon (wt%) located at centre and edge of Ti samples. ... 110
Figure 6.5-9: Comparison of chemical element weight percentage of carbon (wt%) located at centre and edge of 90Ti10Sn samples... 113
Figure 6.5-10: Position of micro-hardness indentation of Ti-4 sample by using ZHVμ Micro Vickers hardness tester. ... 114
Figure 6.5-11: Comparison micro-hardness test value (HV) for surface and inside (half of the full height sample: 2.00 mm) microstructure of Ti-4 sample. ... 115
Figure 6.5-12: Position of nano-hardness indentation of Ti-4 sample by using NanoTest Vantage hardness tester. ... 116
Figure 6.5-13: Distribution of nano-hardness and reduced Young Modulus (Er) value for Ti-4. ... 117
Figure 6.5-14: Position of nano-hardness indentation of 90Ti10Sn-4 sample by using NanoTest Vantage hardness tester. ... 118
Figure 6.5-15: Distribution of nano-hardness and reduced Young Modulus (Er) value for 90Ti10Sn-4. ... 119
Figure 7.1-1: Stock Projection Welding machine. ... 122
Figure 7.2-1: Die set holder with neoprene rubber pad. ... 124
xxi
Figure 7.2-3: Comparison between (a) stock Projection Welding machine and (b) after complete installation of the tooling for Projection Welding machine. ... 127 Figure 7.3-1: Stock Projection Welding machine measurements and name of the section
parts. ... 129 Figure 7.3-2: Graph of force measurement for Projection Welding machine before
installation of neoprene rubber pad. ... 129 Figure 7.3-3: Graph of force measurement for Projection Welding machine after installation
of neoprene rubber pad. ... 130 Figure 7.4-1: Die set with powder material during the open-air electrical-field activated
sintering and forming experiment using Projection Welding machine. ... 131 Figure 7.4-2: Schematic drawing of the Projection Welding machine tooling and current
flows (red arrows) during the open-air electrical-field activated sintering and forming process. ... 131 Figure 7.4-3: Basic sequence operation of Projection Welding machine. ... 132 Figure 7.4-4: Graph of heating temperature and time versus the pulsation process of
Projection Welding machine for current 2.00 kA. ... 141 Figure 7.4-5: Graph of heating temperature and time versus the pulsation process of
Projection Welding machine for current 4.00 kA. ... 142 Figure 7.4-6: Graph of heating temperature and time versus the pulsation process of
Projection Welding machine for current 6.00 kA. ... 143 Figure 7.6-1: Comparison of relative density of 90Ti10Sn samples with the input of weld
current and the heating temperature generated. All the others parameters are the same as presented in Table 7.6-1. ... 149 Figure 7.6-2: Heating temperature against time for densification of 90Ti10Sn samples. .. 150 Figure 7.6-3: Measurement of the dimension and weight of 90Ti10Sn samples using die set
B performed by Projection Welding machine for the open-air electrical-field activated sintering and forming process. ... 150 Figure 7.6-4: Comparison of chemical element weight percentage of carbon (wt%) located
at centre and edge of 90Ti10Sn samples by using with open-air electrical-field activated sintering and forming process. ... 151 Figure 7.6-5: Stainless steel (AISI 316 L) die set block used for the forming of the domed
Figure 7.6-6: Position of the die set block for the domed hollow cylinder and the turbine sample at Projection Welding machine. ... 160 Figure 7.6-7: Open view of the die set block and the graphite die set for the forming of the
domed hollow cylinder samples. ... 161 Figure 7.6-8: Heating temperature against time for the sample DHC-1 at 3.00 kA for first
and second weld current, 25% for first heat, 30% for second heat and nine pulsations. ... 164 Figure 7.6-9: Sample DHC-1 pictures at top and side position. ... 164 Figure 7.6-10: Heating temperature against time for the sample DHC-2 at 3.00 kA for first
and second weld current, 25% for first heat, 30% for second heat and 9 pulsations. ... 166 Figure 7.6-11: DHC-2 sample pictures at top and side position. ... 167 Figure 7.6-12: Open view of the die set for the forming of the turbine sample. ... 168 Figure 7.6-13: Cu powder filled in to the turbine die set. ... 168 Figure 7.6-14: Highest temperature with the first and the second percentage of heat for the
sample TR-1. ... 172 Figure 7.6-15: Heating temperature against time for the sample TR-1 at 3.00 kA for first and
second weld current with the pulsations of the process. ... 172 Figure 7.6-16: TR-1 sample pictures at top and side positions. ... 173 Figure 7.6-17: Heating temperature against time for the sample TR-2 at 3.00 kA for the first
1.1.Research Background
In general demands for micro-electromechanical systems (MEMS) and micro-products have significantly increased due to the fast growth that can be seen in the field of biomedicine, telecommunications and automotive engineering. For example, the global industry association Semiconductor Equipment and Materials International (SEMI) has released the sales forecast for semiconductor equipment which had a market value of $37 billion in 2015 to approximately $38 billion in 2016 and enjoys an active growth in the global market of 1.4% [1]. Besides typical MEMS manufacturing methods, significant efforts have been made recently either to scale down traditional processes or to develop the new ones for the manufacture of micro- and nano-products [2]–[5]. For instance, the production of micro-gears which are significant actuating and transmission components used widely in MEMS and micro-mechanical-systems (MMS), is often enabled through ultra-precision machining or lithographic techniques especially LIGA processes [6], [7]. Micro-forming also plays important roles for manufacturers of millions of micro screws through upsetting and rolling every year [8]–[10]. In addition to that, micro-extrusion has been well investigated where it is capable of extruding copper pins in the laboratory with a shaft diameter of 0.5 to 0.8 mm and a wall thickness of 50 to 125 μm [11],
[12]. Therefore, based on the previous research and experiment results there is no doubt that micro-products with high precision and accuracy can be produced, nevertheless concerning cycle time and cost for high production, there are still improvements to be made.
3
decreasing the workpiece dimensions this could lead to an increase of friction factor by 20 times, when performing extrusion experiments on the CuZn15 brass alloy [14].
Moreover, micro-forming needs tools with overall sizes in a range of tens of microns. Electrical discharge machining (EDM) is often used as the main process of fabricating the micro-tooling. The advantage of the micro-wire EDM process is its capability to provide excellent results for producing a micro-tooling with a high accuracy of shape and good surface quality, but the process is lacking in geometrical flexibility [15]. Other technologies for micro-tooling such as die-sinking, drilling, grinding and milling were used for making tools for stamping, embossing and coining processes [16]. Overall, micro-tooling is expensive process to be made. The development of forming technology renders challenges to micro-tooling. Besides the cost issue, tool life is one of the key factors that need to be considered. The fragile tool often needs to meet a high forming force requirement and tool wear at the micro-scale is often quicker than at the macro-scale due to the size effect issues and difficulties to fabricate the micro-components with intricate design. This was particularly the case when a high strength material was used in the micro-forming process.
sintering takes a long time to be completed. Meanwhile, by using the electrical-field activated sintering and forming process, the densification can be achieved more quickly, by deformation and breakage of the powder particles. It is not dependent on a spark discharge to create the heating as in the SPS process where it requires gaps for the spark to ignite, which as a result the application of pressure cannot be too high to prevent the spark from disappearing [19]. However, by using electrical-field activated sintering and forming process, the application of high pressurisation can be applied where it helps breakage and increase plastic deformation of material particles between interfaces. Based on this finding, it is essential for the particle breakage and deformation process to be present to achieve adequate and quick densification of micro-parts.
1.2.Aims and Objectives
The aims of this research were to develop the process configurations to produce micro-components with high densification from powder materials and design the die sets along with other tooling for machine setup, enabling a high-efficiency process. The concept of the process comprises combinations of electrical-field activated sintering and forming. The specific objectives of the research were:
a) Established of a fundamental understanding of the densification mechanism for electrical-field activated sintering and forming process.
b) Developed the optimum process parameters, die sets and other tooling for experiments setup with the Gleeble® 3800 (vacuum) and Projection Welding (open-air) machines.
c) Conducted experiments by using titanium (Ti) and titanium tin alloy (90Ti10Sn) powder to produce high relative density cylindrical samples with the Gleeble® 3800 and a Projection Welding machine.
5 1.3.Research Methodology
A series of fundamental studies have been undertaken which consist of process concept evolution, a design of forming tools and process configurations for the experiments to achieve the aims and objectives as stated above. It started with a comprehensive literature review in the subject areas such as micro-manufacturing, size effects in micro-forming, powder metallurgy and the electroplasticity application in the sintering process. During the literature review, key development issues were identified, and solutions for technology advances proposed in detail.
These were followed by the development of process parameter configurations, die sets and other tooling for use in a series of experiments by using Ti and 90Ti10Sn powder materials. The experiment was conducted by using a Gleeble® 3800 machine from Dynamic Systems Inc., USA with the collaboration of Imperial College London and a Projection Welding machine from British Federal, UK for the vacuum and open-air environment process respectively. Meanwhile, for the additional experiment, copper (Cu) was been selected to be tested in the open-air process environment by using the Projection Welding machine with die sets prepared by the Micro-FAST project. The coupled FE thermal-electrical analysis also has been done to show the heating characteristics of the die sets used in the experiment. The information collected from the FE simulation is useful to understand how the heating distribution occurs to the die sets employed in the experiments of the electrical-field activated sintering process.
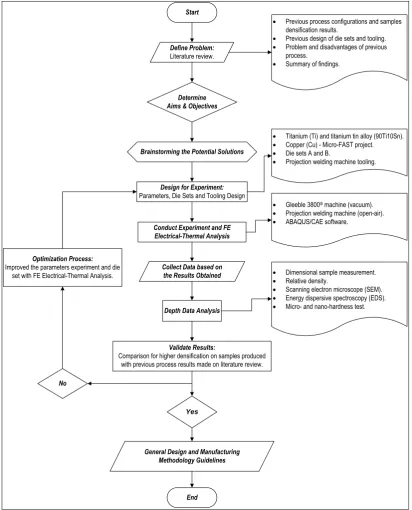
Finally, a general design and a manufacturing methodology by using electrical-field activated sintering and forming to produce micro-components from powder materials were established. Figure 1.3-1 shows the flow chart which illustrates the experiment design process and how the research was performed.
Start
Define Problem:
Literature review.
Determine Aims & Objectives
Design for Experiment:
Parameters, Die Sets and Tooling Design
Conduct Experiment and FE Electrical-Thermal Analysis
Collect Data based on the Results Obtained
Depth Data Analysis
Validate Results:
Comparison for higher densification on samples produced with previous process results made on literature review.
General Design and Manufacturing Methodology Guidelines
End Optimization Process:
Improved the parameters experiment and die set with FE Electrical-Thermal Analysis.
Yes
No
· Dimensional sample measurement.
· Relative density.
· Scanning electron microscope (SEM).
· Energy dispersive spectroscopy (EDS).
· Micro- and nano-hardness test.
Brainstorming the Potential Solutions
· Previous process configurations and samples densification results.
· Previous design of die sets and tooling.
· Problem and disadvantages of previous process.
· Summary of findings.
· Gleeble 3800® machine (vacuum).
· Projection welding machine (open-air).
· ABAQUS/CAE software.
· Titanium (Ti) and titanium tin alloy (90Ti10Sn).
· Copper (Cu) - Micro-FAST project.
· Die sets A and B.
[image:29.595.113.526.159.670.2]· Projection welding machine tooling.
7 1.4.Thesis Structure
The thesis consists of eight chapters:
a) Chapter 1: Introduction
The first chapter consists of a description of the background of the project and the aims along with the objectives which this research intended to achieve. This was followed by detailed discussion of the project methodology to be employed to complete the research. The structure of the thesis for all the development works carried out was shown in this chapter.
b) Chapter 2: Literature Review
The second chapter provides an overview of the micro-manufacturing process and an introduction of the key problem with development issues being faced today. The review then concentrates on the micro-forming process with more discussion on the size effects issues. One of the contributions of this research project was to eliminate the size effects problems in the manufacturing process by producing net shape samples which can offer a higher production rate and save the cost. The literature review then focused on an overview of the powder metallurgy (PM) process. The previous electroplasticity in the sintering process also has been done with a focus on titanium, titanium alloy and copper. The key issues were identified for improvement and as guidelines to develop the experiment parameters along with the die sets design. The chapter ends with the summary of the findings obtained from the reviews.
c) Chapter 3: Process Concept of Electrical-Field Activated Sintering and Forming
d) Chapter 4: Die Sets Development
The development works on the die sets used in the Gleeble® 3800 and Projection Welding machine have been made. The discussion on consideration of tool geometric feature design and selection of the material for the die sets has been done.
e) Chapter 5: Coupled FE Thermal-Electrical Analysis
By using ABAQUS/CAE software as a tool for coupled FE thermal-electrical analysis, the effect of heating distributions applied to the die sets during the electrical-field activated sintering and forming processes were obtained. Results and discussion from each die sets have been analysed in detail.
f) Chapter 6: Process Investigation with a Gleeble® 3800 Machine
This chapter explains the experimental study on the electrical-field activated sintering and forming process. All the information regarding the equipment, powder materials, parameters and procedures employed in the experiment and analysis has been stated. The samples obtained from the experiments were analysed and discussed in detail to provide conclusive results and findings of reliability of the overall process. Also the die sets produced excellent quality micro-components with a high process efficiency.
g) Chapter 7: Open-Air Sintering with a Projection Welding Machine
9
other samples shapes made by Cu powder that have been produced using the Micro-FAST project die sets which were named as the domed hollow cylinder and the turbine samples.
h) Chapter 8: Conclusions and Recommendations for Future Work
11 2.1.Micro-Manufacturing
The definition of manufacturing in general terms can be referred as an industrial production that has been designed for specific applications. It is a process for making an excellent output concerning quantity with the maximum possible utilisation of raw materials. The manufacturing process can produce either discrete or continuous products. Discrete product means individual parts such as a nail, gear, engine block and steel ball. Meanwhile, an example of a continuous product is like wire, hose, metal sheet, tube and pipe. The continuous product can also be cut to be served as discrete products. Changes to the manufacturing industry have emerged in the past twenty years covering the output of products, methods of production and how it was managed. It was affected not only by the increase in demand for the manufacture of common or new products but also caused by social, economic and political changes [4], [20]. Manufacturing is essential for industrial activities that contribute to economic growth of a particular country where it can be presumed that the higher the level of manufacturing activities, the better will be the population’s standard
[image:34.595.184.452.407.593.2]of living.
Figure 2.1-1: The revolutionary of industrial towards productions of complex parts [21], [22].
products has led to some challenges where the industries aim to produce new products that integrate with a variety of functions and expand the application area without increasing the weight or the overall size of the product.[23]. Hence, micro-manufacturing has focused more on processes and tool technologies used in the production of components that have at least two dimensions in sub-millimetres. The emphasis on micro-manufacturing varies from different sources where it depends on the combined function of the product and its mode of operation. Accordingly, various methods and strategies can be used to produce micro-products.
Figure 2.1-2: Sample micro-extruded parts [24].
13 2.1.1.Challenges to Manufacture Micro-Products
High volume and low-cost production are not only essential for efficient micro-manufacturing systems, but the challenges with the design of micro-products need to be taken into full consideration. The primary difficulties that relate to the manufacture of micro-products are negligible when the work is done conventionally. Traditional macro-scale manufacturing has a limit as to how far it can be scaled down, and factors that were insignificant at the macro-scale become more important in influencing the manufacturing process for a micro-product. The example factors that are irrelevant in the conventional machining but become essential in micro-manufacturing are vibration, chip removal, tool-offset, temperature and the rigidity of the tools [28], [29]. In addition to that, some of the biggest problems encountered in the handling of micro-parts is a precise positioning [30]. An example such as electrostatic, adhesion influence, and Van Der Waals effect are the unwanted external forces involved in physical contact that need to be eliminated [31]–[35]. Another common issue to be addressed at the design stage of micro-manufacturing is the significant characteristic of volume production. It is different from prototyping in a lab scale compared to products that are manufactured in the production. The selection of the materials for manufacturing and design of the component with their features will have an influence on achievable production yield, which is mainly relevant by the capability of machinery, tools, processes and auxiliary equipment. It can be seen that the micro-process technology is time-consuming and only suitable for low yield rates and does not yet have the potential of conventional processes due to manual adjustments that need to be done in every aspect of the process [28].
sub-micron precision. Moreover, calibration precisions are more demanding for current machines [29]. In addition to that, grade tolerance and surface quality specification for micro-products are not as straightforward to obtain compared to the design of a macro-product that can usually be determined from handbooks of the processes [4]. It requires the trial and error method to get the specific data that can be employed for a particular process, tools, and materials.
The limitation on the shape of micro-products that need to be produced is also one of the difficulties faced by the manufacturer. Standard rules that applied on the shaping capability of manufacturing before this was not applicable. This phenomenon due to the size effect factor and limitation to the tool shape [12]–[14]. For example, most of the processes only dealt with 2D/2.5D compare 3D shape, because to generate 3D shapes needs significant efforts such as new processes development and expensive equipment [4]. The material capability also plays a major role in the micro-manufacturing process. It can be seen in the previous research that usually used brass, copper and aluminium as test materials due to the flexible and soft characteristics with low strength properties which made them easy to deform a under low applied force. Based on the results only a simple micro-feature was successfully created [39]–
[41]. Therefore, further development of the process in micro-manufacturing still needs to be done to produce more products that have a high strength capability with more intricate micro-feature design [28].
2.1.2.Classification of Micro-Manufacturing Processes
micro-15
[image:38.595.133.506.177.448.2] [image:38.595.106.532.520.713.2]products. Depending on what type of energy that the manufacturing processes deployed, it can be categorised into mechanical, thermal, chemical and electrical. General production processes also can be classified according to the way in which the micro-products are to be made such as subtractive, additive, deforming, joining and hybrid processes as shown in Table 2.1-1 [4], [29], [42].
Micro-Manufacturing Process
Conventional Non-Conventional Hybrid
Involves changing shape of the workpiece by using sharp cutting
tools
Utilise other forms of energy but do not use sharp cutting tools
Combine two or more process together
Type of energy deployed Type of energy deployed Type of energy deployed
Mechanical Thermal
Chemical
Electrical
Combine two or more energy
Figure 2.1-3: Classification of micro-manufacturing methods and processes.
Table 2.1-1: General processes of micro-manufacturing [4], [29], [42].
Pr
oce
ss
es
Subtractive Micro-mechanical cutting (milling, turning, grinding and polishing), EDM,
micro-ECM, laser beam machining, electro-beam machining and photo-chemical-machining.
Additive
Surface coating (CVD and PVD), direct writing (ink-jet and laser-guided), micro-casting, micro-injection moulding, sintering, photo-electro-forming, chemical deposition, polymer deposition and stereolithography.
Deforming Micro-forming (stamping, extrusion, forging, bending, deep drawing, incremental forming,
superplastic forming and hydro-forming), hot-embossing and micro/nano-imprinting.
Joining Micro-mechanical-assembly, laser-welding, resistance, laser, vacuum soldering, bonding
and glueing.
Hybrid
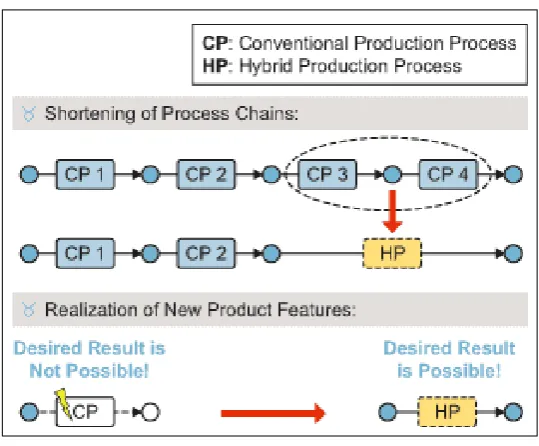
It is not usual to manufacture the micro-products with a single process. Process chains are needed to complete the micro-manufacturing processes to achieve a better quality and efficiency of the production as shown in the examples of Table 2.1-2. The hybrid micro-manufacturing can be used to achieve high efficiency, reduced micro-manufacturing errors and elimination of additional handling or transport of micro-components. This process takes the merits of the particular micro-manufacturing process while some of the inherited disadvantages may be reduced or eliminated. By using hybrid micro-manufacturing, various forms of energy may be combined and used at the same time as illustrated in Figure 2.1-4 to shorten the process chain [43].
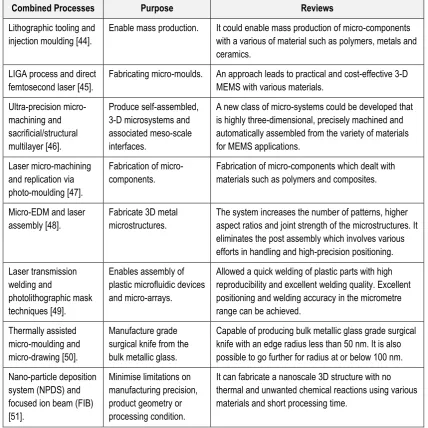
Table 2.1-2: Examples of hybrid micro-manufacturing processes.
Combined Processes Purpose Reviews
Lithographic tooling and injection moulding [44].
Enable mass production. It could enable mass production of micro-components with a various of material such as polymers, metals and ceramics.
LIGA process and direct femtosecond laser [45].
Fabricating micro-moulds. An approach leads to practical and cost-effective 3-D MEMS with various materials.
Ultra-precision micro-machining and sacrificial/structural multilayer [46].
Produce self-assembled, 3-D microsystems and associated meso-scale interfaces.
A new class of micro-systems could be developed that is highly three-dimensional, precisely machined and automatically assembled from the variety of materials for MEMS applications.
Laser micro-machining and replication via photo-moulding [47].
Fabrication of micro-components.
Fabrication of micro-components which dealt with materials such as polymers and composites.
Micro-EDM and laser assembly [48].
Fabricate 3D metal microstructures.
The system increases the number of patterns, higher aspect ratios and joint strength of the microstructures. It eliminates the post assembly which involves various efforts in handling and high-precision positioning.
Laser transmission welding and
photolithographic mask techniques [49].
Enables assembly of plastic microfluidic devices and micro-arrays.
Allowed a quick welding of plastic parts with high reproducibility and excellent welding quality. Excellent positioning and welding accuracy in the micrometre range can be achieved.
Thermally assisted micro-moulding and micro-drawing [50].
Manufacture grade surgical knife from the bulk metallic glass.
Capable of producing bulk metallic glass grade surgical knife with an edge radius less than 50 nm. It is also possible to go further for radius at or below 100 nm.
Nano-particle deposition system (NPDS) and focused ion beam (FIB) [51].
Minimise limitations on manufacturing precision, product geometry or processing condition.
17
Figure 2.1-4: Hybrid production processes [43].
2.1.3.Developments of Multi Processes Equipment
As has been described earlier, the implementation of various process chains within the integrated platforms is an ideal solution for the reduction of possible accumulation of manufacturing errors and reducing the amount of component handling. By taking advantage of the hybrid micro-manufacturing process, research and development of multi processes equipment has been done by several universities as discussed in Table 2.1-3.
Table 2.1-3: Examples of development of multi processes equipment.
Developers Developments Capable Processes
Harbin Institute of Technology, China [52].
Multifunctional micro-machining system.
Micro-electro-discharge machining (EDM), micro-electrochemical machining (ECM), micro-ultrasonic machining (USM) and as well as their combination.
Ibaraki University of Japan [53].
Multifunctional micro-machining system.
Micro-milling, turning, grinding, buffing, polishing, EDM, ECM, micro-laser machining and their combination.
National Taiwan University [54].
Multifunctional high precision table top CNC machine.
Micro-high-speed milling and micro-EDM (die-sinking and wire EDM). The system also equipped with an in-process workpiece/features geometrical measurement system.
National University of Singapore [55].
Multi-process miniature machine tools.
[image:40.595.114.527.509.713.2]Another example of an interesting concept that targeted low-cost equipment despite the fact it does not involve multiple processes can be seen in the research of five-axis milling machining. By using this machine, it is capable of machining micro-walls, micro-columns and micro-blades [56].
2.1.4.Size Effects in Micro-Forming Processes
The issues related to the size effects happen when the sizes/features are reduced from a conventional process to the micro-scale. It causes the ratio between the dimensions of the part such as width, height, length and thickness together with the microstructure of grain size to change [12]. Due to this, size effects alter almost all aspects of the forming process such as the material behaviour, heat transfer, friction and handling of the part. Therefore, methods of metal-forming technology meant for a macro-scale cannot be simply applied to micro-scale processes [25]. A few conventional forming machine designs using micro-tools that have been scaled down for micro-forming needs have been used. However, considerations incorporated with machine design have to meet the process requirements of higher quality and efficiency towards positional precision and handling of micro-parts/materials [57]–[59].
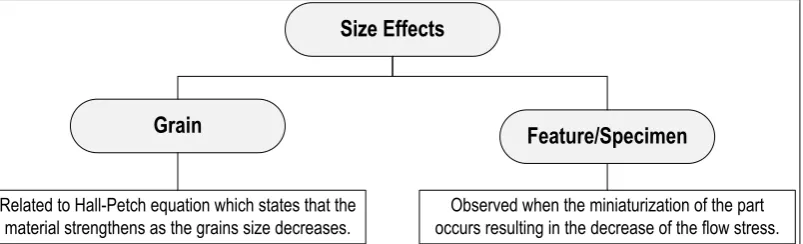
Size Effects
Grain Feature/Specimen
Related to Hall-Petch equation which states that the material strengthens as the grains size decreases.
[image:41.595.122.524.429.551.2]Observed when the miniaturization of the part occurs resulting in the decrease of the flow stress.
Figure 2.1-5: Classification of sizes effects in micro-forming processes.
19
[image:42.595.118.525.118.263.2]the decline of the flow stress [13], [25], [60]–[62]. Figure 2.1-6 shows microstructures grain and feature/specimen size effects.
Figure 2.1-6: Illustration of microstructures (a) grain and (b) feature/specimen size effects [25].
As shown in Figure 2.1-7, the feature/specimen size effect also could be divided into two distinctive effects which are feature size effect and the specimen size effect depending on the material testing methods or metal forming processes. Feature size effect can be referred to as the smallest feature on the components such as channels, radius or protrusions which will be formed. Meanwhile, specimen size effect can be referred to as the diameter of a rod or the thickness of the blank sheet to be tested. Below in Table 2.1-4 there are shown several processes used as an example to define and differentiate between feature and specimen size [25].
Feature/Specimen Size Effect
Specimen
Smallest feature such as channels, radius or protrusions on the final parts that these
specimens to be formed.
Feature
Diameter of a rod or the thickness of the blank sheet to be formed.
[image:42.595.136.501.498.641.2]Table 2.1-4: Examples of classification of feature sizes and specimen sizes on several processes.
Example Processes Feature Size Specimen Size
Extrusion process of micro-pins. Diameter of the reduced section. Initial diameter of the rod
Micro-channels formed on an initially flat thin sheet blank.
Micro-channel with their dimensions.
Thickness of the blank.
Bulge test of thin sheet blank. Bulge diameter. Thickness of the blank.
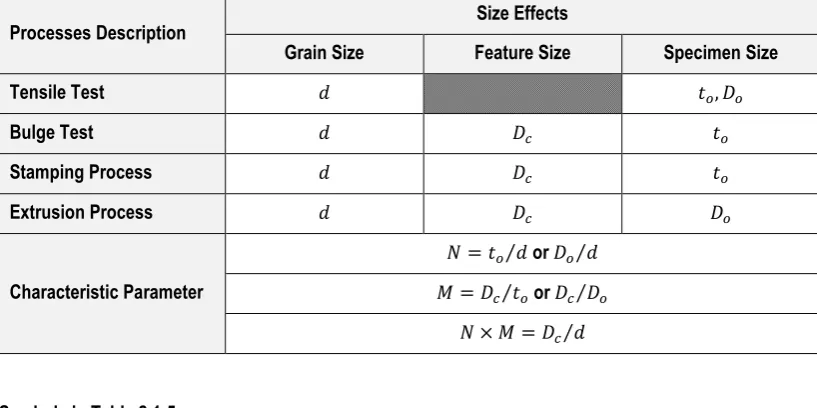
According to the Koç and Mahabunphachai [25], [63], as the grain, specimen and feature size get even smaller into micro-scales, their effects are coupled and therefore should be considered together even though these size effects have been distinguished based on the previous discussion as shown in Figure 2.1-7. They proposed the use of two characteristic parameters 𝑁 and 𝑀 to pair which represent the interactive effects. 𝑁 can be defined as the ratio between the specimen to the grain sizes. Meanwhile 𝑀 can be defined as the ratio between the feature to the specimen sizes. By defining 𝑁 and 𝑀, all combinations of the interactive effects can be represented and qualified using 𝑁 × 𝑀 (feature to grain size) as presented in Table 2.1-5.
Table 2.1-5: Types of size effects and characteristic parameters [63].
Processes Description Size Effects
Grain Size Feature Size Specimen Size
Tensile Test 𝑑 𝑡𝑜, 𝐷𝑜
Bulge Test 𝑑 𝐷𝑐 𝑡𝑜
Stamping Process 𝑑 𝐷𝑐 𝑡𝑜
Extrusion Process 𝑑 𝐷𝑐 𝐷𝑜
Characteristic Parameter
𝑁 = 𝑡𝑜⁄𝑑or𝐷𝑜⁄𝑑
𝑀 = 𝐷𝑐⁄𝑡𝑜or𝐷𝑐⁄𝐷𝑜
𝑁 × 𝑀 = 𝐷𝑐⁄𝑑
Symbols in Table 2.1-5:
𝑑 - Material grain size. 𝐷𝑐 - Die cavity.
𝑡𝑜 - Specimen thickness. 𝑁 - Ratio between the specimen and grain sizes.
[image:43.595.114.523.424.628.2]21
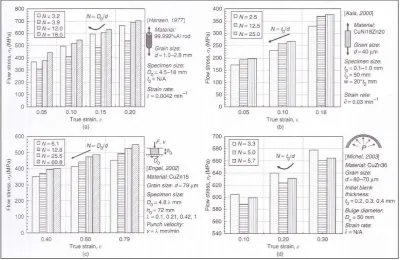
[image:44.595.119.521.224.484.2]Materials such as aluminium [64], [65], CuNi18Zn20, CuZn36 [66], CuZn15 [67] and CuAl alloy [68] were observed on the material flow curve by various testing conditions as shown in Figure 2.1-8 to measure the material response on specimen size. From all the tests that have been done, it has been demonstrated that the trend of decreasing flow stress with a declining of 𝑁 value was rather consistent. Meanwhile the grain size effect shows a strong influence on the material response at all scales until the 𝑁 value is around 10 to 15 when the specimen size effect starts to affect the material response [60], [64], [69] as shown in Figure 2.1-9.
[image:44.595.158.482.534.706.2]Figure 2.1-8: Effect of 𝑁 on material flow stress under different testing conditions [25].
However, based on the testing reported an increment in flow stress 𝑁 was decreased close to the range of five to three. As an example, Hansen [64] has conducted a tensile test of 99.999% Al rods, and the results showed an increase in flow stress as 𝑁 increased from 3.2 to 3.9 as illustrated in Figure 2.1-8 (a). Meanwhile, a hydraulic bulge testing of thin CuZn36 blanks also showed similar results, where there was an increase in flow stress as 𝑁 value increased from 3.3 to 5.0 as illustrate in Figure 2.1-8 (d) [66]. The observation of the increasing flow stress continued to occur as 𝑁 was reduced close to one (single crystal deformation) as reported in the resulting test of CuZn15 [67] and Al (99.0 to 99.5%) [65]. Figure 2.1-9 visualises the summary of the effect of 𝑁 against the flow stress of the components tested.
[image:45.595.164.476.472.708.2]23
The explanation of variations in the material flow curve due to the size effects can be explained by using a surface layer model as shown in Figure 2.1-10. The dislocation movements in the grains located at the surface are less restricted than grains inside the material. Therefore, these surface grains show less hardening [11], [12], [24], [67], [68]. By referring to Figure 2.1-10 when the diameter of the components become smaller, but the grain size is the same, the surface grain’s area becomes larger. Hence, the movements of grains located at the surface are more active compared to the inside of the material and show less hardening. As a result, the flow stress will be decreased. Meanwhile, when the size of the grain become smaller but the diameter of the components remains the same, the surface grains area become smaller. Thus, the movements of grains located at the surface are more limited compared to the inside of the material and show more hardening. As a result, the flow stress will be increased.
2.2.Powder Metallurgy
Table 2.2-1: Comparison of four powder processing methods of the conventional press and sinter, metal injection moulding (MIM), hot-isostatic pressing (HIP) and powder metallurgy forging [72].
Characteristic Conventional
Press and Sinter
Metal Injection Moulding (MIM) Hot-Isostatic Pressing (HIP) Powder Metallurgy Forging
Size of Workpiece Intermediate: <5
pounds Smallest: <1/4 pounds Largest: 1-1000 pounds Intermediate: <5 pounds
Shape Complexity Good Excellent Very good Good
Production Rate Excellent Good Poor Excellent
Production
Quantity >5000 >5000 1-1000 >10,000
Dimensional Precision Excellent: ±0.001 in./in Good: ±0.003 in./in Poor: ±0.020 in./in. Very good: ±0.0015 in/in. Density Mechanical Properties Fair: 80–90% of wrought
Very good: 90-95% of wrought
Excellent: Better than wrought
Excellent: Equal to wrought
Cost Low:
$0.50-5.00/lb Intermediate: $1.00-10.00/lb High: >$100.00/lb Intermediate: $1.00-5.00/lb
Figure 2.2-1: Illustration of traditional powder metallurgy which consists of three major steps of mixing, pressing
191 References
[1] “Semiconductor Equipment Sales Forecast: $37 Billion in 2015 and $38 Billion in
2016,” SEMI Organization, 2015. [Online]. Available:
http://www.semi.org/en/node/60181. [Accessed: 29-Sep-2016].
[2] C. K. Malek and V. Saile, “Applications of LIGA technology to precision manufacturing of high-aspect-ratio micro-components and -systems: a review,” Microelectronics J., vol. 35, no. 2, pp. 131–143, Feb. 2004.
[3] S. Y. Liang, “Mechanical machining and metrology at micro/nano scale,” in Proc. of SPIE - The International Society for Optical Engineering, Third International Symposium on Precision Mechanical Measurements, 2006, vol. 6280, pp. 628002–
628008.
[4] Y. Qin, “Overview of Micro-Manufacturing,” in Micro-Manufacturing Engineering and Technology, Elsevier Inc., 2010, pp. 1–23.
[5] Y. Qin, A. Brockett, Y. Ma, A. Razali, J. Zhao, C. Harrison, W. Pan, X. Dai, and D. Loziak, “Micro-manufacturing: research, technology outcomes and development issues,” Int. J. Adv. Manuf. Technol., vol. 47, no. 9–12, pp. 821–837, 2010.
[6] R. Ruprecht, T. Benzler, T. Hanemann, K. Müller, J. Konys, V. Piotter, G. Schanz, L. Schmidt, A. Thies, H. Wöllmer, and J. Haußelt, “Various replication techniques for manufacturing three-dimensional metal microstructures,” Microsyst. Technol., vol. 4, no. 1, pp. 28–31, 1997.
[7] S. C. H. Thian, Y. Tang, J. Y. H. Fuh, Y. S. Wong, L. Lu, and H. T. Loh, “ Micro-rapid-prototyping via multi-layered photo-lithography,” Int. J. Adv. Manuf. Technol., vol. 29, no. 9–10, pp. 1026–1032, 2006.
[8] Y. Qin, “Micro-forming and miniature manufacturing systems — development needs and perspectives,” J. Mater. Process. Technol., vol. 177, no. 1–3, pp. 8–18, Jul. 2006. [9] A. Hannewald, “Micro-screws from the rotary press,” Umformtechnik, vol. 2, pp. 28–29,
2002.
investigations into micro deep drawing,” J. Mater. Process. Technol., vol. 151, no. 1–3, pp. 70–79, Sep. 2004.
[11] U. Engel and E. Egerer, “Basic Research on Cold and Warm Forging of Microparts,”
Key Eng. Mater., vol. 233–236, pp. 449–456, 2003.
[12] M. Geiger, M. Kleiner, R. Eckstein, N. Tiesler, and U. Engel, “Microforming,” CIRP Ann. - Manuf. Technol., vol. 50, no. 2, pp. 445–462, Jan. 2001.
[13] R. W. Armstrong, “On size effects in polycrystal plasticity,” J. Mech. Phys. Solids, vol. 9, no. 3, pp. 196–199, Jul. 1961.
[14] N. Tiesler and U. Engel, “Microforming - effects of miniaturisation,” in Proceedings of 8th International Conference on Metal Forming, 2000, pp. 355–360.
[15] E. Uhlmann, G. Spur, N. A. Daus, and U. Doll, “Application of μ-EDM in the machining of micro structured forming tools,” Tech. Pap. - Soc. Manuf. Eng. AD, no. 285, pp. 1–
11, 1999.
[16] E. Uhlmann, S. Piltz, and U. Doll, “Machining of micro/miniature dies and moulds by electrical discharge machining—Recent development,” J. Mater. Process. Technol., vol. 167, no. 2–3, pp. 488–493, Aug. 2005.
[17] R. Orrù, R. Licheri, A. M. Locci, A. Cincotti, and G. Cao, “Consolidation/synthesis of materials by electric current activated/assisted sintering,” Mater. Sci. Eng. R Reports, vol. 63, no. 4–6, pp. 127–287, 2009.
[18] F. F. Lange, “Densification of powder compacts: An unfinished story,”J. Eur. Ceram. Soc., vol. 28, no. 7, pp. 1509–1516, Jan. 2008.
[19] M. Zadra, F. Casari, L. Girardini, and A. Molinari, “Spark plasma sintering of pure aluminium powder: mechanical properties and fracture analysis,”Powder Metall., vol. 50, no. 1, pp. 40–45, 2007.
[20] N. P. Mahalik, “Introduction,” in Micromanufacturing and Nanotechnology, Berlin/Heidelberg: Springer-Verlag, 2006, pp. 1–468.
193
[22] J. Jeswiet and M. Hauschild, “EcoDesign and future environmental impacts,” Mater. Des., vol. 26, no. 7, pp. 629–634, Jan. 2005.
[23] S. S. Dimov, E. B. J. P. Brousseau, R. Minev, and S. Bigot, “Micro- and nano-manufacturing: Challenges and opportunities,” J. Mech. Eng. Sci., vol. 226, pp. 3–15, 2011.
[24] U. Engel and R. Eckstein, “Microforming—from basic research to its realization,” J. Mater. Process. Technol., vol. 125–126, pp. 35–44, Sep. 2002.
[25] M. Koç and T. Özel, “Fundamentals of Micro-Manufacturing,” in Micro-Manufacturing: Design and Manufacturing of Micro-Products, John Wiley & Sons, Inc., 2011, pp. 1–23. [26] H. Ike and M. Plancak, “Coining process as a means of controlling surface
microgeometry,” J. Mater. Process. Technol., vol. 80–81, pp. 101–107, Aug. 1998. [27] Y. Saotome and H. Iwazaki, “Superplastic backward microextrusion of microparts for
micro-electro-mechanical systems,” J. Mater. Process. Technol., vol. 119, no. 1–3, pp. 307–311, Dec. 2001.
[28] A. R. Razali, “High-precision, high speed strip feeding in micro-forming,” University of Strathclyde, 2010.
[29] A. R. Razali and Y. Qin, “A review on micro-manufacturing, micro-forming and their key issues,” Procedia Eng., vol. 53, pp. 665–672, 2013.
[30] P. Rougeot, S. Regnier, and N. Chaillet, “Forces analysis for micro-manipulation,” 2005 Int. Symp. Comput. Intell. Robot. Autom., pp. 105–110, 2005.
[31] F. Arai, D. Ando, T. Fukuda, Y. Nonoda, and T. Oota, “Micro manipulation based on micro physics-strategy based onattractive force reduction and stress measurement,”
Proc. 1995 IEEE/RSJ Int. Conf. Intell. Robot. Syst. Hum. Robot Interact. Coop. Robot., vol. 2, pp. 236–241, 1995.
[32] F. Arai and T. Fukuda, “A new pick up and release method by heating for micromanipulation,” Proc. IEEE Tenth Annu. Int. Work. Micro Electro Mech. Syst. An Investig. Micro Struct. Sensors, Actuators, Mach. Robot., no. i, pp. 1–6, 1997.
![Figure 2.1-1: The revolutionary of industrial towards productions of complex parts [21], [22]](https://thumb-us.123doks.com/thumbv2/123dok_us/8758785.893489/34.595.184.452.407.593/figure-revolutionary-industrial-productions-complex-parts.webp)
![Figure 2.1-2: Sample micro-extruded parts [24].](https://thumb-us.123doks.com/thumbv2/123dok_us/8758785.893489/35.595.195.443.222.409/figure-sample-micro-extruded-parts.webp)
![Table 2.1-1 [4], [29], [42].](https://thumb-us.123doks.com/thumbv2/123dok_us/8758785.893489/38.595.133.506.177.448/table.webp)
![Figure 2.1-6: Illustration of microstructures (a) grain and (b) feature/specimen size effects [25]](https://thumb-us.123doks.com/thumbv2/123dok_us/8758785.893489/42.595.136.501.498.641/figure-illustration-microstructures-grain-feature-specimen-size-effects.webp)