ASPECTS AND PROSPECTS OF TIFFIN SERVICES: A CASE STUDY
Dr. Reeta Arora
Assistant Professor in Commerce, Govt. P.G. College for Women, Karnal, Haryana India.
Dr. Asha Chawla
Associate Professor in Commerce, G.V.M. Girls College, Sonepat, Haryana India.
Ms. Pooja Gulati
Assistant Professor in Commerce, G.V.M. Girls College, Sonepat, Haryana India.
ABSTRACT
Ever since the mid-twentieth century consumers have faced major changes in their lifestyles and consumption habits due to different cultural, social, economic and technical influences, the increasing mobility of the population and innovative products and services. In this hustle and bustle of life, people tend to compromise majorly on the kind, quality and amount of food they eat, which in turn causes a number of health issues like obesity, diabetes, hypertension, cancer, etc. Most of the time, people away from home tend to skip meals or eat any kind of fat loaded junk food that they can find easily around them. This is what made Tiffin service providers realize that there is a growing need for Tiffin services. The present study is an attempt to examine the aspects and prospects of Tiffin services by collecting information through a well-structured questionnaire from the Tiffin service users regarding different parameters like prevailing services in the markets, the satisfaction level of Tiffin service users, problems and their expectations. The study was carried out in the NCR (national capital region) of India. Such a study has been conducted for the first time in an emerging market. The research explored the important issues as nutritious value, adequate quantity, consumer requirements and advertisements to be focused by Tiffin service providers in designing policies regarding their services to ease the busy life of people and expanding their business.
INTRODUCTION
Food and health is the matter of interest for most of the people today. As a machine needs fuel to
function smoothly, similarly, food is the prime component of energy for survival. Good food not only
makes us healthier, but also changes our mood and improves our performance in our daily life. In order
to withstand the daily stress, adequate proportions of food must be consumed. Traditional food is liked
by one and all. It is not just wholesome, but also tasty and nutritious. By eating homemade food, people
become less dependent on junk food or fast food.
"Tiffin" is an Anglo-Indian word, derived from obsolete English slang "Tiffing" (to sip)for a light
lunch or afternoon snack and sometimes, by extension, for the box it is carried in. As the tiffin service
providers prepare food at home in the residential kitchen, the level of hygiene is far superior as
compared to restaurants. Tiffin services are popular as most people who work in offices prefer eating
homemade food as it is not just nutritious but also served to them hot and fresh, being cooked and
delivered within a few hours. Many students of schools, colleges and university--living in hostels and
paying guest homes also depend on Tiffin service providers. Most of the Tiffin service providers have a
wide range of dishes and preparations so individuals can choose a unique dish for each day of the week.
Many individuals rely on these Tiffin as they want to avoid eating at hotels or canteens due to hygiene
and nutritionalissues. For such people, Tiffin services are a sigh of relief. One of the main reasons why
people subscribe to these daily Tiffin services is that not only do they get good healthy and nutritious
food, but also they get it at an affordable price and this in turn greatly helps in maintaining a good physical
and mental health. The service is a win-win situation for both the parties, while the Tiffin service
providers earn handsome income; the subscribers get to enjoy good food.
Over the past few years, the Tiffin service business has attracted the attention of innumerable men and
women who are engaging in running this business to earn valuable income. Usually, the Tiffin service is a
family based business in India and the women usually takes responsibility for cooking food, whereas the men take
up the responsibility of packaging and delivering the food to the customers. The women have also been
focusing on providing better services like improved packaging and prompt delivery. For any Tiffin
service provider to be successful, it is essential that they cater to the individual needs of the consumer
and also be punctual with their delivery schedules.
RATIONALE, PRACTICAL UTILITY AND NEED OF THE STUDY:
Tiffin services have become important for those whose lives are busier. The two income households can
relocating is increasing tremendously. Some people relocate for work, while other for education. Once
one is lost in the busy life, he has little or no time to have healthy food. The ghar-ka-khana that he uses to savour is now replaced with take away, junk food or else ready to make packets. Fresh fruits are
replaced with fruit juices that have preservatives and so on. To help people maintain a balanced and
nutritious diet, there are numerous Tiffin service providers that supply meals to different parts of a city.
Many individuals rely on these Tiffinas they want to avoid eating at hotels or canteens. Tiffin service is
a developing sector, which is very well-paid and extremely in demand. On the basis of literature review it can
safely be said that there is no evidence of any comprehensive research on this phenomenon. There is not
much literature available regarding this in the Indian subject. The field remains largely unexplored and
hardly any study has been conducted on this phenomenon by using primary data. Hence, the present
study could help in giving an idea about the actual prevailing system of Tiffin services, consumers‟
perceptions and their expectations from the Tiffin service providers which can be useful for making
strategies regarding Tiffin services.
OBJECTIVES OF THE STUDY The main objectives of the study are:
To analyse the socio economic profile of the users of Tiffin services in the study area.
To study the satisfaction level of respondents on different parameters regarding Tiffin services considered in the study.
To know the perception of consumers regarding various factors while choosing Tiffin services.
To measure the respondents' degree of agreement over various issues of Tiffin services.
To compare the ranks given by respondents on the satisfaction level and importance level to different features of Tiffin services.
To identify the problems being faced by the Tiffin service users.
To find out the actions being taken by respondents in case of problems or complaints. RESEARCH METHODOLOGY
The research methodology is the way to systematically solve a problem. A research methodology
consists of various steps. The research design of the present study is the descriptive and explanatory
study. In order to accomplish the research objectives and to conduct this study the primary data source
respondents. A five-point Likert scale and ranking questions were designed to collect information from
Tiffin service users in Indian scenario.
Sampling method: Judgement and convenience sampling method was used to select the respondents for the survey.
Sample size: The sample size of the study is 80 respondents. The study was conducted from Nov, 2013 to March, 2014. The respondents were carefully selected and the study was conducted in NCR (National
Capital Region) of INDIA. Hence, it is assumed that the respondents represent the population perfectly
and the study is preliminary in nature and can be taken up for further research.
TOOLS AND TECHNIQUES
The data collected was analysed by using quantitative and qualitative techniques. The primary data
collected from respondents was analysed by using the percentage, weighted average score methods and
Spearman‟s correlation method by using SPSS Diagrams have been used for better pictorial
understanding.
LIMITATIONS OF THE STUDY:
The study is limited to the attitude and perception of the selected sample respondents, and may not be universally applicable.
The geographical area of the study was limited to NCR.
The study was conducted for the period from November 2013 to March 2014.
There might be a possibility of bias in the perception of the individuals in the survey.
The study is 'micro' in nature as the sample size is of 80 respondents. Hence it is not necessary that it truly represents the population universe.
Results, Analysis and Discussion
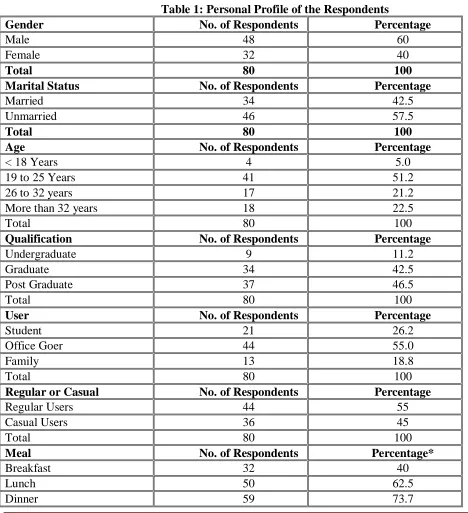
The table 1 shows that out of the total 80 respondents, 60 percent of respondents were males and the
remaining 40 percent were females. The majority of respondents (51.2 percent) belonged to age group
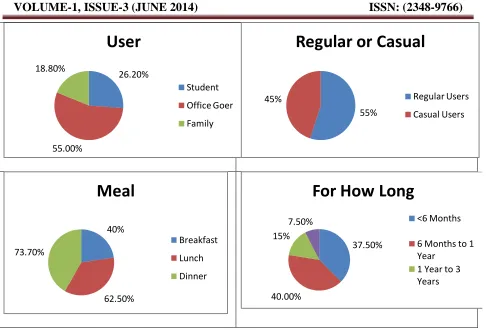
Majority of sample respondents (55%) were office goers who were using Tiffin services. It can be
inferred from the table 1 that 55 percent of respondents were regular users and 45 percent were casual
users. The majority of the users availed lunch and dinner services from Tiffin service providers.
Generally, most of the respondents were availing these services from last 1 year. It can be concluded
that the Tiffin services are generally availed by male and female office goers regularly belonging to 19
[image:5.612.67.535.208.721.2]to 25 years for their lunch and dinner for last one year.
Table 1: Personal Profile of the Respondents
Gender No. of Respondents Percentage
Male 48 60
Female 32 40
Total 80 100
Marital Status No. of Respondents Percentage
Married 34 42.5
Unmarried 46 57.5
Total 80 100
Age No. of Respondents Percentage
< 18 Years 4 5.0
19 to 25 Years 41 51.2
26 to 32 years 17 21.2
More than 32 years 18 22.5
Total 80 100
Qualification No. of Respondents Percentage
Undergraduate 9 11.2
Graduate 34 42.5
Post Graduate 37 46.5
Total 80 100
User No. of Respondents Percentage
Student 21 26.2
Office Goer 44 55.0
Family 13 18.8
Total 80 100
Regular or Casual No. of Respondents Percentage
Regular Users 44 55
Casual Users 36 45
Total 80 100
Meal No. of Respondents Percentage*
Breakfast 32 40
Lunch 50 62.5
For How Long No. of Respondents Percentage
< 6 Months 30 37.5
6 Months to 1 Year 32 40.0
1 Year to 3 Years 12 15.0
More than 3 Years 6 7.5
Total 80 100
[image:6.612.67.551.239.619.2]Source: Primary Data *Total exceeds 100% because of the multiplicity of answers.
Figure 1: DEMOGRAPHIC PROFILE OF RESPONDENTS
60% 40%
GENDER
Male Female
42.50%
57.50%
Marital Status
Married Unmarried
5.00%
51.20% 21.20%
22.50%
AGE
<18 Years
19 to 25 Years
26 to 32 Years
More than 32 Years
11.20%
42.50% 46.50%
Qualification
Undergraduate
Graduate
Table 2: Respondents Satisfaction Level towards Various Factors of Tiffin Services Factors Extremely
Satisfied
Satisfied Neither Satisfied
nor Dissatisfied
Dissatisfied Extremely
Dissatisfied
WAS RANK
1. Menu item Variety 11
(13.8)
45
(56.2)
16
(20)
8
(10)
__ 3.74 IV
2. Quantity of Food 13
(16.2)
48
(60.0)
14
(17.5)
5
(6.2)
__ 3.86 II
26.20%
55.00% 18.80%
User
Student
Office Goer
Family
55% 45%
Regular or Casual
Regular Users
Casual Users
40%
62.50% 73.70%
Meal
Breakfast
Lunch
Dinner
37.50%
40.00% 15%
7.50%
For How Long
<6 Months
6 Months to 1 Year
3. Nutritious Value 7 (8.8) 29 (36.2) 27 (33.8) 17 (21.2) 1 (1.2)
3.23 VI
4. Packaging 9
(11.2) 56 (70.0) 10 (12.5) 4 (5.0)
__ 3.85 III
5. Delivery time 14
(17.5) 53 (66.2) 4 (5.0) 9 (11.2)
__ 3.90 I
6. Price 15
(18.8) 39 (48.8) 6 (7.5) 18 (22.5) 2 (2.5)
3.58 V
Source: Primary Data Note: Figures in parenthesis indicate percentages.
Table 2 reveals that the majority of respondents were satisfied with various factors related to Tiffin
services like menu item variety (70 percent), quantity of food (76.2 percent), packaging (81.2 percent),
delivery time (83.7 percent) and price (57.7 percent). Very few respondents were dissatisfied with these
factors. As far as nutritional value of Tiffin food is concerned, 45 percent of respondents were satisfied
while 33.8 percent were neither satisfied nor dissatisfied. As far as the average consumer satisfaction is
concerned, average respondent has given the average weighted score more than 3 to each factor in case
of Tiffin services. In this way all factors have been rated in the range of „neither satisfied nor dissatisfied
to satisfied‟ regarding Tiffin services. From the satisfaction point of view, the delivery time of Tiffin had
been ranked I (being maximum average weighted scores), quantity of food II, packaging III, menu item
variety IV and price V. Nutritious value in Tiffin had got 6th rank from the satisfaction point view.
Table 3: Respondents Ranking To Various Factors of Tiffin Services
Factors RANK I RANK II RANK III RANK IV RANK V RANK VI Total Weighted Score Overall Ranking 1. Menu item Variety 11 (13.8) 14 (17.5) 25 (31.2) 17 (21.2) 6 (7.5) 7 (8.8)
3.83 II
2. Quantity of Food 8 (10.0) 19 (23.8) 11 (13.8) 16 (20.0) 14 (17.5) 12 (15.0)
3.44 IV
3. Nutritious Value 36 (45.0) 12 (15.0) 11 (13.8) 5 (6.2) 6 (7.5) 10 (12.5)
[image:8.612.46.589.67.287.2]4. Packaging 5 (6.2)
13 (16.2)
6 (7.5)
7 (8.8)
20 (24.5)
29 (36.2)
2.61 VI
5. Delivery time
6 (7.5)
8 (10.0)
8 (10.0)
22 (27.5)
26 (32.5)
10 (12.5)
3.20 V
6. Price 14 (17.5)
14 (17.5)
19 (23.8)
13 (16.2)
8 (10.0)
12 (15.0)
3.71 III
Source: Primary Data
Note: Figures in parenthesis indicate percentages.
Tiffin services are a combination of different features/factors which make services suitable or
satisfactory for the Tiffin service users. An attempt was made to check the importance level of different
factors while choosing Tiffin services. The table 2 reveals that the majority of respondents (45 percent)
considered nutritious value as very important factor in case of Tiffin services. As far as average
weighted scores are concerned, nutritious value had got rank I, menu item variety II and price, quantity
of food and delivery time had got III, IV, V ranks respectively. Packaging factor has been given VI rank
from the important point of view while choosing Tiffin services.
Table 4: Ranking of Satisfaction and Importance Level of Different Features
Factors Ranks
According to Satisfaction Level
Ranks
According to Importance level
1. Menu item variety IV II
2. Quantity of food II IV
3. Nutritious value VI I
4. Packaging III VI
5. Delivery time I V
6. Price V III
An attempt was made to find out the relationship between the ranking of different factors, according to
satisfaction level and according to importance level. Table 4 reveals that different factors relating to
Tiffin services had got different ranks as far as satisfaction level is concerned and as far as importance
level given to these factors. Statistically, Spearman rank correlation was calculated on the ranks of
different factors of Tiffin services. It is evident from the result that there exists a high degree of
negative correlation between satisfaction level and importance level. As indicated in table 4, there exists
a significant difference in ranking given to different factors at 95 percent level of importance. It can be
inferred that Tiffin service providers are not providing Tiffin services to the Tiffin users at their
expectation level. They need to keep note that to keep consumer satisfied and to gain competitive
advantage, they must cater for the needs of Tiffin service users.
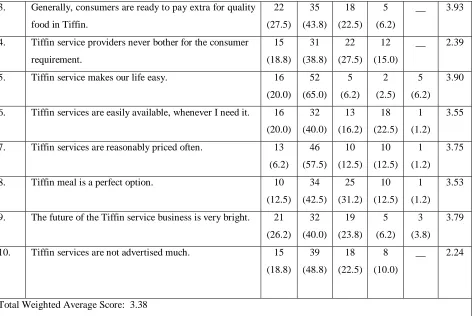
To know the views of Tiffin service users about this facility, some statements were framed for this study. Table 5
depicts that on an average respondent (average weighted score 3.52) was agreed that Tiffin meals have adequate
nutritional values and generally Tiffin users were ready to pay extra for quality food in Tiffin. The table reveals
that Tiffin services had made their life easier as Tiffin services are easily available, whenever they are in need of
Tiffin for meals. When respondents were asked to respond about Tiffin meal as a perfect option, on an average
respondent (average weighted score 3.53) was of the view that Tiffin meal is a perfect option when he is in need
of it. As far as the price factor in Tiffin services is concerned, the average weighted score (3.75) showed that the
majority of respondents was agreed that Tiffin services are reasonably priced often and Tiffin meal gives them
feel of homemade food. On the basis of the responses of the respondent's table reveals that the neglected parameters of Tiffin services which were: “Tiffin service providers never bother for consumer requirements” and “Tiffin services are not advertised much”. Results show that majority of respondents were agreed that future of
the Tiffin service business is very bright. It can be inferred that Tiffin services are the need of the hour and best
option due to busier life when people have little time or no time to have homemade healthy food.
Table 5: Satisfaction level of respondents of different issues with Tiffin services
S. No.
ISSUES SA A N DA SDA WAS
1. Tiffin meals have adequate nutritional values. 13
(16.2) 35
(43.8) 15
(18.8) 15
(18.8) 2
(2.5) 3.52
2. Tiffin meal gives you feel of homemade food. 16
(20.0) 26
(32.5) 7
(8.8) 23
(28.8) 8
(10)
3. Generally, consumers are ready to pay extra for quality
food in Tiffin.
22 (27.5) 35 (43.8) 18 (22.5) 5 (6.2)
__ 3.93
4. Tiffin service providers never bother for the consumer
requirement. 15 (18.8) 31 (38.8) 22 (27.5) 12 (15.0)
__ 2.39
5. Tiffin service makes our life easy. 16
(20.0) 52 (65.0) 5 (6.2) 2 (2.5) 5 (6.2) 3.90
6. Tiffin services are easily available, whenever I need it. 16
(20.0) 32 (40.0) 13 (16.2) 18 (22.5) 1 (1.2) 3.55
7. Tiffin services are reasonably priced often. 13
(6.2) 46 (57.5) 10 (12.5) 10 (12.5) 1 (1.2) 3.75
8. Tiffin meal is a perfect option. 10
(12.5) 34 (42.5) 25 (31.2) 10 (12.5) 1 (1.2) 3.53
9. The future of the Tiffin service business is very bright. 21
(26.2) 32 (40.0) 19 (23.8) 5 (6.2) 3 (3.8) 3.79
10. Tiffin services are not advertised much. 15
(18.8) 39 (48.8) 18 (22.5) 8 (10.0)
__ 2.24
Total Weighted Average Score: 3.38
Source: Primary Data Note: Figures in parenthesis indicate percentages.
An attempt was made to know how often a Tiffin service user has to face problems regarding Tiffin services. It
had been observed that the majority of respondents didn‟t have any problem like spill over (48.8 percent of
respondents), awful smell in the Tiffin bag (50 percent of respondents) and inadequate quantity (46.8 percent of
respondents) regarding Tiffin services. But sometimes, the majority of respondents had to face the problems of
unhygienic food and of late delivery of Tiffin. It has been noted that very few respondents had to face the
problems most of the times regarding spill over, awful smell in the bag, unhygienic food, inadequate quantity and
[image:11.612.74.546.71.387.2]late delivery of Tiffin.
Table 6: Problems regarding different aspects of Tiffin Services
Problems Most of times Sometimes Never
(7.5) (43.8) (48.8)
2. Tiffin bag smells awful 9
(11.2)
31
(38.8)
40
(50.0)
3. Unhygienic food 8
(10.0)
39
(48.8)
33
(41.2)
4. Inadequate quantity 14
(17.5)
29
(36.2)
37
(46.8)
5. Late delivery 4
(5.0)
39
(48.2)
37
(46.8)
Source: Primary data. Note: Figures in parenthesis indicate percentages.
Availed services may lead either to satisfaction or dissatisfaction. To know the reactions of respondents in case of
problems or complaints regarding Tiffin services, what would you like to do, responses were collected and
analysed. The table reveals that the majority of respondents (76.2 percent) stated that they will ask the Tiffin
service provider to take care, 47.5 percent of respondents were of the view that they will decide to change the
Tiffin service provider. Few respondents were of the view that they will decide not to take Tiffin services in the
future or forget and leave it and tell others not to take services from this service provider.
Table 7: Actions to be taken by respondents in case of problems
S. no. Actions to be taken No. of Respondents Percentage
1. Ask Tiffin service provider to take care. 61 76.2
2. Tell others not to take services from another provider. 9 11.2
3. Decide not to take Tiffin services in future. 10 12.5
4. Decide to change the Tiffin service provider. 38 47.5
5. Forget and leave it. 11 13.8
Findings
Tiffin services are generally availed by unmarried males and females office goers regularly belonging to 19 to 25 years age group for their lunch and dinner for last one year.
A majority of respondents was satisfied with the menu item variety, quantity of food, packaging, delivery time and price of Tiffin services. Nutritious value in Tiffin‟s had got 6th rank from the satisfaction point of view.
On an average, every respondent considered nutritious value of the meal in Tiffin as most important while choosing Tiffin services followed by menu item variety, quantity and delivery
time.
A large number of respondents were of the view that Tiffin service had made their life easy and gives them feel of homemade food.
Tiffin service providers never bother for consumer requirements and not advertise their services much.
A majority of respondents was of view that future of Tiffin service business is very bright.
A majority of respondents had to face problems sometimes regarding awful smell in the bag, unhygienic food, and spill over and late delivery of Tiffin.
A majority of dissatisfied respondents will ask Tiffin service providers to take care of problems or complaints if they have to face problems or complaints regarding Tiffin services.
Conclusions and Recommendations
It is quite evident from the results that Tiffin service industry is one of the emerging sectors and is
playing an important role in the present scenario. Many farsighted people are entering into this sector
understanding the needs of consumers due to their busier life. This is especially true in the case of
individuals who live far from their home otherwise they have to depend for their meals on restaurants,
dhabas or available junk foods forcefully with which they are not comfortable as resulting in bad effects
on their health. In this case, Tiffin meals are the
best options which give them a feel of homemade food. The increasing number of the double income
group in a family with their hurried lifestyles, increasing rate of relocation of people for work or study
are positive indicators
of the need of Tiffin service industry. The success of Tiffin service providers could be achieved only if
they can provide Tiffin services having more nutritional values at reasonable price and they must
evaluate the expectations and perceptions of consumers to serve them better. They must put more
efforts to advertise their services which are being neglected. It can be very fruitful for them by
providing the maximum degree of satisfaction to the Tiffin service users. Thus Tiffin service providers
scenario and should always be prepared to adapt to changing trends of lifestyles as there is ample scope
in the Tiffin service industry.
References:
1. Chawla Deepak, Sondhi Neena: Research Methodology (2011): Concepts And Cases: Vikas
Publishing House Pvt. Ltd.
2. Coakes, Sheridan J (2013). “SPSS version 20.0 for windows: Analysis without Anguish.”Australia,
John Wiley & Sons, pp. 64-65
3. Gupta.S.C. (2010), Fundamentals of Statistics, sixth revised and enlarged edition, Himalaya
Publishing House, Mumbai, India
4. Kotlar Philip (2005): Marketing Management-Analysis, Planning and Control, New Delhi: Printice
Hall.
5. NargundkarRajendra, (2012): “Marketing Research-Text And Cases”Tata McGraw Hill Education
Private Limited, New Delhi.
6. Pathak, SanjeevGauri (2010), “Delivering the Nation: The Dabbawalas of Mumbai.”Journal of South Asian
studies Vol33, No.2, pp. 235-257.
7. Saunders Mark, Lewis Philip &Thornhill Adrian, (2012): “Research Methods For Business Stundents”
Pearsons Education, South Asia.
8. Singh, H. (2007), “Concept and cases of research methodology.” Kalyani publishers, New Delhi, pp. 164-168.
9. Singh,Raghbir. (1983), “Marketing and Consumer Behavior”, New Delhi: Deep and Deep Publications.
10. Sontakki, C.N. (2010). “Marketing Management” Ludhiana, Kalyani publishers,PP.289-301.
11. Srivastava,T.N.&Rego,Shailaja (2012), “Business Research Methodology” Tata McGraw Hill Education
Private Limited , New Delhi.
12. Zeithamal, Valarie A, Bitner, Mary Jo, Gremler,Dwayne D, &Pandit,Ajay. “Services Marketing: Integrating
13.http://www.forbes.com/search, dabbawala, accessed on March 27, 2014.
14.http://www.thehindubusinessline.com/economy/dabbawalas , dabbawalas March28, 2014.