A STUDY OF THE EFFICACY OF Z SCORE MODEL TO MAKE
INVESTMENT DECISIONS
Ms. Gayatri Sanjay Pai PhD Research Scholar –
Dr. D.Y. Patil Vidyapeeth, Pimpri, Pune
Visiting faculty, Sri Balaji Society, Tathawade, Pune, Maharashtra, India
Dr. Leena B Dam
Associate Professor, Research Guide,
Dr. D. Y. Patil Vidyapeeth, Global Business School & Research Centre, Mumbai – Bangalore Highway, Pune, Maharashtra, India
ABSTRACT
A fundamentally strong company’s stock will not be affected by short-term market fluctuations or
external factors. Investment in small caps for a long-term can prove to be a very wise investment
if the company is chosen are good businesses and managed well. The paper investigates the
efficacy of Altman Z score developed in 1968 as a valuation tool to compare different company’s
performance for making stock market investment decisions. The study analyzed 53
manufacturing companies forming part of the Nifty Free Float Small cap index for over a period
of 2011 to 2017. The results showed that Altman Z score classified 10 companies as high-risk
companies, 15 companies as distressed companies and 28 companies as safe companies for
investment purpose. The study also analyzed the sector wise performance of the index and
studied the relationship of the same with the financial performance of individual companies. The
study found that Z score can serve as an indicator of the financial performance of the company.
The analyses also revealed that performance of the sector need not reflect the performance of International Research Journal of Management and Commerce
ISSN: (2348-9766) Impact Factor- 5.564, Volume 5, Issue 3, March 2018 Website- www.aarf.asia, Email : [email protected] , [email protected]
individual companies. The study offers evidence that the Z score model is a practical and useful
tool for selecting stocks.
1. Introduction
‘A Stock is not just ticker symbol or an electronic blip; it is an ownership interest in an actual business with an underlying value that does not depend on its share price’ Benjamin Graham. Every investor wants to source investment worthy companies. But analyzing and reading realms of data through the annual report gives the perception that investing in stocks complicated. Picking stock to invest involves serious background research about the company along with other factors. To get multiple returns on investment in stock, the investment should be for long term. This requires the confidence that the stock will grow and give good returns in the future.
Primarily ratios have been used to evaluate the health of a business. Most of the financial models have been developed to predict the financial distress and bankruptcy of companies.
The paper attempted to study the use of Altman’s Z score (1968),a popular bankruptcy prediction model which was developed for manufacturing firms.
Mauritius, (2010) using data of companies listed on AEX and AMX stock indices employed the Altman Z score to test their financial health to assist investors in decision making. The findings showed that investors wanting to invest in shares for a long-term and get a high consistent return on their investment should prefer companies with a high Z score. The research brought out the possibility that the bankruptcy prediction model could also be used to test the financial soundness of the company before investing in them.
Key words: Investment decisions, Altman Z score, Nifty Free Float Small cap 100 Index
2. Literature review
Altman’ Z score model has been extensively researched all over the world for its bankruptcy prediction power. A few attempts have been made to use it for investment purpose.
Sulphey and Nisa (2013) analyzed the financial health and solvency of 220 Companies listed in BSE small cap index using Altman Z score belonging to 21 different sectors.
They aimed to identify the change in time series data correspond to Z score for each companies. Thus concluding that Altman Z score could be used to measure credit worthiness of companies. Lalith P. Samarakoon and Tanweer Hasan (2003)investigated the ability of three versions of Altman’s Z-Score model to predict the corporate distress in Sri Lanka. The results showed that these models had a great degree of accuracy in predicting distress using financial ratios sourced from financial statements in the year prior to distress.
Maina et al (2017) in their paper aimed to measure the financial distress status of companies listed in Nairobi stock exchange by applying Altman Z score on a sample of 30 firms divided into different sectors for the period from 2003 to 2007. The findings showed that that the financial position of the listed firms differs on the basis of sector and the financial health of listed firms in the same sector differs from one company to the other
3. Objectives of the study:
The study aimed at exploring the following objectives through the research paper:
1. To study the performance of individual companies vis-à-vis the sector performance 2. To analyze the year wise performance of companies forming part of Nifty Free Float
Small cap 100
3. To test the efficacy of Altman’s Z score for investors for investment decisions. 4. Hypothesis:
The paper addressed the following four hypothesis:
H 1: The financial performance of individual companies conforms to the overall performance of the sector
H 2: Nifty Free Float Small cap listed companies show a growing trend
H 3: Altman Z score is a viable tool for investment decisions
5. Research Methodology:
i. The Model and its variables:
Z = .012X1 + .014X2 + .033X3 + .006X4 + .999X5 The variables used for the Z score are the following ratios: • X1 - working capital to total assets ratio
• X2 - retained earnings to total assets ratio
• X3 - earnings before interest and taxes to total assets ratio • X4 - market value of equity to book value of total debt ratio • X5 - sales to total assets ratio
The study calculated the Z score for all the companies in the dataset for each of the years to assess their financial position. Average Z score for each company was also calculated. Each sector’s performance was analyzed with the help of these calculations
ii. Data and Sample Construction
The Nifty Free Float Small cap 100 Index comprises 100 tradable stocks listed at the National Stock Exchange, (NSE).Out of the total 100 stocks, 53 eligible companies forming part of the manufacturing sector formed the sample for the study. Balance sheet and income statements for the seven year period from 2011 to 2017 were retrieved from the CMIE Prowess database into Excel spreadsheets.
The remaining 47 companies excluded, were companies which were not listed for any of the years and had incomplete data for the period from 2011 to 2017 or were non-manufacturing firms.
The manufacturing sector is very well represented by the 53 companies taken for the research. Exception being the following sectors:
IT sector -Except Zensar technologies (which is a hardware manufacturing firm) the rest companies were software service providers and therefore excluded from the sample.
Auto mobile sector (only two companies represent the sector on the index)
Endurance technologies did not have market capitalization information available for years before 2017. Thus only JK Tyres and Industries Limited represented the sector in the study.
Cement and cement products and Paper sectors have only two and one company representing them on the index respectively.
6. Result & discussion
H1: The financial performance of individual companies conforms to the overall performance of the sector
Table: 3 Sector wise performance
The above graph provides an overview of all the sectors depicting their financial performance over the period of 2011 to 2017. The Z scores were arrived at, for each sector and for the respective years by calculating the average of Z score of all the companies representing that sector on the Nifty Free Float Small cap 100 index. Each sector has a different Z score for the study period.
The weakest sectors as expressed by their Z scores are Paper, Construction, Automobile, Cement & cement products and Chemicals.
The chemical sector represented on the index is shown declining towards distress. Of the two companies, BASF India Ltd has very low average Z score of 0.69 for the time period under the study. While Deepak Fertilizers and Petrochemicals Corporation Limited showed a healthy status throughout.
0 5 10 15 20 25 30
2010 2011 2012 2013 2014 2015 2016 2017 2018
AL
T
M
AN
Z
S
CORE
Sectorwise performance
AUTOMOBILECEMENT & CEMENT PRODUCTS
CHEMICALS
CONSTRUCTION
CONSUMER GOODS
ENERGY
FERTILISERS & PESTICIDES
INDUSTRIAL MANUFACTURING METALS
PAPER
PHARMA
TEXTILES
TELECOM
Cement and cement products sector is featured in the grey area.
Construction sector clearly shows distressed status. Almost all companies show default status barring Ashoka Buildcon Ltd which is showing an increasing trend in its performance.
The Paper sector features at the bottom of the graph with an average of 1.24 as it is represented by only one company i.e. Tamil Nadu Newsprint and Papers Limited whose performance is in default state all over the study period.
The Automobile sector represented by only JK Tyres and Industries and the IT sector was represented by only Zensar Technologies showed improvement over the years, thereby putting the sectors in a healthy zone.
The sectors which are strongest as indicated by their Z scores are Pharma, IT, Consumer goods, Fertilizers and pesticides, Metals, Industrial manufacturing, Energy and Textiles.
Textiles sector showed consistent improvement from 2011 to 2017 as represented by the financial performance of all the companies.
Consumer Goods sector improved over the years with Z score of 4.94 in 2011 to 8.6 into 2017. All the companies show a growing trend and healthy financial performance except for Bajaj Hindustan Sugar Ltd and McLeod Russel India Ltd.
Pharma sector’s average Z score was inflated with the performance of Sun Pharma Advanced Research Company Limited. Suven Life Sciences Ltd has shown an increasing trend while AstraZeneca Pharma India showed a decline in its financial performance. FDC remained at a consistent high while Granules India Ltd showed consistent moderate performance.
Industrial manufacturing sector shows a slight above average performance with all the companies having an average Z score of 3 to 4, except for Greaves Cotton Ltd. and GE Power Ltd.’s performance classified as default by Altman Z score.
Metal sector has an average high Z score but is showing a declining trend over the years. All the companies show a similar trend. Except for Welspun Corp Ltd which has now progressed into insolvent stage with an average of 1.7 for its Z score.
Fertilizers and pesticides sector and Telecom sector are improving in their health consistently..
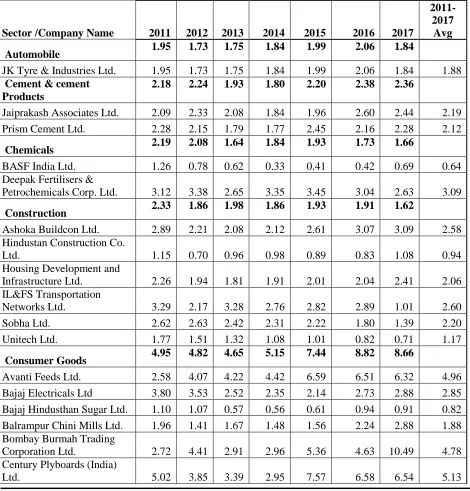
[image:7.612.70.540.205.696.2]H 2: Nifty free float Small cap hundred listed companies show a growing trend Table 2: Z scores of companies from 2011 to 2017
Sector /Company Name 2011 2012 2013 2014 2015 2016 2017
2011-2017 Avg
Automobile 1.95 1.73 1.75 1.84 1.99 2.06 1.84
JK Tyre & Industries Ltd. 1.95 1.73 1.75 1.84 1.99 2.06 1.84 1.88 Cement & cement
Products
2.18 2.24 1.93 1.80 2.20 2.38 2.36
Jaiprakash Associates Ltd. 2.09 2.33 2.08 1.84 1.96 2.60 2.44 2.19 Prism Cement Ltd. 2.28 2.15 1.79 1.77 2.45 2.16 2.28 2.12
Chemicals 2.19 2.08 1.64 1.84 1.93 1.73 1.66
BASF India Ltd. 1.26 0.78 0.62 0.33 0.41 0.42 0.69 0.64 Deepak Fertilisers &
Petrochemicals Corp. Ltd. 3.12 3.38 2.65 3.35 3.45 3.04 2.63 3.09
Construction 2.33 1.86 1.98 1.86 1.93 1.91 1.62
Ashoka Buildcon Ltd. 2.89 2.21 2.08 2.12 2.61 3.07 3.09 2.58 Hindustan Construction Co.
Ltd. 1.15 0.70 0.96 0.98 0.89 0.83 1.08 0.94
Housing Development and
Infrastructure Ltd. 2.26 1.94 1.81 1.91 2.01 2.04 2.41 2.06 IL&FS Transportation
Networks Ltd. 3.29 2.17 3.28 2.76 2.82 2.89 1.01 2.60
Sobha Ltd. 2.62 2.63 2.42 2.31 2.22 1.80 1.39 2.20
Unitech Ltd. 1.77 1.51 1.32 1.08 1.01 0.82 0.71 1.17
Consumer Goods 4.95 4.82 4.65 5.15 7.44 8.82 8.66
Avanti Feeds Ltd. 2.58 4.07 4.22 4.42 6.59 6.51 6.32 4.96 Bajaj Electricals Ltd 3.80 3.53 2.52 2.35 2.14 2.73 2.88 2.85 Bajaj Hindusthan Sugar Ltd. 1.10 1.07 0.57 0.56 0.61 0.94 0.91 0.82 Balrampur Chini Mills Ltd. 1.96 1.41 1.67 1.48 1.56 2.24 2.88 1.88 Bombay Burmah Trading
Corporation Ltd. 2.72 4.41 2.91 2.96 5.36 4.63 10.49 4.78 Century Plyboards (India)
Godfrey Phillips India Ltd. 6.02 6.28 5.64 6.17 5.33 10.32 10.48 7.18 Kaveri Seed Company Ltd. 3.37 3.12 4.01 7.98 13.75 6.01 6.86 6.44 McLeod Russel India Ltd. 4.82 5.04 4.36 3.82 2.89 2.06 1.85 3.55 PC Jeweller Ltd. 2.06 2.45 3.08 3.03 4.12 3.79 3.65 3.17 Radico Khaitan Ltd 3.76 3.41 3.44 3.54 3.15 3.30 4.15 3.53 TTK Prestige Ltd. 10.09 10.66 8.94 10.71 12.99 14.38 16.45 12.03 Tata Coffee Ltd. 6.86 7.01 8.21 6.38 6.11 4.03 4.71 6.19 V.I.P. Industries Ltd. 6.63 6.67 5.33 7.60 7.92 7.55 8.58 7.18 Zydus Wellness Ltd. 13.39 9.39 11.39 13.38 31.55 57.21 43.24 25.65
Energy 3.25 2.67 2.60 2.95 3.09 2.94 4.76
Aban Offshore Ltd. 1.88 1.18 1.60 3.09 3.65 2.82 6.81 3.00 Chennai Petroleum
Corporation Ltd. 5.14 4.21 3.72 4.27 4.27 4.69 5.46 4.54 Mangalore Refinery &
Petrochemicals Ltd. 3.50 3.00 3.01 2.35 1.80 1.55 3.83 2.72
SJVN Ltd. 2.49 2.28 2.06 2.09 2.63 2.68 2.95 2.45
Fertilizers & Pesticides 4.26 4.04 3.83 3.64 4.35 5.09 6.91 Chambal Fertilizers &
Chemicals Ltd. 2.94 2.87 2.16 2.28 3.23 2.83 3.88 2.88 Rallis India Ltd. 5.58 5.22 5.50 5.00 5.48 7.36 9.95 6.30
Industrial Manufacturing 3.38 3.20 2.82 2.79 4.12 4.03 4.69
GE Power India Ltd. 1.97 1.96 2.12 1.95 2.31 1.61 1.42 1.91 Greaves Cotton Ltd. 5.02 5.11 4.28 4.37 9.48 9.10 11.49 6.98 Praj Industries Ltd. 3.89 3.68 2.76 2.66 3.34 4.03 3.80 3.45 Time Technoplast Ltd. 3.46 3.17 2.83 2.80 3.02 2.81 4.17 3.18
UFLEX Ltd. 2.57 2.11 2.09 2.19 2.44 2.58 2.55 2.36
Metals 7.50 5.82 5.16 5.37 6.28 4.97 5.94
Gujarat Mineral
Development CorpLtd. 4.67 5.03 4.93 4.21 4.14 2.93 4.00 4.27 MOIL Ltd. 15.48 10.94 8.83 10.18 13.36 10.52 12.12 11.63 Welspun Corp Ltd. 2.36 1.49 1.72 1.72 1.34 1.45 1.70 1.68
Paper 1.19 0.99 1.20 1.39 1.17 1.32 1.24
Tamil Nadu Newsprint &
Papers Ltd. 1.19 0.99 1.20 1.39 1.17 1.32 1.24 1.21
Pharma 8.62 7.49 7.07 12.11 27.69 12.03 12.50
AstraZenca Pharma India
Ltd. 17.73 21.83 5.41 8.34 6.84 8.10 8.18 10.92
FDC Ltd. 10.36 10.36 10.36 10.36 10.36 10.36 10.36 10.36 Granules India Ltd. 2.87 2.57 2.44 2.98 3.75 4.73 3.82 3.31 Sun Pharma Advanced
Suven Life Sciences Ltd. 2.52 1.93 2.64 5.74 12.99 10.51 6.98 6.19
Textiles 1.32 1.38 1.65 1.96 2.50 3.55 3.69
Himatsingka Seide Ltd. 1.24 1.46 1.60 2.00 2.17 2.87 2.73 2.01 Indo Count Industries Ltd. 1.46 1.47 1.87 2.49 3.89 6.36 7.19 3.53
Trident Ltd. 1.26 1.01 1.36 1.89 1.50 1.51 2.04 1.51
Welspun India Ltd. 1.32 1.60 1.76 1.47 2.45 3.45 2.79 2.12
Telecom 1.54 5.64 6.19 5.38 6.42 8.30 6.11
Astra Microwave Products
Ltd. 1.95 9.55 9.40 7.47 8.56 12.95 9.05 8.42
Himachal Fut Com Ltd. 1.13 1.73 2.97 3.29 4.29 3.65 3.16 2.89
IT 5.61 5.82 6.08 6.59 7.78 16.91 14.94
Zensar Technolgies Ltd. 5.61 5.82 6.08 6.59 7.78 16.91 14.94 9.10 Average Z score 4.11 3.91 3.77 4.41 6.87 6.04 6.21 5.05
Source: Researcher’s calculations using the Z-Score Model, Feb’ 2018
The trend values of Z score can be used to predict the company’s financial situation for the coming period. Being a component of stock index gives the perspective that the company should have shown an increasing trend in its financial performance in the past. This would be one of the reasons to make it eligible to find a place on the index. The paper attempted to test this trend in the companies listed on Nifty Free Float Small cap 100.
The table 3shows Z score values of each company and whether it tends to rise decline fluctuate or stay stable for seven years study period (2011 to 2017). It was observed that majority companies followed a haphazard trend whereas some followed a consistent trend.
Some companies had consistently increasing financial health from 2011 2017. 20 companies of out of the sample of 53 companies showed this trend. These companies show promising future growth prospects to evolve into mid-cap companies.
Some companies on the contrary depicted decrease in their financial performance as indicated by their Altman Z score over the study period of 2011 to 2017. 11 companies out of the 53 companies formed part of this group.
H 3: Altman Z score is a viable tool for investment decisions
With hypothesis two proving false, it was endeavored to study the financial performance of individual companies, instead of relying on the financial health of the sector for investing decision.
The analysis of all the companies using Altman’s Z score resulted in classification of the company into safe companies, distressed companies and high risk companies. The classification conformsto Altman’s classification of companies with Z score of above 2.99 as safe companies 2.99 to 1.81 as distress companies and below 1.81 as bankrupt companies.
[image:10.612.79.541.258.331.2]High risk companies(10 companies)
Table 3: List of high risk companies
BASF India Ltd
Bajaj Hindusthan Sugar Ltd. Hindustan Construction Co. Ltd. Unitech Ltd.
Tamil Nadu Newsprint & Papers Ltd.,
Trident Ltd.
Welspun Corp Ltd. JK Tyre & Industries Ltd. Balrampur Chini Mills Ltd. GE Power India Ltd.
The above companies have a Z score of less than 1.81.
The following companies were included in this group even though they had an Altman Z score of more than 1.81. JK Tyre & Industries Ltd has been included in this group even though it has an average score of 1.88. The company is Z score was below 1.81 for most number of the years in the study period of 2011 to 2017.While GE Power India Ltd managed an average Z score of 1.91, it had a very low Z score of 1.424 at the recent year of 2017. Balrampur Chini Mills Ltd. has shown a growth over the years to a robust 2.88 Z score in 2017 but has an average Z score of 1.88.These companies being the exception may make it to the grey zone but they need to be keenly watched in the coming years.
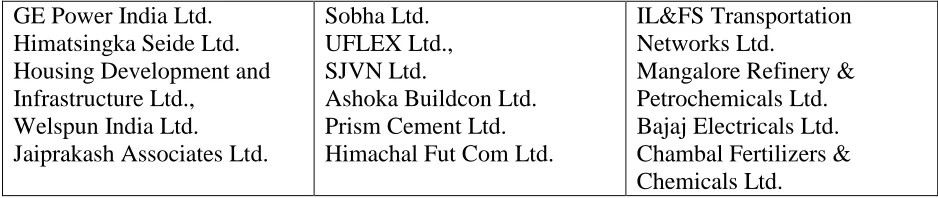
Distressed companies (15 companies)
Table 4: List of distressed companies
GE Power India Ltd. Himatsingka Seide Ltd. Housing Development and Infrastructure Ltd.,
Welspun India Ltd.
Jaiprakash Associates Ltd.
Sobha Ltd. UFLEX Ltd., SJVN Ltd.
Ashoka Buildcon Ltd. Prism Cement Ltd. Himachal Fut Com Ltd.
IL&FS Transportation Networks Ltd.
Mangalore Refinery & Petrochemicals Ltd. Bajaj Electricals Ltd. Chambal Fertilizers & Chemicals Ltd.
15 companies out of the sample of 53 companies are featured as distressed companies. Their Altman’s Z score range between 2.99 to 1.9. These companies which show a distressed financial position has the potential for improving financial performance. This can be achieved either debt restructuring or mergers or financial reconstruction. For investing in these companies the investor has to be prepared to take risk and keep a close watch on this year to year performance. The investors should opt out of these investments when the company digresses further into a Z score below 1.81.
Highest Safety companies/High Score companies: (28 companies)
Table 5 : List of highest safety companies
Aban Offshore Ltd. Deepak Fertilisers & Petrochemicals Corp. Ltd. PC Jeweller Ltd.
Time Technoplast Ltd. Granules India Ltd. Praj Industries Ltd. Rallis India Ltd.
Indo Count Industries Ltd. Tata Coffee Ltd.
Suven Life Sciences Ltd.,
Gujarat Mineral Development Corporation Ltd.
Bombay Burmah Trading Corporation Ltd.
Avanti Feeds Ltd.
Century Plyboards (India) Ltd Kaveri Seed Company Ltd. Greaves Cotton Ltd., Godfrey Phillips India Ltd., V.I.P. Industries Ltd.
Radico Khaitan Ltd
Astra Microwave Products Ltd. Zensar Technolgies Ltd.
FDC Ltd.,
AstraZenca Pharma India Ltd. MOIL Ltd.
TTK Prestige Ltd. Zydus Wellness Ltd.
Sun Pharma Advanced Research Company Ltd.
McLeod Russel India Ltd.
Chennai Petroleum Corporation Ltd.
[image:11.612.72.562.400.556.2]also expected to be stable in the long run. Lower risk is associated in investing in these companies. Investors cannot expect high returns in the short-term trading but may use these companies in portfolios for long-term return and growth.
7. Conclusion
Altman Z score model developed in 1968 is one of the most popular and widely used model to predict bankruptcy. Many researchers have used the Z score to predict default but in this study takes it a step forward to test whether the model can be used as a tool for investment decisions.
The paper primarily aimed to test the utility of this bankruptcy prediction model as a guidance tool for investment decisions.
The research analyzed the financial performance of the company vis-à-vis the performance of the sector using the Z scores. Even though most companies data follow the same trend as shown by the sector. But there were a few companies which showed performance which was opposite to that of the sector’s performance. For instance, Mangalore Refinery and Petrochemicals Ltd. was classified as default but the energy sector showed a very healthy status. Some sectors had their Z score performance upgraded with one odd company’s exemplary performance. This wasevident in the pharma sector which showed high performance with the help of Sun Pharma Advanced research Company Limited which had a successful run in the study period. The study concluded that sectorial performance would not be a good indicator of an individual company’s performance for investing decisions.
The paper further attempted to analyze the performance of the companies on an individual basis to get an in-depth understanding of the effectiveness of Altman Z score for investment decisions. The Z score classified the companies into safe, distress and insolvent companies. Out of the data set of 53 companies under study10 companies were found to be insolvent 15 companies were classified in the grey zone and 29 companies were found to have excellent financial health as depicted by their Z scores. With 29 companies having high Z scores reflects a very healthy status for the Nifty Free Float Smallcap 100 index.
It is recommended that investors who are looking for long-term investment with consistent returns should invest in companies with high Z scores.These companies have strong financial health and have shown consistent improvement in the growth, over the period of 2011 to 2017. The investors can expect them to display the same trend in the near future also. They should not be bothered by the fluctuations in the market prices of these companies. These are fundamentally strong companies. They will not only survive all economic cycles but will also grow consistently into mid-cap and then into large cap companies. Thereby increasing the wealth of the investors.
Companies with low Z scores are companies with weak financial health. These show financial distress. Investors should refrain from investing in these companies if they are in for a long haul. These are the companies which would turn into potential defaulters and are headed to bankruptcy and eventually could be liquidated. These companies may be good for intraday trading but the investors have to take the call, as the risk involved would be very high.
Companies which feature in the grey zone can go either ways. They can digress into default firms or they can turn around their distress by incorporating remedial measures. These companies, as prospective investments would need in more in-depth analysis using other financial evaluation models.
As Altman Z score gives a general indication of the company’s financial health more investigation would be warranted. It can be concluded that Altman Z score though a popularly used bankruptcy prediction model proves to be a useful tool to separate the financially strong companies from the weak ones. Altman Z score is recommended to be used in collaboration with other credit ratings to make prudent investment decisions.
References:
Altman, E.I (1968), Financial Ratios, Discriminant Analysis and Prediction of Corporate Bankruptcy, Journal of Finance, vol.23, pp189-209.
Altman, E.I., Haldeman R. G., and Narayanan P. (1977): ZETA Analysis: A New Model to Identify Bankruptcy Risk of Corporations. Journal of Banking and Finance, vol. 1: pp29-54.
Beaver, W (1967), Financial Ratios as predictors of failure, Empirical Research in Accounting: Selected Studies, Supplement, Accounting Research, Journal of Accounting Research, 5,pp71-127., 71-111.http://dx.doi.org/10.2307/2490171
Chouhan, V., Chandra, B., & Goswami, S. (2014). Predicting financial stability of select BSE companies revisiting Altman Z score. International Letters of Social and Humanistic Sciences, 26, pp 92-105. doi:10.18052/www.scipress.com/ILSHS.26.92
Kruithof, M. (2010). Prediction of Bankruptcy and Financial Risks: Using the Z-Score Model for AEX- and AMX- Investment Decisions. University of Amsterdam, Faculty of Economics and Business. Retrieved from https://slidedocument.org
Samarakoon, Lalith P. and Hasan, Tanweer, Altman’s Z-Score Models of Predicting Corporate Distress: Evidence from the Emerging Sri Lankan Stock Market (2003). Journal of the Academy of Finance, vol. 1, pp. 119-125, 2003. Available at SSRN: https://ssrn.com/abstract=1395229