Neuroscience and Measuring Brain
Functions
Hideaki Tomisawa
*1Neuroscience, the study of brains and the mind, has still many fundamental questions to be answered, as its targets, including molecules, cells, networks, and individuals, are complex and extensive. Meanwhile, neuroscience has been rapidly developing thanks to the recent remarkable progress in technologies for clarifying human genomes and the non-invasive measurement of brain functions. This paper first introduces strategic brain-science projects in several countries, and then shows examples of brain function measurement and analysis which use the magnetoencephalograph (MEG). Advances in measurement and analysis technologies for brain functions are needed in various research areas aiming to empirically decipher brains and the mind. This paper also introduces some novel technologies for intracerebral process estimation and intracerebral network verification.
INTRODUCTION
N
euroscience is a scientific field which deals with areas related to the fundamentals of life and mind through research on the structure, function and development of the nervous system, and its area covers a wide range of academic disciplines including molecular biology, genetics, physiology, pathology, psychology and behavioral science.Non-invasive brain function measurement technologies, such as functional nuclear magnetic resonance imaging, positron emission tomography, near-infrared spectroscopy, electroencephalograph and magnetoencephalograph (MEG), which are used in neuroscience, have been contributing to the development of medical care and neuroscience. At the same time they are making brain function measurement safer and accelerating decipherment of the brain and mind, sense and behavior, and mental activities.
This paper first introduces strategic brain-science projects
in Japan, the U.S., and the E.U., and then introduces case studies of brain function measurement.
STRATEGIC BRAIN-SCIENCE PROJECTS
One of the important factors which have promoted the
development of neuroscience has been big projects in many
countries which can be said to be strategic.
Examples are the “Decade of the Brain” declaration in 1990 in the U.S., the start of the “European Decade of the
Brain” and the “Human Brain Project (HBP)” in the E.U.,
and the establishment of the “Brain Century Promotion Conference” in Japan.
In Japan, the Ministry of Education, Culture, Sports, Science and Technology (MEXT) has defined the Scientific
Research on Priority Areas for brain-science, and started the Strategic Research Program for Brain Science. These
efforts have led to the clarification of brain functions by using brain function imaging, the clarification of neural cells at the
molecular level, the clarification of neurological diseases, the drive of computational neuroscience, the development of brain-machine interfacing, the development of model animals, and so forth being carried out.
In 2013, new plans of big projects for brain-science
towards the next ten years were announced. The “Brain Research through Advancing Innovative Neurotechnologies (BRAIN) Initiative” was announced in the U.S. in April (1), the
HBP was selected as the “European Flagship Project” in the
E.U. in January (2) and the “Plan for Clarifying Neural Circuit Functions of Primates through Innovative Technologies” was announced in June by the MEXT, Japan (3).
The BRAIN Initiative aims at finding out ways to prevent,
treat and cure cranial nerve diseases by clarifying the relation between the brain functions of a person and their behaviors, while promoting the development and application of new technologies to understand how a brain vigorously functions responding to instantaneous interaction between individual brain cells and complex neural circuits. The BRAIN Initiative also aims at research into neural circuits using model animals and data collection from the neural cells of the whole cerebral cortex of a mouse, while promoting the development and application of new optical sensors, advanced optical devices, and the like, using nanoparticle technologies.
Through integration of information and communication technologies (ICT) and biology, the HBT in the E.U. aims at clarifying the functions of the whole brain, developing new methods of treatment for brain diseases, establishing computational fundamentals for brain information processing, implementing an innovative ICT environment, and so on.
The “Plan for Clarifying Neural Circuit Functions of
Primates through Innovative Technologies” by the MEXT aims at understanding and overcoming neuropsychiatric diseases and establishing and applying information processing
theory to the brain, through clarification of the entire network
of brain functions, human mental activities and higher brain functions. It also aims to fully clarify the neural circuit functions of a marmoset at the neuronal level by completing a macro-level structure of the whole brain circuits of the
marmoset and its activity map, and it finally intends to fully
clarify the human neural circuit functions.
Another of the projects aims to clarify the characteristics
specific to the brain caused by a huge number of brain cells and complex circuits among brain areas, and still another aims to complete an activity map covering the whole brain at
the macro and micro levels. The final goal of all the projects
is to clarify in exact detail how a human brain functions. The following sections introduce MEG applications as examples in which non-invasive measurement of brain functions has the
potential for, and is expected to achieve the final goal.
EXAMPLES OF HUMAN BRAIN FUNCTION MEASUREMENT
A MEG system can record magnetic signals in the brain with a high time resolution (in milliseconds) without being
affected by the skull or cerebrospinal fluid existing between
its signal source and the sensor. The non-invasiveness of the MEG is suitable for measurement of brain functions for both children and adults. Thanks to its diverse and highly accurate analysis capability, the MEG system can be made use of for directly observing neural activities themselves and clarifying the whole brain and its development process.
Examples of brain function analysis based on studies using Yokogawa’s MEG system, the data measured by it, and the latest analysis technology are introduced below. Yokogawa has a research facility for simultaneously measuring the MEG of a child and an adult, and it is used for research on the development process of the brain, issues relating to parent-child communications, and so on. This paper introduces cases only using the MEG system for adults.
Brain activity analysis responding to a motor task
As the first example, this section briefly introduces the
analysis of the brain magnetic field responding to a motor task. A subject repeats a motion of grasping a stuffed toy small enough to fit in his or her hand at an arbitrary interval.
Activities of the sensorimotor area of the cerebral cortex were measured before, during and after the motions by using the MEG.
The signals generated in the brain are generally classified
into five waves depending on their frequency band: d wave (0.5 to 3 Hz), q wave (4 to 7 Hz), a wave (8 to 13 Hz), b wave (14 to 30 Hz), and g wave (31 Hz or higher). This paper uses these designations as well.
Figure 1 (a) shows the magnetic brain waves before,
during and after the motions obtained from sensors positioned in the vicinity of the sensorimotor area. b and low-g waves,
which are not observed before and after the motions, appear several seconds after the start of the motions.
Figure 1 (b) shows an isomagnetic field map of the
brain. Intracellular currents are generated by the activities of the neurons related to the motions, and they generate
magnetic fields around them. Intracellular currents are just
beneath the boundary between the source (red area) and the
sink (green area) of the magnetic field lines. The activities of
the sensorimotor area of the cerebral cortex can be observed through the brain activity analysis responding to this task.
Figure 1 Examples of the analysis results of the
brain magnetic field responding to the motor task (by Yokogawa’s MEG system)
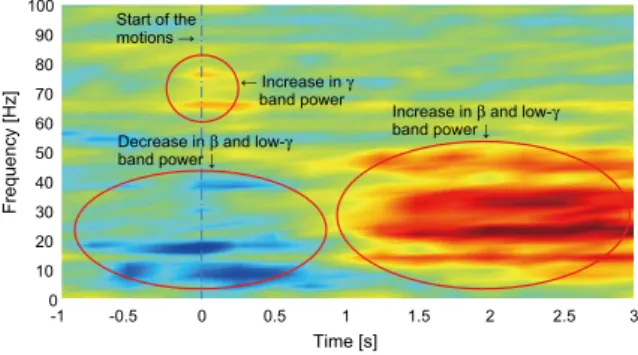
Next, temporal changes in power at each frequency were derived from the magnetic brain waves measured by the sensors positioned over the sensorimotor area. Figure 2 shows the results. The blue area indicates a decrease in power at a relevant frequency, and the red area indicates an increase.
Immediately before and after the start of the motions, g band power increases. b and low-g band power decreases before and after the start of the motions, and then starts to increase approximately one second after the start of the motions. Thus, the relation between the brain activity and the changes in power at each frequency can be observed.
Figure 2 Time-frequency analysis of the power change of a magnetic brain wave (by Yokogawa’s MEG system)
Brain activity analysis responding to tasks involving selection of commodities
As the second example, this section introduces a study on brain activities when selecting pictures of commodities conducted by Y. Iguchi, et al. (4) using Yokogawa’s MEG system.
(a) Magnetic brain waves observed
before, during and after the motions (b) Isomagnetic field map Start of motions ↑ Appearance of β and low-γ components → 5 0 -5 [pT] 88 90 92 94 Time [s] Measuring the start of motions by using an electromyogram Magnetic brain waves 5 0 [V] Sink Source 500fT/Step 0 0.5 1 1.5 2 2.5 -0.5 -1 3 Time [s] Frequency [Hz] 0 100 20 30 90 80 70 60 50 40 10 Start of the motions → ← Increase in γ band power
Decrease in β and low-γ
band power ↓
Increase in β and low-γ
The main purpose of this study is to identify intracerebral routes used for decision-making led by favorable impressions.
A subject is requested to select pictures of commodities from
among 400 pictures of commodities of ten types presented one by one. The motivation for the selection is controlled by the following two tasks of different criteria.
a) Free selection (main task): A subject freely selects favorable
commodities. When a picture of a favorable commodity is
presented, the subject responds by pushing a button with
their left hand. The pictures are grouped into block units by types of commodities such as chairs or kettles, each of which is a set of ten pictures. This task is performed using 40 blocks in total.
b) Shape identification (comparison condition): A subject identifies the shape of commodities. In this case, one block
unit, a set of ten pictures, consists of a combination of two types of commodities. For example, three pictures of a chair and seven pictures of a kettle, that is the ratio of target items to non-target items is 3:7; they are presented in
a random order. The subject pushes a button when a picture
of a chair, that is a target item, is presented. This is a two-choice question.
In both the tasks, a stimulus given as a picture and a behavior whether to push a button or not are the same, but only the motivation for selection is different.
The measured data of the spontaneously generated brain magnetic fields are analyzed by using the spatial filtering method, and the brain activities are observed by superimposing the activated areas obtained by the analysis onto the images obtained by magnetic resonance imaging (MRI).
During the selection, more increase in power of the magnetic brain wave in the high-frequency band, from 22 to 100 Hz, is observed as compared with that at other times. Such a magnetic brain wave in a high-frequency band is considered to reflect information communication between brain areas. As shown in Figure 3 (a), the left orbitofrontal area, right anterior cingulate gyrus, and supplementary motor area and its outer six areas, all of which are specific to the free selection, are activated. These activations in the frontal
area are not observed in the case of the shape identification as
shown in Figure 3 (b). Meanwhile, the areas activated in both cases are the posterior region of the right middle frontal lobe, the motor area, the primary somatosensory area, and a part of the parietal lobe from the superior parietal lobe to the inferior parietal lobule. These areas are considered to be activated by the motion related to the button push action by the left hand.
Through this experiment, the intracerebral processes from the decision-making of selection motivated by favorable impressions to the execution of action, including emotional
judgment, motivation for an action, decision and execution of
the action, and the sensory feedback, were estimated.
The method described here is a new technique for imaging brain functions capable of tracing temporal changes in brain activities in a unit of milliseconds.
In addition, the analysis results show differences in brain activities between when selecting favorable commodities and when selecting specified commodities. This is an example
showing that human interests or preferences can be objectively
measured.
Figure 3 Examples of the analysis results of the brain
magnetic field responding to the tasks of selecting commodities
(The details and figures relating to the tasks of selecting commodities are provided through the courtesy of Mr. Yoshinobu Iguch of the Tokyo Metropolitan Institute of Medical Science.)
CFC Analysis
As projects in Japan, the U.S. and the E.U. are proceeding
with the clarification of interactions among brain cells and networks among brain functions, comprehensive techniques for analyzing hierarchically organized brain functions covering multiple layers are required. This section introduces cross frequency coupling (CFC) analysis, which is a technique for understanding the connections and networks among neural activities.
CFC analysis has already been applied in studies using intracranial electrodes (5), and is an attractive technology as an approach for clearly verifying brain systems and their hierarchical models.
Brain activities are explained by the existence and power of various magnetic brain waves such as a, b, g waves and so on. An increase in power of the g band and a decrease in power of the b and low-g bands immediately before and after the start of the motions are shown in the analysis of the motor task in the previous section.
Meanwhile, it is supposed that all magnetic brain waves of different frequencies are not generated independently but that
(a) Free selection task selecting favorable
commodities
(b) Shape identification task identifying specified
commodities • Brain surface images with data analyzed by MEG superimposed on it • Upper: three-quarter view of the left hemisphere, Lower: lateral view of the right hemisphere
ACC Anterior cingulate cortex SMA Supplementary motor area BA6 Brodmann area 6 OFC Orbitofrontal cortex
MA Motor area
SI Primary somatosensory cortex PC Parietal cortex
pMFC Posterior middle frontal cortex Front Rear Left Right Front Rear Left Right
some of them have mutual relationships such as some kinds of interactions, coupling, or signal transmission directionality. A clarification and verification of brain function by using the CFC analysis is anticipated. The CFC analysis can detect coupling of waves of different frequencies, such as phase-amplitude coupling (PAC) and phase-amplitude-phase-amplitude coupling (AAC).
PAC analysis is explained below as an example of the CFC analysis. PAC is coupling between waves of different frequencies, and its existence is characterized by a state where the amplitude of a wave at a relatively higher frequency is modulated by phases of a wave at a lower frequency, i.e. what is called amplitude modulation is taking place. Figure 4 shows the conceptual diagram of a PAC search. The PAC search is a process of detecting a pair of a carrier wave (red wave) and a modulating wave (blue wave) which most suitably describe the observed signal with fluctuation of amplitude (green wave). The procedure for the experiment and its analysis is outlined below.
Figure 4 Conceptual diagram of a PAC search A subject repeatedly moves their finger at an arbitrary
interval, their magnetic brain waves are measured using the MEG, and then the strength of the PAC caused by its high and low frequency components at the same portion is calculated over the whole brain while focusing on the relationship between phases of the low frequency component and amplitude of the high frequency component. In Figure
5 (a), strong mutual coupling is seen in the circled area.
Figure 5 (b) shows the temporal changes in the strength of
the coupling caused by various low frequencies and the fixed
high frequency. The horizontal axis measures time in seconds, the vertical axis is a frequency of the low frequency band which shows a strong coupling with a g wave of 60 Hz, and the darker red area indicates stronger coupling.
Strong coupling appears before the start of the motion, but disappears approximately one second before the start.
After this, we will start the analysis of the coupling between different areas and verify the feasibility for analyzing information transmission between areas and network functions.
Figure 5 Example of a PAC analysis (by Yokogawa’s MEG system)
Schrodinger says “In biology we are faced with an entirely different situation. A single group of atoms existing only in one copy produces orderly events, marvelously tuned in with each other and with the environment according to the most subtle laws.” (6) We consider that the CFC analysis will evolve as a means for clarifying a mechanism creating orderliness in the brain and information transmission between brain areas.
EXPECTATIONS FOR BRAIN FUNCTION MEASUREMENT
Benjamin Libet demonstrated the fact through his experiment on flexing of the wrist and awareness of its owner;
the awareness of the will to perform a free and voluntary action appears 150 to 200 milliseconds before the action, and about 400 milliseconds before that, i.e. about 400 milliseconds before a person who intends to perform the action recognizes their own will or intention, a spontaneous process in the brain is initiated unconsciously. (7) Additionally, other researchers claim the following: since as many as 95% of human decisions are unconsciously made (8), it is extremely difficult for human beings to survive without the unconscious processes in their minds (9), and judgment, decision-making, and behavior can be distorted by cognitive biases (10).
Mu lt id i s c i pl i n a r y r e s e a r c h i n f ield s s u c h a s neurophilosophy and neuroeconomics are already progressing. These regard the empirical knowledge obtained from neuroscience such as the knowledge mentioned above and the facts based on observation or experiments of human beings as important.
Furthermore, trends to innovate business by making use of neuromarketing, which uses neuroscience and brain function measurement, are already being seen. In questionnaire surveys, group interviews, and behavior observations used for marketing, customer’s preferences and decision-making may be affected by their unconscious and cognitive biases, causing questionable credibility of the research results. Especially in the U.S. and E.U., companies providing neuromarketing research have been established and their business activities are expanding. (11) In the fields of product development and design as well, case studies making use of neuroscience have been reported. For the industrial application of neuroscience,
Fr eq ue nc y Fr eq ue nc y PAC Search Observed waves
Assuming existence of coupling caused by two waves of different frequencies, a pair of waves most suitably describing the observed wave are found out. High-frequency waves
Low-frequency waves
-1 0 1
-2
-3
Elapsed time {second} 20 6 18 16 14 12 10 8 Start of motions P
AC index (strength of coupling)
Frequency of low-frequency components [Hz]
0.2
-0.2 0
(a) Area where strong coupling is observed (lateral view of the right hemisphere)
(b) Changes in strength of coupling between low and high frequency components
(High-frequency components: 60 Hz)
Waiting for the start of movement
although the accumulation of much knowledge is necessary, progress from a flexible viewpoint is sought without having
to wait for clarification of all the facts. Of course, at the same
time, it is indisputable that the application requires ethical consideration based on neuroethics.
Conventionally, brain activities have been observed by measuring magnetic brain waves and estimating sources of these activities from measured results. Time-frequency analysis of magnetic brain waves is one of these brain function analysis methods. In addition to conventional technologies, detection of spatio-temporal and dynamical propagation of information processing involved in brain activities, observation of information exchange between brain areas, observation of mechanisms functioning as networks, and even synthetic observation covering these are required. Technologies for brain function measurement and analysis are advancing to respond to those requirements, and will be continually made full use of as some of the most important technologies in neuroscience. We are confident that these technologies can respond to the requirements from the research areas where research and application development
are promoted to objectively understand the human mind, judgment, behavior and even unconsciousness by using the
various forms of knowledge of neuroscience. This applies also to those industrial areas where innovation beyond common sense, which people used to consider as the norm, is now also to be expected.
CONCLUSION
The efforts for protecting human lives and improving quality of life, and research aiming to clarify the human brain and mind will unlimitedly continue. We hope that brain function measurement technology will contribute to achieving clarification of the whole human brain and its development processes.
REFERENCE
(1) President Obama, “Brain Research through Advancing Innovative Neurotechnologies (BRAIN) Initiative,” the White House, 2013 http://www.whitehouse.gov/infographics/brain-initiative
(2) HBP Summit 2013, Human Brain Project (HBP), 2013 http://www. humanbrainproject.eu
(3) Brain Science Committee, The agenda of the 21st Brain Science Com mit tee, the Mi nist r y of Education, Cult u re, Spor ts, Science and Technology (MEXT), Japan, 2013 in Japanese
http://www.lifescience.mext.go.jp/2013/06/212566.html
(4) Y Iguchi, S Hoshi, et al., “High frequency activities in the frontal cortex induced by a commodity-picture selection task,” 27th Annual Meeting of JAPAN Biomagenetism and Bioelectromagnetics Society, 2012 in Japanese
(5) T Yanagisawa, O Yamashita, et al., “Regulation of motor representation by phase-amplitude coupling in the sensorimotor cortex,” The Journal of Neuroscience, Vol. 32, No. 44, 2012, pp. 15467-15475
(6) E Schrodinger, What Is Life? : The Physical Aspect of the Living Cell
with Mind and Matter & Autobiographical Sketches, Cambridge Univ Pr, 1992
(7) B Libet, Mind Time: The Temporal Factor in Consciousness, Harvard
University Press, 2004
(8) A. K. Pradeep, The Buying Brain: Secrets for Selling to the Subconscious Mind, Wiley, 2010
(9) T. D. Wilson, Strangers to Ourselves: Discovering the Adaptive Unconscious, Belknap Press, 2004
(10) D Kahneman, D Lovallo, et al., “The Big Idea: Before You Make That
Big Decision..,” DIAMOND Harvard Business Review, Vol. 36 No. 11 2011 pp. 56-73 in Japanese
(11) G Tanabe, K Onodera, et al., Why Does the Brain Make Us Buy