REPORT OF INVESTIGATION 94
Illinois Third Consecutive Severe Winter:
19784979
by STANLEY A. CHANGNON, Jr., DAVID CHANGNON, and PHYLLIS STONE
Title: Illinois Third Consecutive Severe Winter: 1978-1979
Abstract: For the first time since records began in the 1880s, a third consecutive severe winter oc curred in Illinois in 1978-1979. Seventeen major winter storms, the state's record coldest January-February (15.9°F, or 14° below normal), and record snow depths (≥40 inches) gave the winter of 1978-1979 a rank as the second worst statewide for Illinois, exceeded only by the prior winter of 1977-1978 (18 storms, coldest statewide December-March, record longest lasting snow cover). The 1978-1979 winter was the worst on record in the northern fourth of the state, where snowfall aver aged 68 inches and point record totals of up to 100 inches occurred. Average snowfall for the state was 42.8 inches, or 23.3 inches above normal. In other parts of the state snowfall averages were: 40 inches (20 above) north central, 32 inches (12 above) south central, and 31 inches (22 above) southern Illinois. Severe storms began in late November and extended into March; fourteen storms also had freezing rain, but ice was moderately severe in only two cases. High wind and blizzard con ditions occurred in only three storms (compared with eight in prior winter), suggesting a lack of ex tremely deep low pressure centers. The 1978-1979 winter had a myriad of socio-economic impacts, the most serious ones in the Chicago metropolitan area. Surface and air transportation was hardest hit, but utilities, businesses and industries, institutions, farm operations, and many human activities were also affected. Ten deaths and at least 60 serious injuries were attributed to the storms. Reference: Changnon, Stanley A., Jr., David Changnon, and Phyllis Stone. Illinois Third Consec utive Severe Winter. 1978-1979. Illinois State Water Survey, Urbana, Report of Investigation 94, 1980.
Indexing Terms: blizzards, glaze, heavy snow, ice storms, Illinois, lake effect, severe storms, snow, storm damages, synoptic analysis.
STATE OF ILLINOIS
HON. JAMES R. THOMPSON, Governor INSTITUTE OF NATURAL RESOURCES
FRANK H. BEAL, M.U.P., Director
BOARD OF NATURAL RESOURCES AND CONSERVATION Frank H. Beal, M.U.P., Chairman
Walter E. Hanson, M.S., Engineering Thomas Park, Ph.D., Biology Laurence L. Sloss, Ph.D. Geology H. S. Gutowsky, Ph.D., Chemistry Lorin I. Nevling, Ph.D., Forestry
William L. Everitt, E.E., Ph.D., University of Illinois John C. Guyon, Ph.D., Southern Illinois University
STATE WATER SURVEY DIVISION STANLEY A. CHANGNON,JR., M.S., Chief
URBANA 1980
Printed by authority of the State of Illinois (21027— 1M—10-80)
CONTENTS
PAGE
Abstract 1 Introduction 1
Assessment of severe winters in Illinois 2 Temperature/snow comparisons 2
Regional analysis 4 ' Notable severe winter storms and storm periods 7
Acknowledgments 8 Analytical methods 10 Storm analyses 10
Storm patterns 10 Storm characteristics 14 Severity of the winter conditions 18
Snow cover 18 Monthly and seasonal snow totals 19
Chicago area precipitation 22 Impacts of storms 23
Major impacts 23 Summary of impacts 25
References 31 Appendix. Local climatological data — Midway Airport 32
Illinois Third Consecutive Severe Winter: 1978-1979
Stanley A. Changnon, Jr., David Changnon, and Phyllis StoneABSTRACT
For the first time since modern weather records began in the 1880s, a third consecutive severe winter occurred in Illinois in 1978-1979. Seventeen major winter storms, the state's record coldest January-February, and record snow depths on the ground gave the winter of 1978-1979 a rank as the second worst statewide for Illinois, exceeded only by the prior winter of 1977-1978 (18 storms, coldest statewide December-March, record longest last-ing snow cover). In the northern fourth of Illinois, 1978-1979 was the worst winter on record.
Severe storms began in late November and extended into March; the seven major storms in January set a new record high for the month, the four in February tied the previous record, and the four in December fell one short of the record. Fourteen storms also had freezing rain, but ice was moderately severe in only two cases. High wind and blizzard conditions occurred in only three storms (compared with eight in prior winter), suggesting a lack of extremely deep low pressure centers. Most storms occurred with Texas lows, Colorado (north track) lows, and miscellaneous synoptic conditions. The super storm of 11-14 January set a point snow record of 24 inches, left snow cover of more than 3 inches over 77% of the state, and lasted 56 hours.
Snowfall for the 1978-1979 winter averaged 68 inches (38 inches above normal) in northern Illinois, 40 inches (20 above) in the north central part, 32 inches (12 above) in south central Illinois, and 31 inches (22 above) in southern Illinois. Record totals of 60 to 100 inches occurred in northern Illinois. The winter temperatures averaged 7.8 F below normal in northern Illinois and about 7 below in the rest of the state. January-February temperatures averaged a record low of 15.9 F, 14 degrees below normal, and prevented melting between storms so that record snow depths of more than 40 inches occurred in northern Illinois.
The 1978-1979 winter had a myriad of socio-economic impacts, the most serious ones in the Chicago metropolitan area. Surface and air transportation was hardest hit, but utilities, businesses and industries, institutions, farm operations, and many human activities were also affected. Ten deaths and at least 60 serious injuries were attributed to the storms. Highest dollar costs were for snow removal, roof repairs, and pothole repairs, but loss of business sales or services and absenteeism were also costly, as were several delayed impacts such as spring flooding.
INTRODUCTION
Record winter storms with resulting record totals of snowfall, accumulations of snow depth, and record cold occurred in Illinois during the winter of 1978-1979. Seventeen major winter storms occurred during a 3½-month period, and the state's record coldest January-February period produced an enormous economic impact in Illinois and great
human suffering including at least 10 deaths. Iron-ically, this was the third consecutive severe winter in Illinois, the first time for such a series of events since detailed state weather records began in the 1880s, and this one was a unique combination of extreme cold and heavy snowfall.
worse than any other over an area as large as Illinois, particularly when one assesses collectively the dura tion of the severe winter conditions, the amount of snowfall, accumulated snow depth, the number of severe winter storms, and the departures of the temperatures. However, by several standards, but not all, and in some areas of Illinois, the winter of 1978-1979 ranks as the worst since detailed weather records began about 100 years ago.
Coming in the aftermath of two prior severe winters (1976-1977 and 1977-1978), this third blow to the state's economy and its populace has had lasting impacts, particularly in the Chicago region, affecting many institutions and leading to considerable emigration from the state.
Climatologically, the occurrence of three con secutive extremely severe winters was unique, with in the context of the 1880-1979 period. However, examination of statewide average temperatures since 1880 reveals that the state's average tempera ture steadily increased from 1880 to 1940 but has been declining since 1940, becoming particularly lower in the colder half year (October-March). In fact, statewide average temperatures in the 1970s matched those of the 1890-1910 period. Further more, the only somewhat comparable sequence of cold snowy winters during the 1880-1976 period occurred in 1903-1906. Thus, although the winter of 1978-1979 was very abnormal, and the occur rence of three bad winters in a row was a first, severe winters may become more frequent in the future, at least with respect to conditions of the 1920-1970 period.
Assessment of Severe Winters in Illinois
Severe winters in a continental climate such as that of Illinois are often identified by certain con ditions, typically heavy snows and/or extremely cold temperatures. As noted in a prior study (Changnon and Changnon, 1978), one type of severe winter is based on those that have extremely cold periods of 1 to 2 months duration, either with or without much snowfall. Examples of such ex tremely cold, short winters of this type are the December 1976-January 1977 period with an avci-age temperature of 17.0° F, and the December
1917-January 1918 period with a mean tempera ture of 16.8° F.
Interestingly, neither of these 2-month cold periods was associated with excessive snowfalls nor with prolonged winter seasons. The winter of
1978-1979 was similar in that it had two extremely cold months, January and February 1979. The average state temperature in this 2-month period was 15.9° F, the two coldest consecutive months on record (since 1880) in the state. However, the winter of 1978-1979 had heavy snows, unlike the 1917-1918 and 1976-1977 severely cold periods.
The other basic type of severe winter in Illinois is one with severe ice storms and heavy snowfalls occurring repeatedly over a period of 6 weeks up to 12 weeks. The prior winter of 1977-1978 was notable as having these frequent prolonged heavy snows (18 major storms) lasting from late Novem ber into late March. It did not have the prolonged (≥2 months) severe cold. The winter of 1978-1979 also qualified for the snowy winter type. It had 17 major winter storms (each with more than 4 inches of snow at a point in Illinois) between late Novem ber and mid-March 1979. Thus, the winter of 1978-1979 qualified as a severe winter by having both 1) two extremely cold months with temperatures averaging 14.0° F below normal, and 2) frequent storms resulting in excessively heavy snowfalls that became winter records in the northern fourth of the state. Thus, it qualified in both types of severe winters.
A major question is raised: "How does the winter of 1978-1979 rank among other severe Illinois win ters, and particularly in regard to the two prior ex tremely severe winters?" With all factors considered, this third consecutive bad winter ranks as the second worst, on a state basis, since the first detailed and widespread weather records began in the 1880s. In the extreme northern parts of Illinois, the winter of 1978-1979 ranks as the worst, but on a statewide basis it ranks slightly behind the winter of 1977-1978. This ranking is based on consideration of the temperatures, number of storms, and the duration and depth of the snow cover.
Temperature/Snow Comparisons
A most interesting assessment of the 1978-1979 winter, when compared with those that have occur red since 1880, is offered by a direct comparison with the prior winter, 1977-1978 (table 1). Both had numbers of severe winter storms that exceeded
Table 1. Comparison of Recent Illinois Winters
1977-1978 1978-1979 Storm Characteristics
Record total number of storms — 18 Second largest total of storms — 17
One super ice storm and 7 with ice 14 storms with ice, but only 2 moderately severe Blizzard conditions — 8 Blizzard conditions — 3
Storm maximum totals (10 to 15 inches) New record storm maximum snowfalls (20 to 24 inches)
Snow covered Illinois in 5 storms Snow covered Illinois only once Above average duration of storms — 18 hours Record long-lasting storms — 24 hours Super storm was 24-26 January Super storm was 12-14 January
Relatively large number of Alberta lows and Relatively large number of Texas lows and Colorado (south track) lows stationary fronts
Temperature
Coldest Dec-Mar (22.4° at CHI Second coldest winter (22.7° at CHI 28.1 ° at MTV) 29.7° at MTV) No record cold for 2 months Coldest Jan-Feb (15.9°F, 14°F below normal) Few record low temperatures, but persistent Several daily record lows
below normal values
Snowfall
Total snowfall in most of central and southern Total snowfall in northern Illinois was record Illinois was record (35 to 70 inches) (60 to 100 inches)
Record longest-lasting snow cover — most of Long lasting snow cover (record in northern
Illinois Illinois) Third or 4th greatest snow depths Greatest snow depths on record
(>15 inches in southern Illinois) (>40 inches)
Severity Assessment
Record deaths — 62 Above normal deaths — 10
Damages widespread over state Most damage in Chicago and northern Illinois Record worst winter in southern 3/4 Record worst winter in northern 1/4
Worst winter ever on statewide basis Second worst winter on statewide basis
1976-1977 Winter
1. Dec-Jan period was 3rd coldest 2-month period at 17.0° F 2. Record snows for January in central Illinois
3. Winter snows were 50% above normal in central and southern Illinois 4. Seventh worst statewide winter (1911-12,1917-18,1903-04, & 1959-60)
the pre-1977 record, and both had record total winter snowfall impacts. Their major differences were in the temperature records. The 1978-1979 winter had extremely low temperatures in two months, January-February, whereas the 1977-1978 winter had no comparable extremely cold 60-day period. The winter of 1978-1979 had more days with record low temperatures than occurred in 1977-1978. However, the statewide mean temper-atures of the 1978-1979 winter season (December-March) ranked slightly behind (higher values) the record seasonal low set in 1977-1978.
For example, the Chicago (Midway) winter aver-age temperature in 1978-1979 was 22.7°F, which
is only 0.3° F higher than the record seasonal low of 1977-1978 (22.4° F) and the second coldest win-ter on record at Chicago since 1855. At Urbana, the 1978-1979 winter average temperature was 24.9° F, 1.4° F above the record of the prior winter (23.5°), which was the seasonal coldest since records began in 1888. Mt. Vernon, in southern Il-linois, had a winter mean temperature of 29.7° F, 1.6° below the record low set at Mt. Vernon for 1977-1978.
The 1978-1979 winter temperatures at points across Illinois were generally 7 to 8°F below 1941-1970 normals, being relatively colder in the north than in the south. Temperatures throughout Illinois
in January and February were generally 13 to 14° F below normal. In December and March, the north-ern third of Illinois also had below normal temper-atures (4.0° F below in December and 1.0° F below in March), but in southern Illinois the December and March temperatures were normal.
As noted above, the 1977-1978 winter had a longer period of below normal temperatures, lasting from early December through March. Consequently, this bad winter had a more prolonged period of snow on the ground than existed in the winter of 1979. However, the heavy snowfalls of 1978-1979 coupled with the extremely low temperatures in January-February 1979 produced greater snow depths (less melting between storms), particularly in the northern third of Illinois. Thus, snow cover (depth) in 1979 caused more structural damage due to the greater weight of the snow than in the 1977-1978 winter.
As shown in Changnon and Changnon (1978), the 1977-1978 snow cover greater than 1 inch in northern, central, and southern Illinois persisted from late November through the end of March, ranging from 2 to 16 inches in depth. In the 1978-1979 winter, snows that fell in central and northern Illinois in early December produced snow cover with at least 1 inch depth, lasting until mid-March, a 3-week shorter period than in 1977-1978. How-ever, depths of snowfall by early January 1979 had reached 10 to 20 inches in all of northern Illinois, achieving depths of up to 40 inches in extreme northern Illinois by mid-January. Snow depths re-mained above 20 inches from the middle of January until the end of February throughout the northern third of the state. Needless to say, the two winters were the worst back-to-back winters in the past 100 years, the period of quality weather records for most of the state.
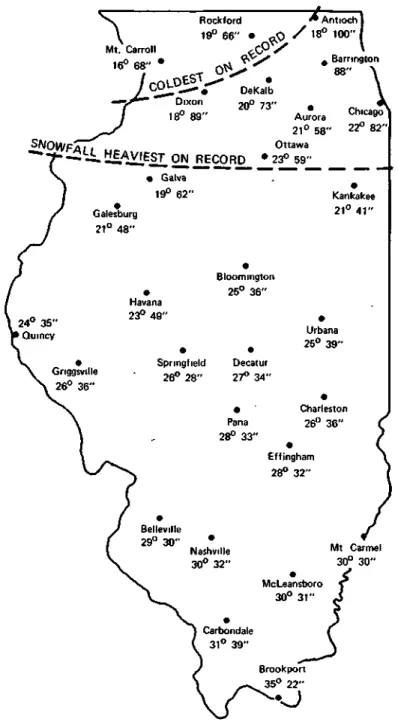
Figure 1 summarizes the temperature and snow-fall values for the winter (December-March) of 1978-1979. The snowfall totals in the northern fourth of the state were largely in excess of 60 inches, and were new records, exceeding by any-where from 2 to 12 inches (at a point) the record high values set in the prior winter. The heaviest total snowfall, greater than 100 inches, fell at Antioch. Also shown in figure 1 are the average winter temperatures for the 4-month period. Note that the temperatures in the extreme northwestern corner of the state were new record lows.
Regional Analysis
Another assessment of the 1978-1979 winter was made by studying the state on a regional basis. The state was divided into four areas shown in figure 2. The areas were formed along the east-west oriented boundaries of crop reporting districts, and then the values of some 20 stations in each area were averaged. Regional calculations were made (for December-March) of mean temperature and total snowfall, and then of their departures from normal. The resulting values and their departures appear on figure 2. The northern area's mean temperature was 20.0° F which was 7.8° F below normal. The area's average snowfall was 67.9 inches, being 38.3 inches above normal, or more than double the 1941-1970 normal. Inspection of the other areas reveals that temperature departures were slightly less below normal in the southern part of Illinois (—7.0°F) than in the northern fourth. Mean snow-fall in the south central area was 31.7 inches, representing the least departure, being 12.2 inches above normal. The excesses of both temperature and snowfall in the southern three-fourths of Illi-nois occurred largely in January and February with near normal temperatures and snowfall in December and in March. However, the severe winter condi-tions arrived earlier in the northern fourth. For example, the northern area averaged 22.4 inches of snow in December, 14 inches above normal. The state's average snowfall in the winter was 42.8 inches, which was 23.3 inches above normal, or more than twice the normal.
As shown in figure 1, the excessive snowfall in northern Illinois ranked as the greatest snow totals on record, exceeding the record highs set there in the prior winter, 1977-1978. The total snowfall values in the western and central areas typically ranked as the second or third highest on record. Snowfalls in 1978-1979 at south central locations, such as Effingham, Lawrenceville, and Greenville, typically ranked as the fourth or fifth highest in the past 100 years. However, the relatively heavier snowfalls in the extreme southern fourth of Illinois ranked as the second or third highest on record at places like Mt. Vernon, Du Quoin, and McLeansboro. The state experienced 17 severe winter storms, each of which produced 4 inches or more snowfall somewhere in the state. Six of these storms were accompanied by extensive freezing rain. This was one less severe winter storm than the record number
Figure 1. Temperature and snowfall values for the winter (December-March) of 1978-1979
Figure 2. Regional mean temperatures and total snowfall and their departures from normal, winter of 1978-1979
of 18 that occurred in 1977-1978 (Changnon and Changnon, 1978). All locales in the state experi-enced four or five severe storms in 1978-1979 with a high frequency of severe storms in the northern fourth (nine storms) and southern fourth (six storms) of the state. Examples of places that had large numbers of extreme storms are revealed by snowfalls at Chicago O'Hare Airport. The sequence of storms at that location included 5.2 inches on 26 November, 9.5 inches on 1-2 December, 5.4 inches on 6-8 December (20.1 inches in 13 days), then 17.0 inches in two late December storms, and 31.8 inches in 4 storms in 14 days (11-24 January). Locales in extreme southern Illinois, where total winter snowfall is typically 10 to 12 inches, also had unbelievable sequences of heavy storms. For example, Marion had 9 inches in two late January storms and then 21 inches in a late February storm. The state had three periods of very severe storms. In the northern third of Illinois, there was a series of three severe storms in late November and early December. This area and central Illinois were hard hit in the last five days of December with two major storm systems. The state's third and worst sequence of storms occurred during 11-28 January when five storms crippled most of the state. These stormy periods and their severest storms are discussed in the next section.
Notable Severe Winter Storms and Storm Periods
The first of a series of three major stormy periods occurred during 26 November-8 December 1978. Three storms were concentrated in the northern fourth of Illinois during this period with more than 5 inches of snow produced by each storm and with narrow belts of heavy snow occurring in and west-ward from Chicago. The second of these three
storms, which occurred on 1-3 December and pro-duced 13.3 inches of snow at Dixon, was rated as the fifth worst of the 17 storms of the 1978-1979 winter. The third and final storm of this 12-day stormy period occurred on 6-8 December. It too was an extremely damaging storm. The storm was preceded by thunderstorms followed by freezing rain over most of the state and then widespread heavy snow over the northern third of Illinois (16,500 square miles had more than 6 inches of snow). The layer of ice followed by heavy blowing
snows ranked this as the third worst of the winter's 17 storms. At the end of this 12-day period, north-ern Illinois had suffered through three successive severe storms and was covered by more than 6 inches of snow which only partially melted before the next series of severe storms began 3 weeks later, in late December.
The winter's second stormy period lasted only five days and consisted of basically two major storm periods. However, nearly continuous snow occurred over the period in much of northern Illi-nois. This was the second stormy siege in the north-ern third of Illinois, but also there was an extreme-ly damaging ice storm in central Illinois. The storm on 31 December-1 January produced up to 21 inches of snow at Marengo and more than 6 inches of snow over 23,000 square miles (nearly half of Illinois). This storm, rated as the second worst of the winter, led to a near stoppage of air, rail, and surface vehicle travel in most parts of central and northern Illinois for several days. Two lesser snow storms occurred in southern Illinois during 4-7 January, becoming the winter's first storms of any consequence in that area.
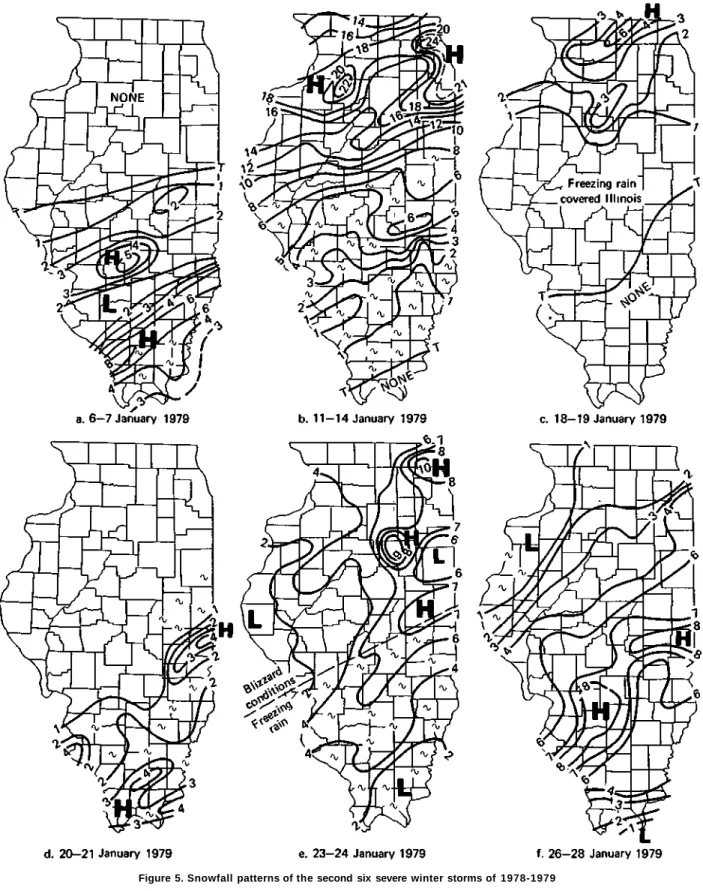
The third and worst period of storms of the winter began on 11 January and ended on 28 Jan-uary. This 18-day period had five major winter storms all maximizing in either northern or central Illinois. The first of the five storms, on 11-14 Jan-uary, was the worst of the winter. Snowfall lasted on the average 56 hours in the major snow belt of northern Illinois, and the maximum fall was 24 inches at Barrington. More than 6 inches of snow fell over 31,000 square miles, 60% of the state. At the end of this 2½-day storm, most of the state was at a standstill. All transportation in northern Illinois was cut off and business and industry were severely crippled. Four days later, a second storm hit ex-treme northern Illinois (6 inches at Rockford), and in the subsequent two days (20-21 January) another storm occurred but in central and southern Illinois.
The fourth storm of the period focused on north-eastern Illinois, producing 10 inches at McHenry and more than 6 inches over 13,000 square miles of the state. Blizzard conditions existed north of a line from St. Louis to Danville with freezing rain to the south. This ranked as the fourth worst of the winter. During this 18-day stormy period, which ended with a 2-day storm on 26-28 January
cen-tered in south central Illinois, the accumulated snow was producing excessive damages. Roofs of garages, homes, and buildings were sagging and col-lapsing, particularly in the northern third of Illinois. Transportation was either stopped or minimal through this 18-day period, particularly in the northern half of Illinois. The state was truly a dis-aster area as record January low temperatures, averaging 14° F below normal, persisted throughout the month.
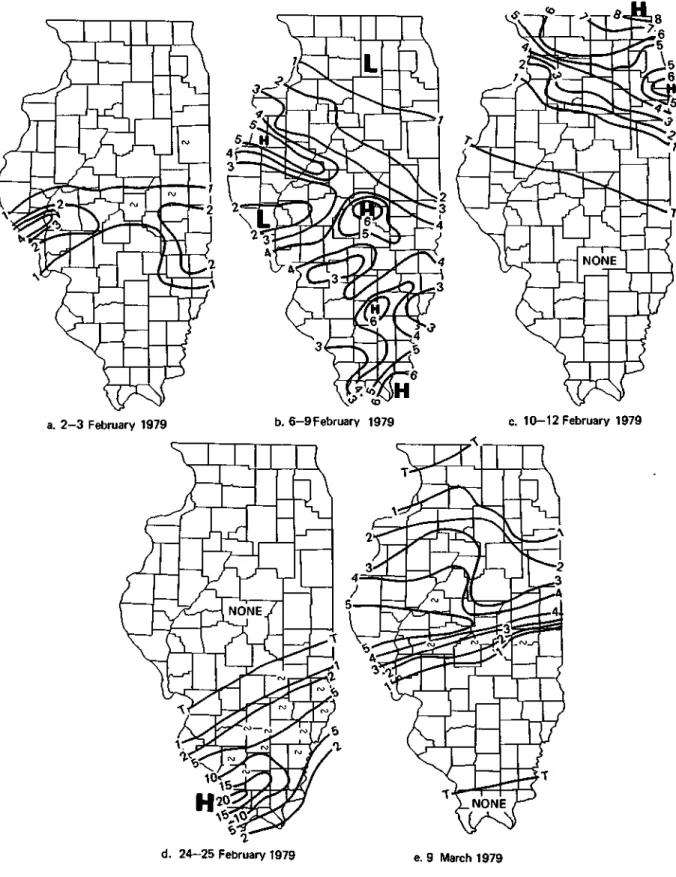
After this third stormy period, Illinois had five more severe winter storms which were scattered throughout February and early March. The only storm of consequence in this group was that of 24-25 February which struck extreme southern Illinois. A severe ice storm preceded the snowfall which produced up to 20 inches at Marion and Anna, and brought great damage to the extreme southern end of the state.
Some of the immediate impacts of the storms during this period are illustrated in figure 3. These headlines from papers in the northern, central, and southern parts of the state reveal the kinds of im-mediate problems the citizens and institutions of Illinois were experiencing during December and January. Counties in the northern third of Illinois were declared disaster areas by the Governor by mid-January, and southern Illinois counties were declared disaster areas after the late February storm. The combination of the heavy storms, particu-larly in northern Illinois, from early December through late January, coupled with the extremely cold temperatures in December, January, and Feb-ruary (which minimized snowmelt) resulted in record accumulations of snow depth. Snow depths greater than 24 inches and ranging up to 40 inches existed throughout the area north of the line from Galesburg to Kankakee in late January. These record depths exceeded prior records by 5 to 15 inches at most locales. The weight of the water exceeded design values on many structures producing
dam-ages resulting in leaks along wall lines and in some instances, collapse of the roofs. The snow cover lasted in northern Illinois from late November through mid-March ranking as the longest period of greater than 1 inch of snow on the ground in that area. In most areas of northern Illinois new records for depth of snow cover were set.
When all the aspects were considered (record 2-month cold, near record number of severe winter storms, and record depth of snow), the winter of 1978-1979 ranks the second worst in Illinois since detailed weather records began in Illinois in the 1880s. As a consequence, an in-depth investigation of the winter conditions of 1978-1979 was made. The first part of this report examines in detail the 17 severe winter storms, including an examina-tion of their magnitude, the storm moexamina-tion, the areal extent of the heavy snow, the time of occurrence, and the synoptic weather conditions that produced them. The discussion of the individual storms is followed by an assessment of the monthly and winter snowfall and snow depths. In the next sec-tion, detailed winter precipitation measurements in the Chicago area are presented. The final section of the report discusses the kinds of impacts noted during the winter.
A major reason for this study was to provide in-formation to those concerned with design and oper-ations affected by heavy snowfalls and snow depths. This includes most businesses and industry, trans-portation systems, and those governmental institu-tions that must deal with severe winter condiinstitu-tions.
Acknowledgments
Credit is due the Publications-Communications Unit of the Water Survey under the leadership of Loreena Ivens. In particular the assistance of John Brother and William Motherway in drawing the il-lustrations and of Marilyn Innes in producing the camera copy was helpful.
ANALYTICAL METHODS
The analysis of the individual storms began with the weather records of each station. Records from 80 stations in Illinois that report snowfall were used to plot "storm maps." This procedure was identical to that used to define winter storms in 1900-1960 (Changnon, 1969). These maps represented periods, ranging from a few hours duration up to 56 hours, during which the winter precipitation, snow and/or glaze, fell nearly continuously over all or parts of the state. At each station, the following information was plotted on individual storm maps: the begin-ning and ending times and dates, the amount of snowfall, the amount of precipitation, and the occurrence of other weather phenomena such as high winds, sleet, and glaze. These maps then be-came the basis for further analysis of the" storm.
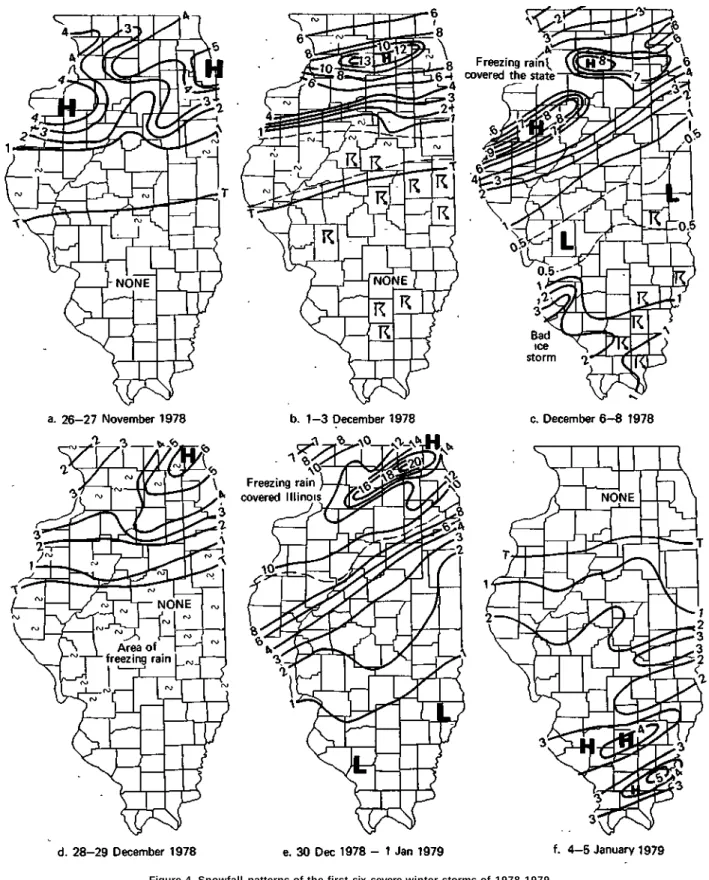
The beginning times were used to plot isochrones across the state, allowing determination of the di-rection in which the advancing storm moved. The times also allowed determination of the earliest beginning and latest ending times of the storm with-in the state. The begwith-innwith-ing and endwith-ing times at the stations in the heavier storm area (typically 5 to 10 stations) were used to develop and calculate, point durations, and these values were averaged to get a mean storm point duration. Isohyetals, based on the point snowfall values on each map, were con-structed to develop the storm snowfall pattern. The extent of areas greater than 3 inches and greater than 6 inches was determined by planimetering these maps. The highest and lowest snowfall values in each storm were also identified. Examples of the storm maps appear in figures 4, 5, and 6.
Snowfall totals for each month in the season were obtained from the climatological data for Illi-nois (EDIS, 1978, 1979). Monthly and seasonal maps were constructed from these values. These totals were compared with records for 50 Illinois stations distributed throughout the state and with records back to 1880 so as to determine the ranks of the 1978-1979 values. In a similar approach, the snow depth data taken at representative stations in northern, central, and southern Illinois were anal-yzed and compared with their historical records.
The Water Survey was operating a dense network of 71 recording raingages in the Chicago area during the winter of 1978-1979. These gages measured the amount of water in the snowfall. These data were used to develop precipitation maps for each month and for the "winter to examine, in detail, the pat-terns of precipitation in the Chicago region where the excesses of the winter were severe.
The variety and magnitude of impacts resulting from the severe winter conditions were studied. Damage information as reported in Storm Data (EDIS, 1979) was used. Much of the impact infor-mation came from study of Illinois newspapers published throughout the November 1978-January 1980 period. Emphasiswas placed on finding second order and tertiary impacts resulting many months after the storm ended. Absolute measures of the economic and human costs of the winter storms cannot be derived by this approach. However, the . information available presents a useful estimate of the types of impacts and some measure of their severity.
STORM ANALYSIS Storm Patterns
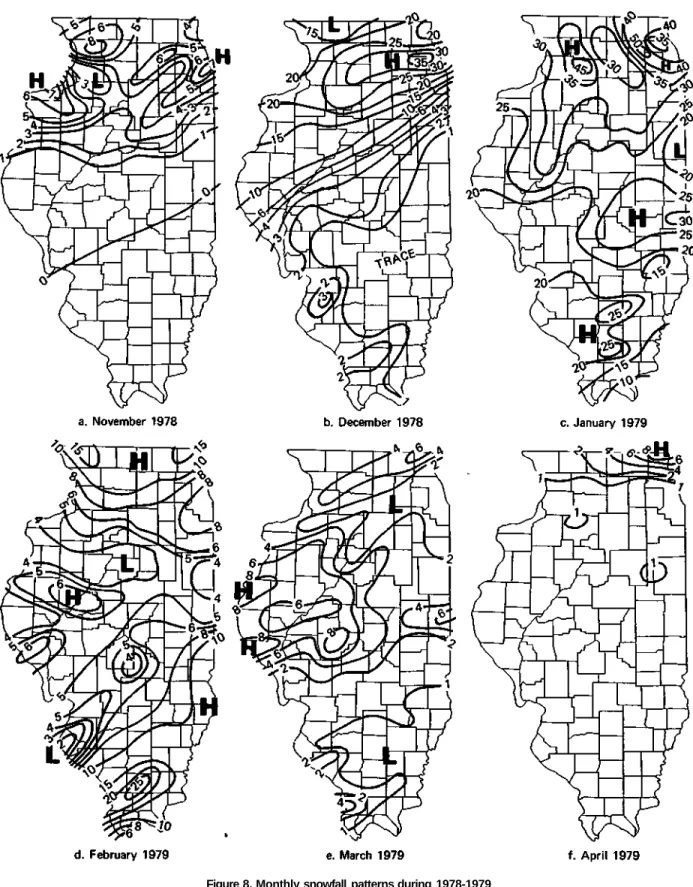
The patterns of the 17 severe winter storms of 1978-1979 are illustrated in figures 4-6. These show that one occurred in late November, four in December, seven in January, four in February, and one in March. Normally, severe winter storms in Illinois are a little more common in January with an average of slightly more than one (per year). The months of December, February, and March
(Changnon, 1969) average slightly less than one. The total of 17 during the winter of 1978-1979 was four times the average frequency and only one less than the prior record (18 storms in 1977-1978). Maximum values for each month prior to 1978-1979 included one storm in October, three in November, five in December, four in January (this record was broken in January 1979), four in February (this
record was tied in February 1979), and five in March. Hence, record monthly frequencies occurred in January and February with near record values in December. This reveals the prolonged and intense storminess that characterized the winter of 1978-1979.
Analysis of the 17 patterns reveals that effects of Lake Michigan to increase snowfall were ap-parent in at least three of the storms including those on 26-27 November, 28-29 December, and 11-14 January. Prior Water Survey studies (Changnon, 1969) revealed that lake effects to induce heavier snowfalls occur in extreme northeastern Illinois as a result of passage of low pressure areas to the south and east of Illinois. These conditions produce strong return flow from the northeast across Lake Michi-gan. The moister air from the lake is precipitated in the land area adjacent to the lake as the air is cooled and lifted.
Other interesting snowfall patterns were obvious in several storms when relatively narrow bands of heavy snowfall extended across the state. The dates of these storms are 1-3 December, 30 December-1 January, and 24-25 February.
Several of the lesser storms produced localized but very small areas of heavy snowfall, typically of 4 to 6 inches in localized areas of the state. In-cluded in this classification are storms of 4-5 Jan-uary, 20-21 JanJan-uary, 2-3 FebrJan-uary, and 6-9 Feb-ruary. These storms typically have shorter dura-tions than the other winter storms and are much less damaging, except in very localized areas.
Examination of the 17 storm maps reveals that in 14 of the 17 storms freezing rain occurred some-where in Illinois. It covered the entire state in three storm cases (6-8 December, 30 December-1 January, 18-19 January). Freezing rain was extremely bad in the storm of 6-8 December when it produced ice on wires ranging from ½ to 1 inch thick in the southern half of the state. Freezing rain was severe and quite damaging in east central Illinois on 1 Jan-uary, and also quite damaging in extreme southern Illinois on 24-25 February. However, none of the ice storms reached the severity of the storm of 24-25 March 1978.
Another interesting aspect of the storms relates to the occurrence of fog. Widespread fog occurred with 11 of the 17 storms. Fog was extremely dense and prolonged in three of the storms (28-29
Decem-ber, 18-19 January, 24-25 February). Typically the areas of fog were not in the heavy snow zones, but were located generally to the south in warmer air sectors. The fog compounded the transportation problems created by the snow and freezing rain and was an integral part of the total severity of the severe winter storms in Illinois.
An interesting situation relating to the 17 winter storms of 1978-1979 was the fact that high wind and blizzard conditions, which were typical in 8 of the 18 winter storms of the prior winter, occurred in only 3 of the 17 storms. Blizzard-like conditions existed over the northern half of Illinois on 11-14 January and in the same area again on 23-24 Jan-uary. A third blizzard struck on 24-25 February in southern Illinois. A lack of high winds, drifting snow, and blizzard-like conditions in the other storm periods suggests the lack of extremely deep low pressure centers in many storm cases. Of some interest is the fact that thunderstorms occurred in Illinois during the initial stages of three of the win-ter storms. Widespread thunderstorms occurred on 1-December, 6-7 December, and 24 February (in southern Illinois snow area only).
Several of the patterns on figures 4-6 reveal the more typical snow storm patterns found in the state. The typical severe winter storm in Illinois has its heaviest snow area oriented WSW-ENE lying across north central Illinois. Areas of the most fre-quent snow maximization, as based on prior study of 304 storms in the 1900-1960 period in Illinois, are in 1) the area from near Moline to Rockford, 2) the Chicago region, 3) the region from St. Louis to Urbana, and 4) in extreme southeastern Illinois. Interestingly, the locations of the cores of the 17 storms in the 1978-1979 winter revealed most max-imizations occurred in all four of these state centers. Very few of the 1978-1979 winter storms maxi-mized in western or central Illinois. In general, the
17-storm sample appears representative of the gen-eral distribution of heavy snowfall areas in severe winter storms of Illinois (Changnon, 1969).
Storm Characteristics
Table 2 presents for each storm its beginning time in Illinois and the ending time. The 17 storms be-gan during most hours of the day but 11 of the 17 began during nocturnal hours, 1800-0600 CST. This
Table 2. Storm Time and Motion Inventory
Begin End Average duration Direction Storm (hours) at locales from which
date Hour (CST) Locale Hour (CST) Locale with heaviest snow snow moved 26-27 Nov 1230 Galena 1500 Kankakee 24.7 NW
1-3 Dec 0200 Galena 0 2 0 0 Chicago 28.5 WNW 6-8 Dec 1800 Chester 2000 Brookport 26.0 SW 28-29 Dec 1530 Keithsburg 2400 Antioch 19.3 WSW 30 Dec-1 Jan 0500 Anna 2330 Chicago 26.8 SSW
4-5 Jan 1400 Quincy 1700 Shawneetown 15.1 NW 6-7 Jan 0500 Anna 1300 Albion 22.4 SW 11-14 Jan 1030 Quincy 0300 Chicago 56.0 WSW 18-19 Jan 2130 Gladstone 2400 Antioch 15.0 SW 20-21 Jan 2330 Anna 1800 Paris 6.4 SW 23-24 Jan 0500 M t . Carroll 1600 Peotone 24.2 W 26-28 Jan 1300 Jerseyville 1200 Newton, Paris 25.8 WSW
and Red Bud
2-3 Feb 1400 Rockport 1500 Marshall 7.0 W 6-9 Feb 1800 Brookport 0 7 0 0 Carmi 49.3 WSW 10-12 Feb 1900 Freeport 1900 Chicago, Kankakee 42.0 NW 24-25 Feb 1900 Grand Tower 1700 Flora, Fairfield 12.8 SSW
3 Mar 0100 Quincy 1900 Danville 12.0 W
nocturnal-focus differs from the historical storm distribution which shows maximization of- initia-tions between 0900 and 1400 CST.
The average point duration at locales within the heaviest snowfall areas, showing values ranging from 6.4 to 56.0 hours, is also listed for each of the 17 storms in table 2. The median duration of the 17 storms was 24.2 hours. Study of the 304 storms of the 1900-1960 period revealed a median point duration of 14.2 hours which is considerably less than that of the 1978-1979 sample. The median for the 18 severe winter storms of the prior winter, 1977-1978, was 18 hours. Essentially, the duration information for the 17 storms reveals that they were much longer lasting and typically heavier (point) snow producers than the average. This sug-gests slower moving synoptic weather conditions and/or more extensive snow areas which could result in greater point precipitation and potentially more damage". However, the lack of high wind con-ditions with most of the 1979 winter storms sug-gests the lack of extremely deep low pressure centers.
Also shown in table 2 is the direction which the storms moved across the state. The frequency by direction includes four storms from the WSW and four from SW, three from the west, three from northwest, two from the SSW, and one from WNW.
The preferred motion from WSW and SW shown in 1978-1979 winter storms is common to the motions found in many of the storms of the prior winter and in the 61-year storm sample.
Table 3 presents a summary of the snowfall with the 17 storms". Shown are the maximum and mini-mum point' amounts and the locale where they oc-curred. Examination of the lowest measurable values (those greater than a trace) reveals that only one storm had measurable snowfall over the entire state, 56,400 square miles (23-24 January). Five storms in the 1977-1978 winter produced measur-able snow over the entire state. In four storms of 1978-1979, more than 3 inches fell over 30,000 square miles or more. Interestingly, none of the three storms producing the highest point amounts, > 20 inches, produced snow over the entire state.
One of the interesting differences between the winter storms of 1978-1979 and those of the prior winter was the fact that three storms had point maximums greater than the highest achieved in the prior winter (15.5 inches). As noted previously in the text, however, very few of the storms of 1978-1979 came with high wind, blizzard conditions as opposed to eight in the prior winter. Furthermore, the median duration of the winter storms of 1978-1979 was 6 hours greater than that in the prior
Table 3. Storm Snowfall Summary
Highest state Lowest state Areal extent (square miles) values (inches) values (inches)
Storm date and locale and locale* ≥3 inches ≥6 inches 26-27 Nov 5.8 Chicago (Midway) 0 12,400 6,900
1-3 Dec 13.3 D i x o n 0 11,100 8,600 6-8 Dec 9.5 La Harpe 0 20,700 16,500 28-29 Dec 6.5 A n t i o c h 0 10,000 1,000 30 Dec -1 Jan 21.0 Marengo 0 30,000 23,000
4-5 Jan 5.0 Harrisburg 0 7,500 0 6-7 Jan 8.0 Carbondale 0 10,000 2,000 11-14 Jan 24.0 Barrington 0 43,000 31,000 18-19 Jan 6.0 Rockford 0 4,500 300 20-21 Jan 4.5 Paris 0 2,500 0 23-24 Jan 10.1 McHenry 1.1 Cairo 41,000 13,000 26-28 Jan 9.0 Highland T La Harpe 37,000 17,500
2-3 Feb 4.0 Griggsville 0 400 0 6-9 Feb 6.5 M t . Vernon T 27,000 1,500 10-12 Feb 8.0 A n t i o c h 0 10,500 4,200 24-25 Feb 21.0 Marion 0 12,000 7,700
9 Mar 5.9 Springfield 0 15,000 0 * If more than one locale, the place is not shown
winter. Thus, the "typical" storm of the 1977-1978 winter was one that was faster moving, shorter lived, with stronger wind conditions, more widespread snow, but with generally less heavy snow at a point. The storms of the winter of 1978-1979 were slower moving storms resulting in heavier point totals and with less intense low pressure areas. The point values in excess of 20 inches found in the storms of 30 December-1 January, 11-14 January, and 24-25 February were all record high storm totals at the locations where they occurred in northern and southern Illinois.
Also shown in table 3 are values for the areal ex tent of regions with more than 3 inches and more than 6 inches of snowfall for each storm. In six storms, snow in excess of 3 inches fell over more than one-third of Illinois; this is three less storms than the nine storms in this category during the prior winter of 1977-1978. In five storms about half of the state was covered by 3 inches or more of snow (as compared to six storms in the prior win ter). In one storm, that on 11-14 January, snow covered 77% of Illinois at a depth of 3 inches or more. Eight storms produced snowfall of 6 inches or more over more than 5000 square miles (about 10% of Illinois). In comparison, seven storms in the prior winter rated at this level. Thus, the
compari-son of the storms of the two winters based on the areal extent of their 3- and 6-inch snow areas shows reasonably similar characteristics. The most exten sive storms of the winter of 1978-1979, based on the areas of 6 inches or more snowfall, were those on 30 December-1 January, 11-14 January, and 26-28 January. In these three storms more than 30% of Illinois was covered by 6 inches or more snowfall. The basic synoptic weather type (cyclone and/or front) that produced each of the 17 severe winter storms was determined. These were categorized in six synoptic types (table 4) according to the typing derived from the study of 304 past winter storms in Illinois (Changnon, 1969). The first five are clas sified as to their source area, and in the case of the Colorado types, the general direction of travel of the track of the storm is also employed. Most mis cellaneous typings relate to frontal passages without any notable low center in or within a few hundred miles of Illinois . No obvious low center nor frontal passage existed in two of the winter storms of 1978-1979. Those storms developed as large regions of light snowfall over the snow-covered areas of the Great Plains and western Midwest that slowly moved eastward in a broad trough.
The frequency of the winter storms with each of these synoptic types is listed in table 4. Since one
Table 4. Synoptic Weather Types with Winter Storms
1978-1979 Storms Historical 1977-1978 frequency frequency Synoptic type Number Percent (percent) * (percent) 1 Alberta low 1 6 11 26 2 Colorado low 1 6 45 32
(south to north track)
3 Colorado low 4 22 8 0 (north track) 4 Colorado low 1 6 7 16 (south track) 5 Texas low 5 28 24 10 6 Miscellaneous 6 32 5 16 1 8 * * 100 100 100 * Based on 304 winter storms during 1900-1960
** There were 17, not 18, storms but in one storm (23-24 January 1979) two Colorado lows (north track and south-north track) occurred and a count was given to each
storm, that of 23-24 January, was produced by two types, a type 2 and type 3 condition, a count was given to each of those types in table 4 resulting in a total of 18 counts. The frequencies in each type are expressed as a percent of the total 18 events. Also shown in table 4 are two sets of percentages, one based on the historical frequencies of 304 storms for 1900-1960, the other for the 18 storms of the winter of 1977-1978. Comparison of the three sets of percentages helps reveal the unique characteristics of the storms of the winter of 1978-1979. For example, comparison of the 1978-1979 percentages with those of the historical sample re-veals that the recent winter had relatively more storms of type 3 (Colorado low with north track) and many more in the miscellaneous category. It should be noted that four of the six in the miscel-laneous category were related to stationary frontal situations, typically positioned just south of Illinois in a broad trough. Precipitation with these two types typically moves from the west and southwest, which is reflected in the predominance of storm motions shown' in table 2. The 1978-1979 winter had relatively fewer instances of storms with Alberta lows, and Colorado lows (south to north track) than occurred in the historical sample.
Comparison of the percentages for the 1978-1979 storms with the percentages for the prior winter (1977-1978) also shows marked differences between the two winters, as has been noted in many of the
storm characteristics such as duration, intensity, and area. The most recent winter had more type 3, type 5, and type 6 conditions than did the winter of 1977-1978.
The earlier climatological study of the 304 severe winter storms found that the Colorado low types 2 and 4 were primary producers of "extreme damage" storms, defined as those producing more than $200,000 in damages (1960 dollars) and one or more deaths in the state. The examination of the deaths and damages for the 17 storms in the 1978-1979 winter reveals that six of these storms were extremely damaging including that on 23-24 Jan-uary when two synoptic types were involved. The synoptic types with these bad storms included 23-24 January (type 2); 18-19 January and 23-24 January (both type 3); 6-8 December (type 4); and 30 Dec-ember-1 January, 11-14 January, and 24-25 Feb-ruary (type 5). It is notable that all of these six most severe storms occurred with lows (as opposed to miscellaneous types). Furthermore, the more damaging storms of 1978-1979 came with the Texas lows, type 5. This is a different result than found in the climatological sample which showed that types 2 and 4 were the most frequent producers of extreme damages in Illinois.
Examination of surface pressure patterns for the period of 26 November through 10 March 1979, which encompasses the 17 storms, revealed that 29 cyclones passed either across Illinois or adjoining
states. Twelve of the 29 cyclones, or 40%, produced severe winter storms in Illinois, a much higher ratio than the 10% noted in prior studies (Changnon, 1969). Thus, in one sense, the high frequency of severe winter storms and the resulting record snow-falls in the northern end of Illinois occurred because more of the winter cyclones in the Midwest, typical-ly those with north tracks, produced heavy snow and damaging storms in the state.
An extensive synoptic analysis of the storms was not pursued. However, the results from the analyses of storm characteristics and the synoptic conditions do indicate the key atmospheric ingredients. First, there was not a great frequency of high wind
con-ditions, with only 3 of the 17 storms having blizzard conditions as compared to 8 of the 18 in the prior winter. This indicates that most of the storm-pro-ducing conditions in the winter of 1978-1979 did not have excessively deep low pressure centers with-in the cyclones. However, the relatively long powith-int durations of the severe winter storms of the 1978-1979 winter and the record high point snowfall totals in several storms suggest that many of the cyclones and frontal systems were broad and slower-moving than normal. The greater frequency of type 3 (Colorado north track) and type 6 (miscel-laneous-stationary front) conditions reveals broad and shallow low pressure systems associated with or behind the southward penetrations of cold air.
SEVERITY OF THE WINTER CONDITIONS Snow Cover
The near record numbers of severe winter storms distributed throughout a 3½-month period begin-ning in late November 1978, coupled with long periods with below normal temperatures, particu-larly in northern Illinois, led to both prolonged ac-cumulations of snow on the ground and to great depths of snow cover.
Data from stations in northern, central, and southern Illinois were chosen to reflect the snow cover conditions. Those from four stations are shown on figure 7. Here, the height profiles of the daily recorded values of snow on the ground, or snow cover, for these stations are depicted. In northern Illinois the impacts of the late November-early December heavy storms are clNovember-early reflected as peaks on the graph followed by gradual lowering with rapid enhancement in late December and in mid-January. The sustained record cold tempera-tures of January and February kept melting at a low rate and snow depths at great heights. The ad-vent of snow storms during January in southern Il-linois brought snow cover there that persisted until midrFebruary.
As shown in figure 7, Mt. Vernon reached a snow cover maximum of 14 inches by late January, 2 inches below the record depth set in mid-January 1978. Urbana reached its maximum depth of 18 inches for several days from late January through
mid-February, but this too was 2 inches less than the prior record depth on the ground. Antioch achieved its maximum depth of 39 inches in mid-January, a value 16 inches above its all time record depth.
Thus, the maximum depths obtained were of record proportions in northern Illinois but slightly less than record levels in central and southern Illi-nois. The reasons for the considerable structural damage to roofs in northern Illinois were the great depth of snow and its prolongation.
The snow cover durations of the representative north, central, and southern stations are displayed in table 5. Shown are the longest consecutive runs of days (and the dates beginning and ending) for snow depths of 1 inch or more, 10 inches or more, and 20 inches or more. All of the consecutive dura-tion values for Antioch (shown in table 5) were new records, and the 31 consecutive days with snow depth greater than 10 inches in Urbana is also a new record. The other duration values shown in table 5 for Urbana (1 inch or more), and for Mt. Vernon are much below prior records, but much above normal.
Also shown in table 5 are the totals, not just for consecutive days, but for the total number of days of snow cover greater than 1 inch. For example, Antioch had a run of 116 days with snow cover
Figure 7. Height profiles of snow cover at four stations during 1978-1979 winter
Table 5. Snow Cover Statistics
Longest consecutive runs
Cover ≥20 inches Cover ≥ 10 inches Cover ≥ 1 inch Total days snow
Dates Total Dates Total Dates Total cover ≥1 from to days from to days from to days inch Antioch 1/12 2/23 43 1/1 3/13 72 11/27 3/22 116 120 (north) Urbana 0 1/23 2/22 31 1/1 3/3 62 70 (central) Mt. Vernon 0 1/26 2/3 9 1/21 2/15 26 48 (south)
with 1 inch or more (from 27 November through 22 March), but it also had another four days in March which collectively produced a total of 120 days greater than 1 inch. This is two days more than occurred there in the prior record winter of 1977-1978.
Monthly and Seasonal Snow Totals
November snowfall was relatively high through out the northern third of Illinois (figure 8a). Aver
age snowfall in that area for November ranges be tween 1.5 and 2 inches, and thus many locations had totals two or four times their averages. None of the values was a record high, however, although at most locations the November 1978 totals ranked as the third or fourth highest on record.
The December snowfall pattern (figure 8b) reflects the repeated occurrences of heavy snow storms in the northern third of Illinois, with more than 30 inches in a narrow east-west band. Compari son of December averages with the values on figure
8 reveals that totals in the northern third of the state were much above average, but values were average or below south of the 4-inch line. The snowfall totals north of the line from Moline to Kankakee to Chicago were at least four times the average December values, but were not record highs at many stations. The 20 inches at Ottawa ranked as the third greatest, and the 26 inches at Aurora ranked as the second heaviest snowfall on record. The 34.5 inches at DeKalb was the record highest at that location.
The January 1979 snowfall pattern (figure 8c) represents record high values throughout most of Illinois. The average January snow totals in Illinois vary from 3 inches in extreme southern Illinois to 8 inches in northern Illinois. The 1979 totals ranged from three to six times the averages in most parts of the state. The dimensions of the January 1979 snowfall are reflected by listing the values at several locations around the state and their prior records: Aurora with 32.6 inches in 1979 (32 inches in 1918) Bloomington-Normal with 24.6 inches (26.2 in 1918) Carbondale with 20.6 inches (19.2 in 1978)
Charleston with 25.8 inches (19.9 in 1904) Decatur with 25.0 inches (20.5 in 1918) Hillsboro with 20.0 inches (16.0 in 1904) Kankakee with 29.0 inches (25.7 in 1918) Ottawa with 30.5 inches (17.7 in 1934) Quincy with 19.5 inches (17.4 in 1940) Chicago with 40.4 inches (30 in 1978)
The February total snowfall pattern is revealed in figure 8d. Average values in Illinois range from 2 inches in the south to 8 inches in the north. Com-parison of the resulting average gradation with the pattern in February 1979 reveals large areas of Illi-nois with near average snowfall in the northern half of the state. However, much above average total February snowfalls occurred in the southern half of Illinois. The totals in the southern third of Illi-nois were three to five times their averages. The 15.1 inches at Carbondale was a record high, as was the 18.0 inches at Harrisburg.
The March snowfall pattern (figure 8e) shows the heaviest snowfalls occurred in central Illinois. The average March snowfall totals in extreme south-ern Illinois are 2 to 3 inches, becoming 3 to 4 inches in central Illinois, and 5 to 6 inches in northern Illi-nois. Thus, the totals in central Illinois, particularly in the western section, were 3 to 4 inches above
normal. However, none of the March totals in Illi-nois approached record proportions.
Figure 8f presents the total snowfall for April 1979. One storm in extreme northern Illinois re-sulted in the exceptionally high values near the Wisconsin border. April average snowfall in this area is 1.5 inches, but the 9.4 value at Antioch was not a record.
When one reviews the monthly snow results, one finds that in the northern fourth of Illinois, the monthly totals were above average in November, December, January, and February (four consecutive months) and were record highs in certain locales in December and at most locations in January.
Figure 9a presents the total snowfall for the wter (November 1978-April 1979). The frequent in-tensification of snow storms in the northern sector of Illinois is reflected in the pattern with more than 60 inches extending over this entire area. Average winter snowfall in Illinois typically varies from 10 to 15 inches in extreme southern Illinois, from 20 to 25 inches in central Illinois, and from 28 to 33 inches in northern Illinois. Hence, the totals shown in figure 9a reveal the winter snowfall was more than twice the average fall in northern Illinois and at some points three times the average. All locations in the area enveloped by 60 inches in figure 9a had new record seasonal snowfall totals. Much of the small area of extreme southern Illinois enveloped by the 3 5-inch line also had new record totals. Here also, the snowfall totals were two to four times the average. Generally, the seasonal snowfall totals in central and south central Illinois were 5 to 20 inches above normal, but were not record values. Prior winters with greater totals in these locations in-cluded 1911-1912, 1917-1918, 1959-1960, and 1977-1978.
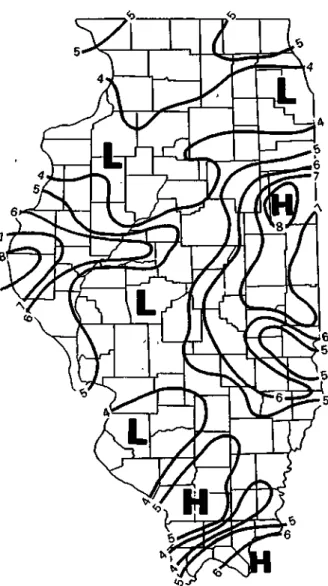
Figure 9b presents the pattern based on the point frequencies of freezing rain events during the winter of 1978-1979. One finds that the greatest frequency occurred in central Illinois where some points like Quincy and Watseka had eight storms with freezing rain. Prior studies of winter storms (Changnon,
1969) show that the area of greatest frequency of severe ice storms in Illinois extends across central Illinois with an average of five to six days per year. Lesser frequencies of freezing rain occurred in northern Illinois, and secondary high incidence areas (greater than five storm events with freezing rain) occurred in extreme southeastern Illinois.
Figure 9. Patterns of total snowfall and freezing rain in winter of 1978-1979
CHICAGO AREA PRECIPITATION
The severity of the 1978-1979 winter was greatest in the northern fourth of the state, with the heaviest snowfall totals found in and within 60 miles of Chicago. This record winter, in terms of snowfall, snow depth, and cold temperatures, had enormous impacts on every facet of human life and the envir-onment in this area.
Because of the severity of the Chicago winter and its implications on structural design and opera-tions of various transportation and institutional facilities, a study was made of the precipitation in
the three winter months when the snowfall was heaviest (December-February) and when most damages occurred. • Statistics from the Chicago National Weather Service Office at Midway Airport are presented in the Appendix. These give the daily values of snowfall, snow depth, maximum and min-imum temperatures, and wind speed and direction for the December through March period. These should be useful for those wishing to identify and study specific snowfall events and winter conditions in the city. Figure 7 shows the snow depth curve at
Chicago Midway. It remained above 1 inch from 24 November through 5 March attaining a maximum of 29 inches on 14 January and remaining above 20 inches until 22 February.
The State Water Survey began operations of a dense raingage network in the Chicago area in 1976 (Changnon and Semonin, 1978). This network was installed to collect precipitation data to serve a variety of applications. The advent of the heavy precipitation, largely in the form of snow, during December, January, and February of 1978-1979 offered an opportunity to examine in detail the monthly and seasonal precipitation patterns in the area. Figure 10 presents the monthly and the 3-month total precipitation values from this dense raingage network. Also presented are data from the available National Weather Service raingages, along with their total snowfall amounts in inches.
In general, each of the monthly-maps indicates two features. One is the presence of a band of in-creased snowfall 3 to 10 miles inland from the lake, and generally parallel to the lake shore. It extends from the north side of the network and through the network to the southeast side. This presumably reflects lake effects on the atmosphere which tend to aid in the production of snowfall under certain water-wind regimes. The other feature on all
month-ly maps is an extension of high values westward from the network. This appears in different areas (NW in December, WE in January, and SW in Feb-ruary) and reflects positions of E-W oriented storm cores.
Since the winter snowfall in the area was a record, the values and patterns of figure 10 should serve as future extreme design values for snowfall and snow-loading in the Chicago region. The total 3-month precipitation pattern (figure 10d) shows the maxi-mization belt inland and generally parallel to the lake with amounts 10 to 25% more than elsewhere. It is important to note the position of the two National Weather Service stations in Chicago (Mid-way and O'Hare) with respect to the pattern. The historical" snowfall records of Chicago were col-lected since 1855 in a series of three locations: 1) in the central business district (the Loop) from 1855 to 1926, 2) at the University of Chicago campus from 1926 through 1942, and 3) at Midway Airport" since 1942. Thus, the "design snowfall values" of Chicago have actually come from three different locations, and the snow and precipitation patterns of the severe winter of 1978-1979 suggest that the first two locations (shown on figure lOd) are samples of different snowfall regimes, at least in severe winter conditions.
IMPACTS OF STORMS
The near-record number of 17 severe winter storms of 1978-1979 and the ensuing record (or near-record) seasonal totals, the prolonged deep snow cover, and record low January and February temperatures produced an unbelievable myriad of socio-economic impacts in Illinois. Most of these were of a detrimental nature, although some pre-sented advantages to certain groups and institutions. Many of the worst impacts occurred in the northern fourth of Illinois where the winter snowfall, snow depths, and temperatures were new extremes since record keeping began at many places in that area in the 1880s. Many of the impacts were most seri-ous in the Chicago metropolitan area because of the locally great concentration of population, trans-portation networks, business, industry, and other facilities. In such metropolitan areas, severe
pro-longed weather over a few days tends to produce a "domino effect" in that, when one system fails, others are likely to be hurt or to fail, or to be af-fected in some way.
Major Impacts
Major impacts were initially felt in metropolitan-oriented transportation systems. These included blockage and halting of surface transportation (in-volving both trains and vehicles) and stoppage of air transportation. In essence, the transportation problems led to a series of secondary impacts related to the change in human and commercial activities because of delays or cancellation of transportation systems. The absenteeism from employment, lack of deliveries, lack of shopping, and cancelling of
meetings and vacations had subsequent effects on commerce and industry. The problems were com-pounded in another series of major secondary, or ensuing, impacts on government institutions in-volved with snow removal, street repair, delivery of mail, and fire fighting.
Another major set of direct impacts of the severe winter related to structures. Here, damages to roofs were a notable problem. These led to secondary im-pacts on human activities, personal losses, costs to individuals and businesses, and subsequently more business for repair companies.
Public utilities formed another area of initial im-pacts. The severity of the storms, although not as bad in 1978-1979 as in the prior winter (because of fewer severe ice storms and blizzards), led to im-pacts on the utility companies as reflected by dam-age to their lines, poles, and structures. The intense cold also brought record consumption of electricity and natural gas, which ultimately led to a myriad of secondary and tertiary impacts, including utility requests for rate increases in 1980.
This discussion of impacts is largely focused on those that occurred during the severe winter. Fur-thermore, much of the information available is based on data for the Chicago region. However, the collection of information about "tertiary" impacts, those occurring months and up to a year after the winter, allowed a description of those identified. It should be noted that a detailed quantification of the losses and benefits was not attempted. It would be practically impossible to calculate accurately the economic costs and limited benefits of the 1978-1979 winter to Illinois citizens, businesses and industries, and our government institutions. It seems likely that the costs were well in excess of $1 billion.
Table 6 presents a list of identified impacts that have been grouped and sorted into 10 categories, excluding deaths and injuries. As noted earlier, these came largely from a study of newspaper accounts of the storms and their aftermath, although data were also extracted from Storm Data (EDIS, 1979). Accounting of deaths and injuries attributable to the winter is extremely difficult. Ten deaths could be clearly identified as due directly to winter con-ditions, and this does not include the potential murders that Chicago police considered to be due to domestic quarrels related to the severe winter and prolonged enclosure. This total of 10 deaths
does not agree with one news story found in a Mid-western newspaper in mid-January 1979 which in-dicated that "nearly 50 had died" in Illinois. Deaths relating to heart attacks, and "after effects" related to pulmonary and heart problems in the succeeding months are not known.
However, it seems likely that there were fewer deaths in this winter than in the prior winter of 1977-1978. In that winter, with more major ice storms and more severe blizzards, many more were killed in highway type accidents or frozen in stalled vehicles than in the 1978-1979 winter. Our limited records indicate that there were at least 60 people injured seriously during the 1978-1979 winter, primarily in the storms of 11-14 January, 23-24 January, 2-3 February, and 24-25 February. From a death and injury standpoint, the storm of 11-14 January in the Chicago metropolitan area was the worst. Five people were killed (one hit by a snow-plow, one slipped and fell in front of a train, one lineman fell, and 2 people died of heart attacks), and at least 15 major injuries occurred largely be-cause of falling or overwork.
Table 7 presents several tertiary or delayed im-pacts relating to events that occurred from 1 month up to 1 year after the severity of the 1978-1979 winter had ended. These are illustrated in figure 11. Many relate to expenditures for equipment and supplies in anticipation of future severe winters. Probably one of the major perceived impacts of the winter was the ultimate shift in the political lead-ership of the city of Chicago. The administration during the winter of 1978-1979 was perceived as lax in having the city equipped to deal with the record winter storm. The aggravated suffering of the city and suburban dwellers was considered a major factor in the election of a new mayor later in 1979. This mayoral shift represents one of the de-layed, but major institutional impacts of the severe winter.
Summary of Impacts
Many of the impacts noted in the winter of 1978-1979 which were based largely on happenings in the Chicago urban area were also noted in the win-ter of 1977-1978 (Changnon and Changnon, 1978). However, it appeared that the statewide problems,
Table 6. Assorted impacts of the Severe Winter of 1978-1979
7. Transportation Systems and Vehicles
Public transportation
Suburban and in-city buses
Stopped in the metropolitan area of Chicago Often many hours late
Several wrecks and many stuck and abandoned Trains
Chicago transit delayed by snow and broken wheels caused by cold temperatures Rails and switch yards frozen, cracked, and broken
Several CTA lines and suburban rail lines closed, in somes cases because of ice cover on electrical rails
Commuter trains delayed
In February two trains collided because of poor visibility
Chicago and Northwestern transportation company lost $30 million and Federal government agreed to pay up to half, but the railroad and its customers ended up paying over $10 million
Airlines
O'Hare Airport closed 96 hours in January (13-15 January) Losses to airlines estimated in the millions of dollars
Airlines paid for housing for up to 5000 people per night during storm-caused delays Luggage deliveries delayed by several days
Other Transportation
Mail trucks delayed 2 to 4 days because of road conditions Food trucks delayed and perishable food lost
Fire trucks unable to get through city streets because of snow and stalled cars, leading to 1 death and 23 injuries in one Chicago apartment fire
Barge traffic on the Mississippi and Illinois Rivers stopped from mid-January until March as far south as Peoria
Street and highway deterioration caused delays and damages
Delivery of livestock to market reduced and prices rose because empty freight cars were snowbound in Chicago freight yard
2. Utilities
Power lines were down in southern Illinois in February Telephones were out for several days in southern Illinois One repairman fell from a utility pole and died
3. Commercial and Industrial Establishments
50 commercial buildings in Chicago collapsed due to snow on roof (12-14 January) $200 million in payrolls lost (11-16 January in Chicago)
$1 billion lost in sales (11-16 January in Chicago) Garbage trucks helped remove snow in major storms Restaurants lost food business estimated at 60% for 30 days Display windows were broken and merchandise stolen Dairys could not get milk and farmers had to dump it
One Chicago area roofing firm received 500-1000 calls a day in last two weeks of January with 80% reporting leaking home and apartment roofs
Quote of president of one roofing company in a Chicago suburb from late January: "We have been getting 75 to 100 calls a day on collapsed roofs, cracks and severe de-pressions, with many problems due to thermal shock (warming and freezing repeatedly leads to splitting and cracking). Costs of repair range from $ 2 0 0 to $4,000 per home. Usually we have 70 people on emergency work, but now we have about 150. Company is working 18 hours a day, 7 days a week. In 1967 it was not as serious. Advice to those with a leak, 'Punch a hole in the ceiling and let water come through. It is easier to repair than a caved-in ceiling'."
Many factories had to close
Hotel rooms were largely empty (10 to 20% filled)