• UK short-term interest rate expectations implied by the forward curve declined a little over the
review period, following the release of the August 2014
Inflation Report
.
• Euro-area short-term interest rates fell relative to their UK counterparts, reflecting a combination
of loosening of monetary policy by the ECB and weaker-than-expected economic data.
• Sterling rose early in the review period, briefly reaching a new post-crisis high. The currency
subsequently depreciated, broadly consistent with moves in international interest rates.
• Geopolitical risks remained a key concern for market participants and contributed to a brief
sell-off in risky assets, although much of this subsequently unwound.
Markets and operations
Overview
UK short-term interest rate expectations implied by the forward curve declined a little over the review period. Much of that change came following the release of the August 2014 Inflation Report, which contacts suggested had indicated a more accommodative stance than anticipated by many market participants.
Euro-area short-term rates fell relative to their sterling counterparts, reflecting, in part, the loosening of monetary policy announced by the European Central Bank (ECB) at its June meeting. Contacts also attributed the decline to a further deterioration in euro-area growth prospects and falling inflation expectations. These developments were perceived to have increased the likelihood that the ECB would take additional easing measures, perhaps via outright asset purchases. After the end of the review period, the ECB cut all three of its policy rates further and announced asset-backed securities and covered bond purchase programmes.
International long-term bond yields continued to decline. While the reasons for this remain unclear, contacts cited a number of plausible factors including lower expectations for policy rates, a lack of supply at longer tenors, liability-driven
investors shifting assets from equities into bonds, and a flight to quality resulting from geopolitical tensions. The fall in yields was largest in the euro area, which contacts thought was a result of weaker growth expectations compared with other major developed economies.
Sterling rose over the review period as a whole, particularly versus the euro. The moves were broadly consistent with changes in differences in international interest rates. After rising to its highest level since 2008, the sterling ERI declined towards the end of the review period.
Geopolitical risk associated with tensions in Ukraine and conflicts in parts of the Middle East continued to cause sporadic periods of heightened risk aversion among financial market investors. There was a brief sell-off in some risky asset markets in July, which was particularly marked in the US high-yield corporate bond market. While much of this movement subsequently reversed, the level of US high-yield corporate bond spreads remained somewhat higher than earlier in the year. In contrast, while there was a brief sell-off in equities, the S&P 500 subsequently reached new all-time nominal highs. European equities also recovered, albeit to a lesser degree.
In discharging its responsibilities to ensure monetary and financial stability, the Bank gathers information from contacts across a range of financial markets. Regular dialogue with market contacts provides valuable insights into how markets function, and provides context for the formulation of policy, including the design and evaluation of the Bank’s own market operations. The first section of this article reviews
developments in financial markets between the 2014 Q2
Quarterly Bulletinand 29 August 2014. The second section goes on to describe the Bank’s own operations within the Sterling Monetary Framework.
Monetary policy and interest rates
Sterling short-term interest rate expectations implied by the forward curve fell a little during the review period (Chart 1). In particular, there was a fall in UK forward interest rates with maturities of between three and five years, suggesting a slight slowing in the expected pace of policy tightening.
While there was some volatility in interest rates following communications on monetary policy during the review period, at the data cut-off, sterling short-term interest rates were close to the level implied by forward rates in December 2013 (Chart 2).
On 5 June, the European Central Bank (ECB) announced a package of monetary stimulus measures. The ECB lowered all three of its policy rates (including setting a negative deposit facility rate); it reaffirmed guidance that interest rates will remain at present levels for an extended period of time; it suspended sterilisation of the Securities Market Programme and extended fixed-rate tender procedures with full allotment at least up to 2016; and it announced plans to intensify preparatory work related to outright purchases of asset-backed securities. In addition, the ECB announced a series of targeted longer-term refinancing operations (TLTROs) that will offer participating banks a cheaper source
of funding than that available in markets. Contacts expect participation in the September and December TLTROs to be high, and euro money market rates declined around the ECB’s announcement (Chart 3).
Euro-area growth prospects continued to deteriorate, and market expectations of medium-term inflation expectations, measured by five-year inflation swaps, five years forward, fell around 15 basis points in the first half of August (Chart 3). Comments by ECB President Draghi at the annual conference of central bankers at Jackson Hole were perceived by contacts to have increased the likelihood that the ECB would announce further loosening of monetary policy. And there was both a fall in euro-area short-term interest rates and a rise in inflation expectations following the speech (Chart 3). After the end of the review period, the ECB cut its main policy rates again and
0.0 0.1 0.2 0.3 0.4 0.5 0.6 0.7 0.8 0.9 1.0
Dec. Feb. Apr. June Aug. Per cent 2013 14 Governor’s Mansion House speech August Inflation Report Previous Bulletin
Sources: Bloomberg and Bank calculations. (a) Spot rates derived from the Bank’s OIS curves.
(b) Dashed line shows the expected path of the one-year OIS rate, implied by the OIS forward curve at the start of December 2013.
Chart 2 One-year spot OIS rates versus market
expectations in December 2013(a)(b)
0.5 0.0 0.5 1.0 1.5 2.0 2.5 3.0 3.5 2014 15 16 17 18 19 Per cent Dashed lines: 29 May 2014
Solid lines: 29 August 2014
Euro US dollar
Sterling
– +
Sources: Bloomberg and Bank calculations.
(a) Instantaneous forward interest rates derived from the Bank’s OIS curves.
Chart 1 Instantaneous forward interest rates derived
from overnight index swap (OIS) contracts(a)
1.8 1.9 2.0 2.1 2.2 0.05 0.00 0.05 0.10 0.15
May June July Aug. One-year spot euro OIS rate
(right-hand scale)
Five-year euro inflation swap rate, five years forward (left-hand scale)
June ECB meeting
Draghi’s speech at Jackson Hole Per cent Per cent 2014 + –
Sources: Bloomberg and Bank calculations.
(a) Spot and forward swap rates derived from the Bank’s OIS and inflation swap curves.
Chart 3 One-year spot euro OIS rates and five-year
announced a programme of asset-backed securities and covered bond purchases to start in October 2014. International long-term interest rates continued on the downward path observed since the start of the year (Chart 4). Contacts pointed to a number of contributory factors, including lower expectations of the pace of increase in policy rates and their ultimate long-term levels, a shift from equities into bonds by liability-driven investors, a flight to quality resulting from geopolitical tensions, declining term premia and reserves accumulation by foreign central banks.
Foreign exchange
Sterling ended the review period about 1% higher than at the start, with the ERI reaching its highest level since 2008 in July (Chart 5). The majority of the rise in sterling was driven by an appreciation against the euro, consistent with the broad direction of changes in international interest rates.
Market contacts thought that in recent years investors had become more focused on short-term interest rate differentials. And foreign exchange strategists continued to expect sterling to decline further over the second half of 2014, based in large part on their view that US short-term interest rates would increase relative to sterling rates over the coming months. Foreign exchange (FX) strategists thought that central bank liquidity and forward rate guidance had lessened the scope for speculative activity in FX markets. Consistent with this, contacts reported that activity in FX markets had been relatively subdued in recent months. And, indeed, volumes data indicated that, broadly speaking, flows had been unseasonably low since the spring. The low level of activity was thought by contacts to be one of the drivers behind recent declines in volatility in the FX market, with implied volatility in several G10 currency pairs reaching pre-crisis lows.
Corporate capital markets
There was a brief sell-off in risky asset markets from the beginning of July to the end of August. In part, that was thought to reflect rising concerns about geopolitical tensions in Iraq and Gaza, as well as the ongoing conflict between Russia and Ukraine.
The pull-back was particularly evident in the US high-yield corporate bond market, where contacts had noted for some time that assets looked expensive. Initial moves that began in early July were given added impetus following Federal Reserve Chair Janet Yellen’s comment in mid-July that valuations looked ‘stretched’. There were significant outflows from high-yield bond and exchange-traded funds during July and the beginning of August (Chart 6), equating to around 6% of total net assets. And US high-yield bond spreads increased by around 90 basis points from their recent low. But the sell-off did not appear to precipitate forced asset sales by fund managers, and much of the increase in yields subsequently unwound. There were broadly similar moves in spreads in euro and sterling-denominated markets (Chart 7).
The sell-off in risky asset prices was, to a lesser extent, also evident in developed equity markets. The S&P 500 fell by 4% between 24 July and 7 August, for example. While the S&P 500 recovered those declines and reached all-time nominal highs, European stocks remained lower than at the start of the review period, with the Euro Stoxx 50 down by 3% (Chart 8). Contacts attributed this decline to a combination of factors, including weak euro-area activity and the risk of spillovers to Europe from tensions in Ukraine. Implied volatility in equity markets across advanced economies picked up slightly at the end of July as the sell-off in risky asset markets became most pronounced, but has since fallen back to near-record lows (Chart 9).
Chart 4 Selected five-year government bond yields,
five years forward(a)
0 1 2 3 4 5
Jan. Apr. July Oct. Jan. Apr. July Per cent Previous Bulletin United Kingdom United States Germany 2013 14
Sources: Bloomberg and Bank calculations.
(a) Forward yields derived from the Bank’s government liability curves.
Chart 5 Selected exchange rate indices
97 98 99 100 101 102 103 104
Jan. Feb. Mar. Apr. May June July Aug. Indices: 29 May 2014 = 100 Sterling ERI US dollar ERI Euro ERI Previous Bulletin 2014
The buoyancy of the UK initial public offering (IPO) market persisted into the start of the review period. During June there were fifteen UK IPOs worth a total of US$9.5 billion. As a result, the second calendar quarter of 2014 saw deals worth a total of US$14.4 billion — the largest quarterly total on record (Chart 10). European and US IPO markets were also buoyant, although activity in all three slowed as usual during the quieter summer months, and perhaps also as a consequence of the uptick in volatility in risky asset markets.
Bank funding markets
Primary issuance of both senior unsecured and covered bonds by UK banks was relatively strong at the beginning of the review period compared with a year earlier (Chart 11). In line with usual seasonal patterns, issuance slowed in July and August. European banks also continued to issue significant volumes of senior unsecured debt in public markets (Chart 11). 0 100 200 300 400 500 600 700 High-yield corporates (sterling)
High-yield corporates (US dollar)
High-yield corporates (euro)
Previous Bulletin
Basis points
Jan. Apr. July Oct. Jan. Apr. July
2013 14
Sources: BofA Merrill Lynch Global Research and Bank calculations.
Chart 7International corporate bond option-adjusted
spreads
Chart 9 Three-month forward option-implied volatility
in equity markets 0 10 20 30 40 50 60 70 2006 07 08 09 10 11 12 13 14 Euro Stoxx 50 S&P 500 FTSE 100 Previous Bulletin Per cent 80 Source: Bloomberg. 0 10 20 30 40 50 60 70 80 90 0 2 4 6 8 10 12 14 16 Deal value (right-hand scale)
Deal count (left-hand scale)
US$ billions Number of deals
2004 05 06 07 08 09 10 11 12 13 14(a)
Source: Dealogic. (a) Data up to 29 August 2014.
Chart 10 Total value and number of initial public
offerings by UK firms 10 0 10 20 30 40 50 60 70 80 90 100 2008 09 10 11 12 13 14 United States Western Europe US$ billions + –
Sources: Emerging Portfolio Fund Research and Bank calculations. (a) Cumulative flows since January 2008.
Chart 6Cumulative cash flow into dedicated high-yield
bond funds since 2008(a)
Chart 8 International equity indices(a)
85 90 95 100 105 110
Jan. Feb. Mar. Apr. May June July Aug. DJ Euro Stoxx FTSE All-Share S&P 500 2014 Previous Bulletin Indices: 29 May 2014 = 100
Sources: Bloomberg and Bank calculations. (a) Indices are quoted in domestic currency terms.
In the secondary market, spreads on UK bank debt remained low, and there was only a limited impact on European banks’ senior unsecured funding costs arising from the various market worries over the period (Chart 12). Indeed, European bank funding costs ended the period broadly in line with those for UK and US institutions, having been some way above them since around the middle of 2012.
In contingent capital markets there was a pickup in spreads on additional Tier 1 instruments. Contacts thought that this was associated with the broader sell-off in riskier assets, precipitated largely by heightened geopolitical concerns.
Operations
Operations within the Sterling Monetary Framework and other market operations
This section describes the Bank’s operations within the Sterling Monetary Framework (SMF) over the review period, and other market operations. The level of central bank reserves is determined by (i) the stock of reserves injected via the Asset Purchase Facility (APF); (ii) the level of reserves supplied by operations under the SMF; and (iii) the net impact of other sterling (‘autonomous factor’) flows across the Bank’s balance sheet.
Operational Standing Facilities
Since 5 March 2009, the rate paid on the Operational Standing Deposit Facility has been zero, while all reserves account balances have been remunerated at Bank Rate. As a consequence, average use of the deposit facility was £0 million in each of the May, June and July maintenance periods. Average use of the lending facility was also £0 million.
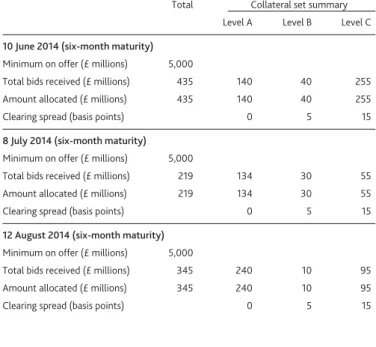
Indexed Long-Term Repo open market operations The Bank conducts Indexed Long-Term Repo (ILTR) operations as part of its provision of liquidity insurance to the banking system. These typically occur once every calendar month. During the review period, the Bank offered a minimum of £5 billion via six-month ILTR operations on 10 June, 8 July and 12 August 2014 (Table A).
Over the quarter, and in line with recent quarters, the aggregate level of reserves supplied by the Bank through quantitative easing (QE) remained in excess of the level that would otherwise be demanded by market participants. Usage of the facility therefore remained limited (Chart 13).
Contingent Term Repo Facility
The Contingent Term Repo Facility (CTRF) is a contingent liquidity facility, designed to mitigate risks to financial stability arising from a market-wide shortage of short-term sterling liquidity.(1) The Bank judged that in light of market conditions,
CTRF auctions were not required in the review period.
Discount Window Facility
The bilateral on-demand Discount Window Facility (DWF) is aimed at banks experiencing a firm-specific or market-wide shock. It allows participants to borrow highly liquid assets in return for less liquid collateral in potentially large size and for a variable term. The average daily amount outstanding in the DWF in the three months to 31 March 2013, lent with a maturity of more than 30 days, was £0 million.
0 20 40 60 80 100 120 140 160 0 2 4 6 8 10 12 14 16
Jan. Feb. Mar. Apr. May June July Aug. Sep. Oct. Nov. Dec. € billions UK senior unsecured 2014 (right-hand scale)
UK senior unsecured 2013 (right-hand scale) EU excluding UK senior unsecured 2014 (left-hand scale) EU excluding UK senior unsecured 2013 (left-hand scale)
€ billions
Sources: Bloomberg and Bank calculations.
Chart 11 Senior unsecured bond issuance by UK and
European (excluding UK) lenders in public markets
Previous Bulletin 0 50 100 150 200 250 300 350 400 450
Jan. May Sep. Jan. May Sep. Jan. May Sep. Jan. May United Kingdom(d)
United States(b)
Europe(c)
Basis points above mid-swaps
12 13 14
2011
Sources: Bloomberg, Markit Group Limited and Bank calculations.
(a) Constant-maturity unweighted average of secondary market spreads to mid-swaps of banks’ five-year senior unsecured bonds, where available. Where a five-year bond is unavailable, a proxy has been constructed based on the nearest maturity of bond available for a given institution and the historical relationship of that bond with the corresponding five-year bond.
(b) Average of Bank of America, Citi, Goldman Sachs, JPMorgan Chase & Co., Morgan Stanley and Wells Fargo.
(c) Average of Banco Santander, BBVA, BNP Paribas, Crédit Agricole, Credit Suisse, Deutsche Bank, ING, Intesa, Société Générale, UBS and UniCredit.
(d) Average of Barclays, HSBC, Lloyds Banking Group, Nationwide, Royal Bank of Scotland and Santander UK.
Chart 12 Indicative senior unsecured bank bond spreads(a)
(1) Further details are available at
Other operations
Funding for Lending Scheme
The Funding for Lending Scheme (FLS) was launched by the Bank and HM Treasury on 13 July 2012. The initial drawdown period for the FLS ran from 1 August 2012 until 31 January 2014, and the drawdown period for the FLS extension opened on 3 February 2014 and will run until 30 January 2015. The quantity each participant can borrow in the FLS is linked to its performance in lending to the UK real economy, with the incentives skewed towards supporting small business lending.(1)
The Bank publishes quarterly data showing, for each group participating in the FLS extension, the amount borrowed from the Bank and the net quarterly flows of lending. During the three months ending 30 June 2014, nine of the 36 groups participating in the FLS extension made drawdowns totalling £3.2 billion. Participants also repaid £0.8 billion from the first stage of the FLS. This took outstanding aggregate drawings under the Scheme to £45.7 billion.(2)
US dollar repo operations
Since 11 May 2010, in co-ordination with other central banks, the Bank has offered weekly fixed-rate tenders with a
seven-day maturity to offer US dollar liquidity. On 12 October 2011, the Bank also introduced US dollar tenders with a maturity of 84 days.
On 24 January 2014 the Bank, in co-ordination with other central banks, announced that in view of the improvement in US dollar funding conditions and the low demand for US dollar liquidity-providing operations, the longer-term US dollar repo operations would be phased out. Monthly 84-day operations ceased on 23 April 2014. The current timetable for the seven-day operations will continue until further notice. The network of bilateral central bank liquidity swap arrangements provides a framework for the reintroduction of US liquidity operations if warranted by market conditions.(3) There was no
use of the Bank’s US dollar facilities during the review period. Bank of England balance sheet: capital portfolio The Bank holds an investment portfolio that is approximately the same size as its capital and reserves (net of equity holdings, for example in the Bank for International
Settlements, and the Bank’s physical assets) and aggregate cash ratio deposits (CRDs). The portfolio consists of sterling-denominated securities. Securities purchased by the Bank for this portfolio are normally held to maturity, though sales may be made from time to time, reflecting, for example, risk or liquidity management needs or changes in investment policy. The portfolio currently includes around £5 billion of gilts and £0.4 billion of other debt securities.
Asset purchases
As of 31 August 2014, outstanding asset purchases financed by the issuance of central bank reserves under the APF were £375 billion, in terms of the amount paid to sellers. There were no asset purchases, sales, or maturities over the review period.
(1) Further details are available at
www.bankofengland.co.uk/markets/Pages/FLS/default.aspx. (2) Further details are available at
www.bankofengland.co.uk/markets/Pages/FLS/data.aspx. (3) Further details are available at
www.bankofengland.co.uk/markets/Documents/marketnotice140124.pdf.
Table A Indexed Long-Term Repo operations
Total Collateral set summary
Level A Level B Level C
10 June 2014 (six-month maturity)
Minimum on offer (£ millions) 5,000
Total bids received (£ millions) 435 140 40 255
Amount allocated (£ millions) 435 140 40 255
Clearing spread (basis points) 0 5 15
8 July 2014 (six-month maturity)
Minimum on offer (£ millions) 5,000
Total bids received (£ millions) 219 134 30 55
Amount allocated (£ millions) 219 134 30 55
Clearing spread (basis points) 0 5 15
12 August 2014 (six-month maturity)
Minimum on offer (£ millions) 5,000
Total bids received (£ millions) 345 240 10 95
Amount allocated (£ millions) 345 240 10 95
Clearing spread (basis points) 0 5 15
0 10 20 30 40 50 60 70 0 1,000 2,000 3,000 4,000 5,000 6,000
Jan. Apr. July Oct. Jan. Apr. July Oct. Jan. Apr. July Oct. Jan. Apr. July Amount allocated (£ millions) Clearing spread (basis points)
Three-month Level A allocated (left-hand scale) Three-month Level B allocated (left-hand scale) Six-month Level A allocated (left-hand scale) Six-month Level B allocated (left-hand scale) Six-month Level C allocated (left-hand scale)
Level A clearing spread (right-hand scale) Level B clearing spread (right-hand scale) Level C clearing spread (right-hand scale)
13 12
2011 14
(a) Where there has not been any allocation to a collateral set, no clearing spread is marked.
Gilts
The total stock of gilts outstanding, in terms of the amount paid to sellers, was £375 billion; of which £90.5 billion of purchases were made in the 3–7 years residual maturity range, £133.2 billion in the 7–15 years residual maturity range and £151.3 billion with a residual maturity of greater than 15 years (Chart 14).
Gilt lending facility(1)
The Bank continued to offer to lend some of its gilt holdings via the Debt Management Office (DMO) in return for other UK government collateral. In the three months to 30 June 2014, the daily average aggregate value of £977 million of gilts was lent as part of the gilt lending facility. Average daily lending in the previous quarter was £385 million. Corporate bonds
There were no purchases of corporate bonds during the review period. Future purchase or sale operations will be dependent on market demand, which the Bank will keep under review in consultation with its counterparties in the Corporate Bond Scheme.(2) The Scheme currently holds no bonds.
Secured commercial paper facility
The Bank continued to offer to purchase secured commercial paper (SCP) backed by underlying assets that are short term
and provide credit to companies or consumers that support economic activity in the United Kingdom.(3) The facility
remained open during the review period but no purchases were made.
(1) For more details on the gilt lending facility see the box ‘Gilt lending facility’ in the
Bank of England Quarterly Bulletin, Vol. 50, No. 4, page 253;
www.bankofengland.co.uk/publications/Documents/quarterlybulletin/mo10nov.pdf. (2) More information can be found in the Market Notice at
www.bankofengland.co.uk/markets/Documents/marketnotice130627.pdf. (3) The SCP facility is described in more detail in the Market Notice available at
www.bankofengland.co.uk/markets/Documents/marketnotice120801.pdf. 0 25 50 75 100 125 150 175 200 225 250 275 300 325 350 375 400
Feb. Feb. Feb. Feb. Feb. Feb. 15+ years 7–15 years 0–7 years 2009 £ billions 10 11 12 14 13
(a) Proceeds paid to counterparties on a settled basis. (b) Residual maturity as at the date of purchase.