*Corresponding author.
E-mail addresses: [email protected] (H. Ghodrati) © 2014 Growing Science Ltd. All rights reserved. doi: 10.5267/j.msl.2014.6.003
Management Science Letters 4 (2014) 1551–1558
Contents lists available at GrowingScience
Management Science Letters
homepage: www.GrowingScience.com/msl
A study on the relationship between operational cash flow and the return of stockholders
Hassan Ghodratia* and Hassan Abyakb
aAssist. Prof. & Faculty Member, Department of Management & Accounting, Kashan Branch, Islamic Azad University, Kashan, Iran bSama Technical and Vocational Training College, Islamic Azad University, Ayatollah Amoli Branch, Amol, Iran
C H R O N I C L E A B S T R A C T Article history: Received January 4, 2014 Accepted 28 May 2014 Available online June 1 2014
Performance measurement in managerial accounting is normally associated with cash flow and it is executed based on different figures such as testing information content abuse and accounting figures. However, increasing the information content in accrual components of earning and internal performance measurement provides additional informative insights. This paper studies the relationship between operating cash flows and earnings along with total shareholder returns. The study chooses the information of 54 firms from Tehran Stock Exchange. The results show that there were some meaningful relationship between the operating cash flow, profitability and the returns of all stakeholders. However, this happens by increasing profitability and cash flow of information asymmetry proportion to their correlation with the economic efficiency of shareholders’ returns.
© 2014 Growing Science Ltd. All rights reserved. Keywords:
Accounting Figures Performance Criteria Total Shareholder Return
1. Introduction
These days, corporations offer many products and services and the ownership of these business owners belongs to literally thousands of shareholders. To control such giant firms, a group of people called board of director manages the ongoing business and makes decisions. This transformation created a new group of professional managers who normally do not own any shares of the firms. Therefore, management of most corporations is separated from the shareholders (Shabahang and Hassan Ghorban, 1998). Separation of management from ownership may create conflict of interest between managers and shareholders and the emergence of the representation theory issue. From an economical perspective, assuming rational behavior of people, they first look after maximizing their interests and managers also are not exempt from this rule. Managers are interested in presenting favorable picture of the financial position of the business unit to shareholders and other interested parties along with maximizing its own interests, welfare and strengthen their job positions. However, in some cases, necessarily raising the capital of managers is not in line with raising the capital of
1552
other groups, including stockholders. This shows that benefits of managers and other interested groups in the business unit are not in one side. With regard to the theory of conflict of interest between managers and owners, managers of business unit have high incentive to manipulate earnings to maximize their own interests. Along with analysis of value created for shareholders, the company's free cash flow is important. Managers through identification of appropriate investment opportunities can invest mentioned funds in projects with positive net present value and thus will increase the wealth of their shareholders. According to the theory of the conflict of interest between owners and managers, some customers may be persuaded to invest their free cash flow in projects with negative net present value so that in short term provide some of their personal interests (Mehrani & Bagheri, 2009).
According to Grant (1996), the optimum motives associated with performance evaluation criteria are variables associated with stockholder’s return evaluation. These variables show the results of management decision- making. The specific performance criteria describe direct relation between management decision- making and results of the real performances .The primary goal of these criteria is to develop a measure for estimation results of the management decisions. There are literally various studies on cash flow effects. Khoshdel Nezamy (2006) investigated the relationship between operating profit and free cash flow with stock return, return on equity, return on total assets and net value growth of operational assets of corporations over the period 1998-2004. He reported that there was not any significant relationship between free cash flow, stock return, return on equity and return on total assets. He also reported a reverse relationship between free cash flow with growth of operational assets. Esmzadeh (2010) investigated the relationship between cash operating profit, accrual operating profit and free cash flow with stock returns of companies listed in Tehran Stock Exchange. He reported that, cash operating profit, accrual operating profit and free cash flow had some impacts on stock returns. Furthermore, free cash flow compared with the other two variables had a greater impact on stock returns.
Mehrani and Bagheri (2009) in their study investigated the effect of free cash flows and institutional Shareholders on earnings management of companies listed in Tehran Stock Exchange. They studied 90 corporation's performances over the period 1999-2005. In this survey, they concluded that there was a direct significant relationship between earnings management and high free cash flows in the companies with low growth. However, they did not find any significant relationship between earnings management and institutional shareholders in the companies with high free cash flows and low growth. Rezvani Raz and Haghighat (2005) studied the relationship between free cash flows and debt level by considering investment opportunities and size in the companies listed in Tehran Stock Exchange. They reported that in companies with low investment opportunities and big companies, there was a significant and positive relationship between free cash flow and debt level. In addition , the results showed that in the listed companies in Tehran Stock Exchange, investors and creditors in their decision to invest and giving credit considered internal finance supply and assessment criteria of the debt repayment power, namely free cash flow.
Dastgir and Sharifi Moghadam (2011) investigated the relationship between cash flows with stock return of companies. The research results indicated that there was not any significant relationship between operating cash flows and stock returns except in 2003 and in the analysis of mixed data, it was concluded that there was no significant relationship between operating cash flow and stock return using mixed data. In fact, at 5% error level, operating cash flows did not provide necessary information content for determining stock returns. Also in the analysis of cross-sectional data, there was significant relationship between free cash flows and stock return. The calculated results for year 2002 and 2003 showed that there was not any relationship between variables. Yang and Jianng (2008) concluded that companies that had high free cash flow maintained stronger correlation between the quality of accounting information and overinvestment.
Jones and Sharma (2001) studied the relationship between management earnings and free cash flow the on Australian firms with low growth and high growth. They reported that, in companies with low growth, there was a direct and significant relationship between discretionary accruals and free cash flow and managers try to improve the poor performance of their business unit through discretionary accruals. However, they did not find any significant relationship in the companies with high growth. Habib (2008) investigated the role of accruals and cash flows in explaining stock returns. He used the multi-variables linear-regression for variables relation measuring over the period 1995 and 2004. The results of this study showed that the profit had greater explanatory power than cash flows. Although this difference was negligible statistically and the profit and cash flows had information content for stock returns.
Ghaemi and Vatan Parast (2006) studied the relationship between accounting information with information dissymmetry. They reported that there was a meaningful relationship between accounting information and information dissymmetry. There is an information dissymmetry for investors before profit announce. They also reported that information dissymmetry increased shares trade and stock prices changes. Noravesh and Ebrahimi (2006) studied relationship between ownership structure with information symmetry and accounting performance profitability criteria. They showed that there was a direct relationship between institutional ownership with information symmetry. Ghasemi and Rahimpour (2010) studied the impact of seasonal profit announces on the information dissymmetry decreasing. They reported that after seasonal profit announce dissymmetry had not decreased. In other words, these announcements do not have efficient information for information dissymmetry decreasing. Ahmadpour at el. (2011) studied the relationship between commit mental figures quality with information dissymmetry in Iran. They showed that commit mental figures quality had not have any impact on the information dissymmetry.
2. The proposed study
2.1 Research Hypotheses:
This research was performed based on three hypotheses as follows:
1) If information dissymmetry exists, accounting figures will have more explanative ability than cash flow for stock market performance evaluation.
2) There is a direct relation between information dissymmetry with figures accounting explanative and net cash flow figures.
3) There is an in-direct relationship between information dissymmetry with explanative of the stock market performance and net cash flow figures.
2.2. Research Methodology
This research methodology is practical based on its goal, because it utilizes exist models and theories for firm’s problems evaluation. Our research methodology is descriptive – analytic because we used random statistical sample. We describe sample observations and then we used statistical tests for result extrapolation. The research design is Expose-Facto, because we used past data performances.
2.2.1 Sampling technique
The statistical community in this research is Iranian corporations. We selected 54 firms randomly based on Cochran’s formula. Their data was related with 2005-2011 annual performances
1554
The general relation for variables relationship
Rit = f (EARit, CFit, ... , DOMINATEDit ) (1)
where Rit is ith firm return for tth year, EARit is ith firm accounting profit for tth year, CFit is ith firm
cash flow for tth year. We used multi-variables linear regression for Rit computation. Our linear
equation is estimated as follows,
Rit = α+ β1 EARit + β2 CFit + β3BETAit + β4SIZEit + β5MTBit+ β6ETPit + β7LEVit + β8
DOMINATEDit (2)
That EAR is operational earning, CF is cash flow, BETA is firm risk, SIZE is firm size, MBT
represents share market value to share book value, ETP states for profit to equity ratio, LEV is total
liabilities to total assets ratio and DOMINATED is free stock ratio.
2.4 Statistical Methods
Our main statistical methods in this research are:
1) Descriptive methods: The descriptive indices such as mean, standard deviation were calculated for variables description. Furthermore frequency table and trend chart were used.
2) Kolmogorov-Smirnov Tests: Based on econometric preliminary this test was used. This test was used for normality distribution evaluation.
3) Multi-variables linear- regression: Based on this econometric method was evaluated the relation between variables estimation
4) Fisher test: This statistical test was evaluated the meaningful of estimated relation extrapolation.
3. The results
The sample data were selected based on six financial performances. The period of investigation was 2005-2011. In this section, at the first it was described the variables trends. At the second stage, it was investigated preliminaries of parametric statistical methods. At the end, it was estimated the relation between dependent and independents variables.
3.1 Variables Description:
At the first, it was described variables with statistical indices. The summary of this description is as figure 1:
Table 1
Summary of Description Results
Kurtosis skewedness St. Deviation Mean Maximum Minimum Variable 4.235 2.3152 6582 653256 859465 25364 Rit 5.231 1.235 2315 54261 95642 2354 EARit 1.3265 2.3154 45684 658497 956487 85468 CFit 5.125 2.3564 0.2315 0.2361 0.5624 0.123 BETAit 4.325 7.1235 52364 546231 875468 95867 SIZEit 4.5214 3.125 2315 7584 56324 4215 MTBit 2.5326 0.5236 23546 654897 986574 45216 ETPit 0.9564 0.6584 1.546 6.4125 8.0264 1.235 LEVit 0.012 0.123 0.235 0.524 1 0 DOMit
In our survey, all Skewedness and Kurtosis coefficients are bigger than 0.1. Therefore, the distribution of research variables are not normal.
The relationship between the two variables, with respect to the point that in the researches carried out by employing Gandry model and Hondurans Model in Stock Exchange Market of Germany by Gandfidner in the last 10 days, is presented in Fig. 1.
Fig. 3. Relationship between CF and EAR variables in Gandert and Hoydens models (MWBG) in German Stock Exchange Market
Based on the results, one may conclude that our static data is non-parametric and Spearman Test should be used for this data.
3.2. Normality test
The normality of the model is one of the most important issues associated with regression hypotheses. To assess the final model of the research, the main dependent and independent, and auxiliary variables have been used and the final regression of the model is evaluated afterwards. The differentiation between the assessed values and the actual values is the model residuals. Nevertheless, it is possible to ascertain the distribution of residuals prior to model assessment through dependent variables and auxiliary variable distribution tests. The hypothesis zero and the counter hypothesis are as follows:
H0: The remainders of regression model follows normal distribution.
H1: The remainders of regression model do not follow normal distribution.
Table 2 shows the results of Kolmogorov-Smirnov Tests. Based on the results, for all of variables, the
significance level at the end row, are near to zero. Therefore, hypothesis H0 is rejected, that is, the
distribution of each variable is not normal. Therefore, the parametric methods such as Pearson Correlation Coefficient or Multi-variables Linear-Regression are not suitable methods for the evaluation of variables relationship.
Table 2
The results of Kolmogorov-Smirnov Tests
Variable Rit EARit CFit BETAit SIZEit MTBit ETPit LEVit DOM.it
No. 324 324 324 324 324 324 324 324 324 Mean 78695 876543 657432 0.254 8764 98866 98654 2.543 86554 St. 65433 5433 8765 98766 7643 8765 5643 1.432 4543 Deviations 23432 6543 35542 676543 8765 7665 78654 0.8976 9876 Positive 4532 765 7654 43257 5432 6543 76541 0.2135 987 Negative 7654 65432 34211 453214 3421 5643 12321 0.5234 89765 Z-Statistic 9.235 7.5234 6.5324 4.5235 7.3254 6.3254 5.2315 5.96587 8.12547 Sig. Level 0.0003 0.00452 0.00986 0.00653 0.00452 0.00432 0.0043 0.00426 0.00425
1556
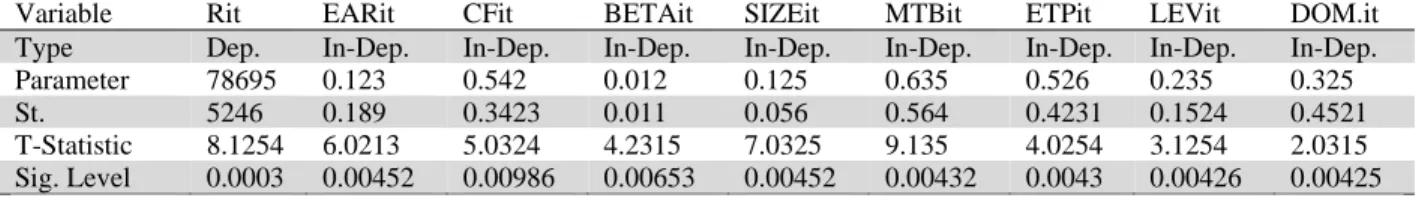
3.3 The evaluation of relationships among all variables
Table 3 demonstrates the results of multi-variable linear regression test.
Table 3
The Estimation of Multi –Variables Linear-Regression
Variable Rit EARit CFit BETAit SIZEit MTBit ETPit LEVit DOM.it
Type Dep. In-Dep. In-Dep. In-Dep. In-Dep. In-Dep. In-Dep. In-Dep. In-Dep.
Parameter 78695 0.123 0.542 0.012 0.125 0.635 0.526 0.235 0.325
St. 5246 0.189 0.3423 0.011 0.056 0.564 0.4231 0.1524 0.4521
T-Statistic 8.1254 6.0213 5.0324 4.2315 7.0325 9.135 4.0254 3.1254 2.0315 Sig. Level 0.0003 0.00452 0.00986 0.00653 0.00452 0.00432 0.0043 0.00426 0.00425
As we can observe from the results of Table 3, all estimated parameters are positive. Therefore, there is a direct relation between all of id-dependents and dependent variables. The R-Squared for this relation was 0.0025, and then the linear relation between variables is weak.
As it was shown on the pervious section, the distributions of dependent and in-dependent variables are not normal. Therefore, we have used Spearman Correlation Coefficient. Table 4 shows the results of our investigation.
Table 4
The type of relationship and the results of minor hypothesis
No. Hypothesis Type of
relationship
Significance Results of hypothesis 1 The accounting figures relationship has more explanatory
value than the figures of cash flow in MWBG model.
Direct 0.01 The accounting figures have more explanatory values.
2 The cash flow figures relationship has more explanatory value than the figures of cash flow in MWBG model.
Direct 0.05 The cash flow figures have more explanatory values.
3 The relationship between the accounting figures with cash flow, in lack of information asymmetry in Günter model determines the performance of stock outputs of the selected companies in Tehran Stock Exchange market.
Direct 0.416 The correlation between the two variables is significant in 0.000 error level.
Comparing the correlation of variables of the research and the model presented by Michael Wolf and
Bernhardt Gand-finder: As Table 4 shows, the MTB, ACCRUALS, EAR variables in both researches
have significant relationship in one percent level with 0.000 error. In addition, the variables LEV,
DOMINATED, SIZE variables in both researches showed no significant relation with the model.
However, the BETA systematic risk of Michael Wolf and Bernhardt Gandfinder showed stronger significant relationship than the selected sample in stock exchange of Tehran. Nevertheless, in our research, there was no significant correlation.
The figures of the cash flow provided strong relationship in 1 percent level with 0.000 error in the model presented by Wolf and Gandfinder. However, for the selected companies of stock exchange of Tehran, the relationship was significant in 5 percent level and 0.045 error. The proportion between the profit prior to interest and tax to the stockholders’ equity in the model presented by Wolf and Gandfinder had significant relationship in 5 percent level while in the selected companies of Tehran Stock Exchange Market, the relationship was significant in 1 percent level and 0.000 error.
Next, comparison between the effects of correlation in main variables of the research with the assumption of different states in the model presented by Michael Wolf and Bernhardt Gand-finder (MWBG) were performed. The variables testing were performed in different states by comparing the
results obtained in information asymmetric conditions and based on Rappaport, that the financial statements could be assessed and checked for their accuracy.
Table 5
Comparison between the effects of main variables
Variables Spearman Correlation with R in the selected samples of Tehran Stock Exchange Markets
Correlation with R in Stock Exchange Market of Germany by Michael Wolf and Bernhardt Gandfinder
EAR .682(***) 0.28(***) CF .111(**) 0.25(***) ACCRUALS .271(***) 0.14(***) BETA 0.014 0.09(***) SIZE -0.014 0.02 MTB .237(***) 0.11(***) ETP .251(***) 0.03(**) LEV -0.016 0.01 DOMINATED 0.043 -0.02
To analyze financial statements with similar conditions, it is possible to use the EAR accounting figures and cash flow figures with the output performance of all stockholders to find a criteria to assess the companies. For the MWBG method, small companies had significant relationship with
EAR and large companies had stronger relationship with cash flow. However, for the proposed model,
in first state, EAR and CF had strong significant relationship while during the second stage when two
companies were larger, there was a strong significant relationship with EAR and a significant
relationship with CF. This comparison is summarized in Table 6 as follows,
Table 6
Comparison between correlations among different models
Variables Spearman Correlation for the proposed model Correlation ratio for MWBG model MWBG model based on small enterprises Strong significant relation in both. Strong signification relation with EAR MWBG model based on large enterprises Strong significant relation with EAR and
significant relation with CF
Strong signification relation with CF
MWBG model l based on companies with no R&D Significant strong relation with EAR and CF Strong signification relation with EAR MWBG model based on companies with R&D Strong significant relationship with EAR Significant relationship with CF MWBG model based on enterprises with less than
average intangible assets
Strong significant relationship with EA and CF Strong signification relation with EAR
MWBG model based on enterprises with more than average intangible assets
Strong significant relationship with EA and CF Limited significant relationship with CF
MWBG model based on enterprises with less than average free floating stocks than the selected samples
Strong significant relationship in both Strong signification relation with CF
MWBG model based on enterprises with more than average free floating stocks than the selected samples.
Strong significant relationship in both Strong signification relation with EAR
4. Conclusion
By comparing the coefficient of determining the variables of the research in both the proposed and MWBG model, we understand that the free floating rate in German stock exchange is about 0.60 in average while the same rate is around 0.25 for selected firms in Tehran stock exchange. In addition, the selected companies of stock exchange of Germany consisted of 5000 enterprises in 10 years while the selected sample in stock exchange of Tehran consisted of 54 enterprises in six years.
References
Ahmadpoor Kasgari, A. & Ajam, M. (2010). Investigate the relation between accruals quality and
information asymmetry in firms listed in Tehran Stock Exchange. Stock Exchange Quarterly, 11,
108-111.
Baltagi, B. (1995). Econometric Analysis of Panel Data. 1st ed., New York: John Wiley & Sons Press.
Dastgir, M., & Sharifi Moghadam, R. (2011). Investigation the relationship between cash flows and stock
1558
Esmzadeh, A. (2010). Investigation the relationship between cash operating profit, accrual operating profit
and free cash flow with stock return. MA thesis; Tehran Campus University of Kish International.
Fazljo, P. (2009). The investigation of the relationship between free cash flow and earnings management of
companies listed in The Tehran Stock Exchange. MA thesis; Islamic Azad University of Science and
Research Branch of Tehran.
Ghaemi, M.H., & Vatan Parast, M. (2005). Study the role of accounting information in reducing
asymmetry of information in Tehran Stock Exchange Market. M.A. thesis, Imam Khomeini
International University.
Habib, A. (2008). The role of accruals and cash flows in explaining security returns.Journal of International
Accounting‚ Auditing and Taxation, 17, 51-66.
Hsiao, C. (2003). Analysis of Panel Data. 2nd ed., Cambridge University Press, Cambridge
Jaggi, B., & Gul, F. A. (2005). Evidence of accruals management: A test of the free cash flow and
debt monitoring hypotheses. Available at SSRN 2699.
Jensen, M. C. (1986). Agency costs of free cash flow, corporate finance, and takeovers. The
American economic review, 2, 323-329.
Jones, S., & Sharma, R. (2001). The impact of free cash flow, financial leverage and accounting
regulation on earnings management in Australia’s “old” and “new” economies. Managerial
Finance, 27(12), 18-39.
Khoshdel Nezamy, AR. (2006). The investigation of the relationship between free cash flow and operating profit with stock return and net market value growth of the operational assets of
companies listed in Tehran Stock Exchange. MA thesis; Islamic Azad University of Mashhad.
Lehn, K., & Poulsen, A. (1989). Free cash flow and stockholders gains in going private transaction.
Journal of Practice and Theory, 22(1), 93-108.
Nooresh, I., & Ghader Azhiri, M. (1998-1999). Research on the information content of accounting
numbers in the internal reporting. Investigation of Accounting and Auditing, School of
Management, Tehran University, 7(26-27), 134-144.
Mehrani, S., & Bagheri, B. (2009) "The investigation of the effect of free cash flow and institutional
shareholders on earnings management in the companies listed in Tehran Stock Exchange. Journal
of Accounting Research, 2, 50-71.
Rai, R., & Talangy, A. (2004). Investment Management. Tehran: Samt Press, 24.
Rezvani Raz, K., & Haghighat, H. (2005). An investigation on the relationship between free cash flow and debt amount by considering investment opportunities and size in the companies listed in
Tehran Stock Exchange. Pazhoheshgar Journal, 5, 50-57.
Shabahang, R., & Hassan Ghorban, Z. (1998). Assessing the effect of salaries and benefit of top
managers on the company's performance in opinion of Shareholders. Journal of Economics and
Management, 29, 5-22.
Yang, J.‚ & Jianng, Y. (2008). Accounting information quality‚ free cash flow and overinvestment.