WORKING PAPER NO. 10-8
"CREAM-SKIMMING" IN SUBPRIME MORTGAGE
SECURITIZATIONS: WHICH SUBPRIME MORTGAGE
LOANS WERE SOLD BY DEPOSITORY INSTITUTIONS
PRIOR TO THE CRISIS OF 2007?
Paul Calem
Federal Reserve Board of Governors
Christopher Henderson
Federal Reserve Bank of Philadelphia
Jonathan Liles
Freddie Mac
March 2010
“Cream‐Skimming” in Subprime Mortgage Securitizations:
Which Subprime Mortgage Loans Were Sold by Depository Institutions Prior to the Crisis of 2007?
Paul Calem
Division of Banking Supervision and Regulation, Federal Reserve Board
Christopher Henderson
Department of Supervision, Regulation and Credit, Federal Reserve Bank of Philadelphia
and Jonathan Liles
Mission Division, Freddie Mac
March 2010
The views expressed in this paper are those of the authors and do not necessarily reflect the
position of the Federal Reserve Board, the Federal Reserve Bank of Philadelphia, or Freddie Mac. We
thank Robert Avery, Michael Gordy, Paul Kupiec, Kate Samolyk, Robert Tsien, George Walker, and Peter
Zorn for helpful comments. We also thank Vidya Shenoy and Ali Cannoni for excellent research
assistance. This paper is available free of charge at www.philadelphiafed.org/research‐and‐
“Cream‐Skimming” in Subprime Mortgage Securitization:
Which Subprime Mortgage Loans Were Sold by Depository Institutions Prior to the Crisis of 2007?
Abstract
Depository institutions may use information advantages along dimensions not observed or
considered by outside parties to “cream‐skim,” meaning to transfer risk to naïve, uninformed, or
unconcerned investors through the sale or securitization process. This paper examines whether “cream‐
skimming” behavior was common practice in the subprime mortgage securitization market prior to its
collapse in 2007. Using Home Mortgage Disclosure Act data merged with data on subprime loan
delinquency by ZIP code, we examine the bank decision to sell (securitize) subprime mortgages
originated in 2005 and 2006. We find that the likelihood of sale increases with risk along dimensions
observable to banks but not likely observed or considered by investors. Thus, in the context of the
subprime lending boom, the evidence supports the cream‐skimming view.
“Cream‐Skimming” in Subprime Mortgage Securitization:
Which Subprime Mortgage Loans Were Sold by Depository Institutions Prior to the Crisis of 2007?
1. Introduction
Financial innovation has made transferring risk from primary lending markets through securitization
a common practice. Banks may securitize a portion of their loan portfolios to minimize regulatory capital
requirements or to diversify funding opportunities and risk. Investors seek to purchase asset‐backed
securities because they are relatively liquid and, in principle, allow the investor ownership claim on a
particular bank asset with quantifiable default and prepayment risk. The financial crisis of 2007,
however, curtailed much securitization activity. We focus our attention on information problems
associated with securitization as a factor leading to the crisis.
Do depository institutions sometimes enjoy information advantages for securitized assets along
dimensions not observed or considered by outside parties? And do they use these advantages to
transfer risk to uninformed or unconcerned investors through the sale or securitization process? Was
such “cream‐skimming” behavior common practice in the subprime mortgage securitization market
prior to its collapse in 2007? These questions are of interest not only in relation to subprime mortgages
originated and sold by depository institutions but also in regard to the role played by myopic or ill‐
informed investors in the subprime mortgage market generally.
This concept of “cream‐skimming” is similar to but distinct from the traditional concept of a “lemons
market” as applied to loan securitization. When investors cannot fully verify the quality of loans being
securitized, the lender potentially can keep the good (low‐risk) loans and sell the bad. In the traditional
lemons market, as in Akerlof (1970), buyers are aware of their informational disadvantage. Various
outcomes are possible, including breakdown of the market, pooling and pricing of risk, or the
development of mechanisms to separate the good from the bad.1 “Cream‐skimming” as defined here,
however, occurs when investors are unaware of or indifferent to the information asymmetry.
Conversely, “risk detection” among investors, ratings agencies, and market participants through higher
1 In the literature, these typically arise as pooling or separating equilibriums in models of contracting between
parties with asymmetric information.
asset yields, lower ratings, or greater credit enhancements implies the absence of cream‐skimming.
Moreover, “cream‐skimming” does not imply malfeasance on the part of depository institutions but
might result from investors and ratings agencies being overconfident in their ability to quantify default
risk or the likelihood of events that cause defaults to be correlated.
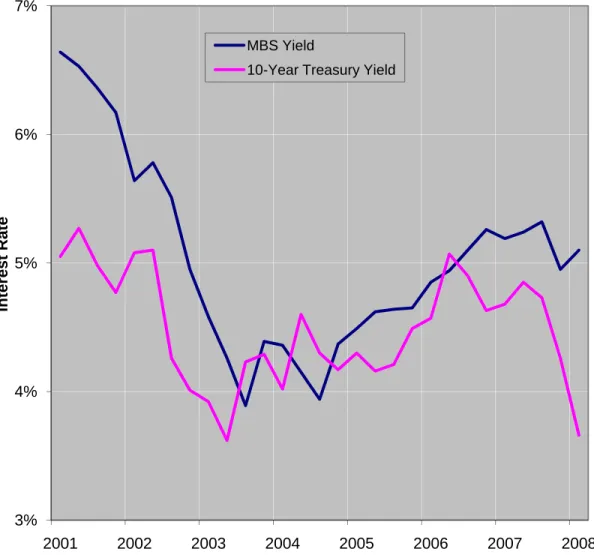
Figures 1 and 2 provide evidence consistent with the view that mortgage securitization markets
during the house price boom of 2005 through 2006 were characterized by possibly overly optimistic
views of mortgage credit risk and, thus, were potentially conducive to cream‐skimming. Figure 1
indicates that investors in mortgage‐backed securities did not demand higher yields for holding these
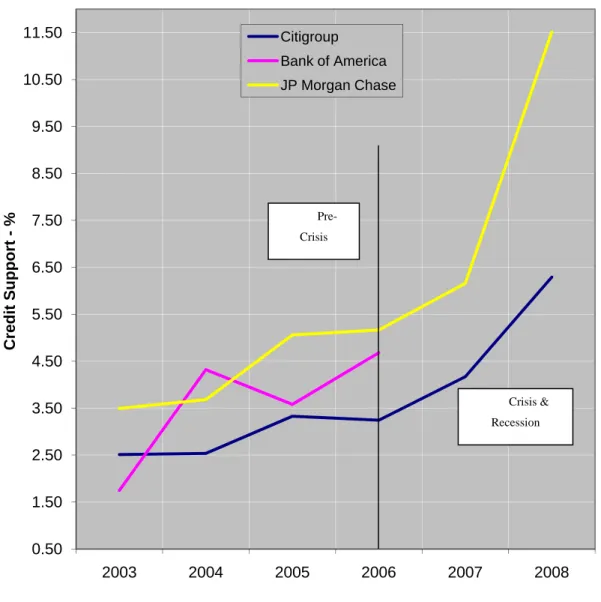
securities relative to the risk‐free Treasury yield. Additionally, Figure 2 shows that the level of credit
enhancements for senior tranches of prime, nonagency deals remained relatively consistent,
demonstrating that ratings agencies and investors were either unaware of the increasing credit risk of
the underlying mortgages or the ratings agencies made errors in assessing the risk, possibly opening the
door for originators to “cream‐skim.”2
A competing view is that securitization would be favored for relatively transparent, lower‐risk
assets, whereas banks would tend to retain opaque, higher‐risk loans because of the higher
transactions costs of securitization or market discipline (for example, Hill 1996). In the case of
mortgages, such a tendency may be reinforced by incentives arising from regulatory capital
requirements (Calem and LaCour‐Little 2004; Calem and Follain 2007). Consistent with this view, for
instance, Ambrose, LaCour‐Little, and Sanders (2005) find evidence in data from a single large lender
that risky mortgages are retained on balance sheet, while lower‐risk mortgages are sold into secondary
markets.
The recent experience in the subprime mortgage market suggests, however, that investors may
have become less responsive to risk, increasing the potential for cream‐skimming. Beginning in 2004,
growing demand for subprime RMBS among investors was satisfied increasingly through the origination
and sale of nontraditional loans, including hybrid adjustable rate mortgages (hybrid ARMs) with
artificially low initial interest rates. Moreover, many of the subprime loans originated and sold in 2005
and 2006 involved high loan‐to‐value ratios or were associated with a “piggyback” second lien, and high
post‐reset debt‐payment‐to‐income ratios, often exceeding 55 percent (Cagan 2007).
2 We thank Rita Csejtey and Lili Corson at the Federal Reserve Bank of New York for graciously sharing
This paper provides evidence that banks leveraged asymmetric information (or an excessive
optimism or breakdown of due diligence among investors) regarding the credit risk of subprime home
purchase mortgages, to shift risk onto investors in the RMBS market. Using Home Mortgage Disclosure
Act (HMDA) data merged with data on subprime loan delinquency by ZIP code, we examine the bank
decision to sell (securitize) subprime mortgages originated in 2005 and 2006. We find that the
likelihood of sale increases with risk along dimensions observable to banks but not likely observed or
considered by investors. For instance, the likelihood of sale increases with the ratio of loan amount to
borrower income (a proxy for the post‐reset debt‐payment‐to‐income ratio) and is positively related to
the ex‐post (January 2008) rate of serious delinquency among subprime loans in the ZIP code where the
property is located. While these findings are consistent with either cream‐skimming‐ or lemons market‐
type explanations, we believe (for reasons to be discussed) that overall the empirical results favor the
cream‐skimming view.
At the outset, we emphasize that the focus here is on the banking side of depository institutions
that originated subprime loans and on overall industry patterns, rather than the behavior of any
individual institution. In particular, we do not address the intriguing question of why some institutions
may have assumed risks on the trading side (through subprime RMBS purchases and related activities)
that they had previously avoided by securitizing subprime loans originated on the banking side.
The paper is organized as follows. Section 2, which immediately follows, briefly reviews a sampling
of related literature on bank loan securitization and the subprime mortgage market. Section 3 presents
a stylized, theoretical framework that will help motivate the empirical analysis. Section 4 presents an
overview of the data used for the analysis and a variety of descriptive statistics constructed from these
data that relate to the structure of the subprime mortgage market and characteristics of subprime
lending during 2005 and 2006. Section 5 develops our empirical analysis of the loan sale decision of
depository institutions, involving the estimation of logistic regression equations by year and institution
size. Section 6 presents the estimation results and Section 7 concludes.
2. Literature Review
Our paper contributes to the traditional literature on bank loan sale and securitization in relation to
credit risk. It also adds to the burgeoning new literature on the growth of the subprime mortgage
market and the ensuing foreclosure crisis and collapse of the market.
Banks have an incentive to sell or securitize loans to diversify funding opportunities and generate
liquidity, diversify or manage credit and interest rate risk, and reduce regulatory capital requirements.
In examining the relationship between securitization and credit risk, the literature focuses on the role of
asymmetric information and on incentives deriving from regulation.
In the context of the traditional lemons market, it is clear how the presence of information
asymmetry could encourage securitization of riskier loans. If lenders have more information about
borrower credit quality than the purchasers of the securitized assets, then the lenders would take
advantage of this information asymmetry and sell all risky loans. This is the classic lemons argument as
presented by Akerlof (1970).
It is equally clear, however, that alternative outcomes are possible depending on the structure of
the market and strategies available to buyers and sellers. Contracts may evolve that give lenders
incentives to either pool or separate risks. In the latter case, lower‐risk loans may be selected for
securitization and the higher‐risk loans retained, or the opposite outcome could prevail.
For instance, Hill (1996) develops a model in which the securitized assets are lower risk and their
credit quality more transparent. Securitization reduces financing costs for firms that face limited
financing opportunities due to limited information concerning the credit quality of their assets.
According to Hill, securitization “divides the firm into slices which permit more specialized appraisal”;
with selection of lower‐risk assets for securitization, “security investors needn't appraise the particularly
costly‐to‐appraise residual risks and prospects of such firms.”
Dewatripont and Tirole (1994, Chapter 10) also suggest that securitized loans are likely to be of
higher credit quality. They argue that banks are uniquely equipped to add value to loans made to
higher‐risk borrowers by managing the future relationship with the borrower and that securitizing such
loans may weaken this ability or the incentive to apply it.
In contrast, DeMarzo and Duffie (1999) propose a model in which asymmetric information drives
(where the credit quality differential is observable only to the lender) only by keeping a fraction of the
security issue to signal the value of the lender’s private information.3 This signaling through repurchase
of the security entails a cost and, therefore, provides a disincentive to securitize higher‐quality loans.
Moreover, the signaling enables the market to distinguish higher‐ from lower‐risk security issues and to
price accordingly.
Although information asymmetries are one factor in how securitization transactions are structured,
other factors such as the level of regulatory capital and reputational risk help explain a bank’s incentive
to securitize a pool of receivables. For instance, Calem and Follain (2007) maintain that for lower‐risk
mortgage loans, existing regulatory capital levels (established under the original Basel Accord) are too
high, creating an incentive to securitize these loans. As noted in the introduction, Ambrose, LaCour‐
Little, and Sanders (2005) examine data from a single large lender and find that risky mortgages are
more likely to be retained on balance sheet. They point to incentives arising from capital regulation and
reputational risk as likely explanations for their findings.
The collapse of the subprime market and beginning of the foreclosure crisis in 2007 and subsequent
turmoil in mortgage and housing markets have spurred a variety of research on problems in the
subprime or broader mortgage market that precipitated the crisis. Much of this research has focused on
the deterioration of underwriting standards and house‐price depreciation as primary factors (Smith
2007; Demyanyk and van Hemert (2009); Gerardi, Shapiro, and Willen 2008; Hahn and Passell 2008;
Sherlund 2008). Haughwout, Peach, and Tracy (2008) focus on early payment default and emphasize
that only part of the increase in default during 2007 is attributable to these factors. Demyanyk and van
Hemert (2009) argue that the decline in underwriting standards prior to the crisis could have been
detected but was masked by rapid house‐price appreciation. Coleman, LaCour‐Little, and Vandell (2008)
present evidence that the expansion of credit resulting from looser underwriting standards contributed
to the rise in house prices.
The issue broadly related to the subject of our paper—the role of securitization and associated
moral hazard problems—has also garnered attention, with several researchers pointing to securitization
as a principal culprit in the crisis. Ashcraft and Schuermann (2008) identify a number of market frictions
affecting the subprime mortgage origination and securitization process and argue that the associated
3 DeMarzo (2005) goes further by modeling how informed market participants create derivative securities by
misaligned incentives and adverse selection were largely responsible for the market’s collapse. A
partial list includes agency problems associated with brokers, such as incentives to misrepresent
borrower credit quality; cream‐skimming by portfolio lenders (the focus of our study); and rating agency
conflicts of interest.4 Golding, Green, and McManus (2008) and Hull (2009) also focus on misaligned
incentives of market participants, in particular, compensation of loan originators and security traders
disassociated from subsequent credit performance of the loans, and ratings agencies being paid by the
issuers of the securities being rated. They put forth recommendations aimed at increasing transparency
and reducing moral hazard in both the primary and secondary mortgage markets.
Rajan, Seru, and Vig (2009) draw a distinction between the “hard information” relied on by investors
to value securitized loans and “soft information” accessible to originators but not verifiable by a third
party. They argue that securitization of subprime mortgages reduced the incentive to collect soft
information, resulting in less effective credit screening. In contrast, we focus on the cream‐skimming
that may result from such an information asymmetry. Note that for an individual firm, these are
mutually exclusive outcomes, but that is not the case for the market as a whole; some institutions may
engage in cream‐skimming, while others may specialize in collecting only hard information and
securitize all of the loans they originate.
Ben‐David (2007) focuses on the propensity to overstate collateral values by borrowers,
intermediaries, and originators when it is advantageous to do so in the presence of asymmetric
information. In particular, originators are able to expand their business by securitizing more loans as
house prices rise. White (2009) emphasizes the role of overly optimistic evaluations of the credit risk of
mortgage‐backed securities, in part due to agency problems and in part to inadequate information and
“carelessness.” Coval, Jurek, and Stafford (2009) point to the amplification of errors in evaluating the
risk of the underlying securities of structured finance products and in the mispricing of these products.
Mian and Sufi (2009) present evidence that mortgage securitization expanded the supply of credit to
riskier segments of borrowers. They show that the massive expansion of credit was disassociated from
income growth in areas where it occurred and find an association with subsequent deterioration in
credit performance. Their finding of an association between increased securitization and higher default
rates at the neighborhood level is similar to that observed in our study, although the empirical
4 Ernst, Bocian, and Li (2008) argue that mortgage brokers also often exploit an information advantage relative
approaches differ.5 Their analysis suggests a direct link between securitization and the recent mortgage
crisis.
Elul (2009) compares the repayment performance of securitized residential mortgages to those
retained in portfolio, for loans originated during 2003 through 2007. The analysis controls for various
loan‐level factors, including the initial loan‐to‐value ratio and the borrower’s credit score at origination,
and for local economic conditions, including house‐price appreciation. The analysis indicates that
nonagency prime, adjustable rate securitized loans originated after 2003 (and fixed rate loans originated
after 2005) performed significantly worse than similar, nonsecuritized, loans. According to Elul, the
findings “suggest that adverse selection may have been present in the prime nonagency mortgage
market and may have contributed to deterioration in underwriting standards.”6
3. A Framework for Cream Skimming – Data Simulation
In this section we construct a simple data simulation that represents securitization by banks and
highlights two contrasting (but not mutually exclusive) hypotheses: the “cream‐skimming” view that
banks sometimes can exploit informational advantages along opaque dimensions of credit risk by
securitizing riskier loans, and the alternative view that securitization is favored for loans of higher credit
quality. This stylized framework helps put into focus the issues motivating the empirical analysis to
follow.
Essentially, we represent the choice of share of loans securitized as a decision under uncertainty,
where excess securitization (relative to the ex‐post realized target share) is more costly than retaining
too large a share. This cost asymmetry reflects the simple intuition that it is easier to sell surplus
balance‐sheet assets at a later date than it is to unwind a securitization or replace assets on balance
sheet. Initially, we assume that the bank does not have any private information (either ex‐ante or ex‐
post) concerning the value of securitization. We show that under plausible conditions, the proportion
securitized will decrease as the credit quality of the loans increases. While new, this approach is broadly
5 Mian and Sufi (2009) conduct a panel analysis of mortgage lending patterns at the ZIP code level; our analysis
is cross‐sectional and at the loan level and focuses specifically on the subprime loan sale decision along dimensions likely associated with bank information advantages.
6 Elul (2009) uses a loan‐level data set from LPS Analytics. The study also examines the subprime market and does not find a difference in performance between securitized and retained loans; however, the data set’s coverage of the subprime market is less representative than for prime and contains relatively few retained subprime loans.
similar to other arguments that have emphasized higher costs or reduced benefits from securitization of
riskier or more opaque assets.
To motivate this framework, we posit that the benefits and costs of securitization depend on
macroeconomic, sector‐specific, and institution‐specific factors that are not fully observed ex‐ante. For
example, changing macroeconomic conditions might affect the bank’s need for liquidity or the value it
adds to retained loans through its risk‐mitigation activities. For a given product and risk category of
loans, let X denote the ex‐post target share, that is, the share that would have been securitized
conditional on a realization of these random variables. Ex‐ante, X is a random variable that we assume
has a beta distribution, denoted F(X, a, b), with mean µ and standard deviation σ given by:
(1) µ = a/(a+b); σ2 = ab/(a+b)2(a+b+1) = µ(1‐µ)/(a+b+1); a > 0; b> 0
The beta distribution has advantages of being bounded between 0 and 1 and encompassing a variety of
possibilities, such as uniform, unimodal and bimodal symmetric distributions, and unimodal, asymmetric
long‐tailed distributions.
Let S denote the rate of securitization chosen by the bank ex‐ante. We assume that the cost of
over‐ or under‐securitizing conditional on X, denoted c(X), is proportional to X – S, specifically:
(2) c(x) = X – S if S > X; c(x) = α(X ‐ S) if X ≥ S, where α < 1
We first establish a general result concerning the relationship between ex‐ante uncertainty and
percent securitized. For this purpose, it is useful to characterize a beta distribution in terms of its
median and interquartile range. Thus, between two beta distributions with the same median, the one
with a larger interquartile range incorporates more uncertainty. Also, between two distributions both
having infinite density at zero and zero density at one (or vice versa), the one with the larger
interquartile range (or, equivalently, the one closer to uniform) represents greater uncertainty. We rely
on the following results, derived in the Appendix:
Proposition 1: Let F(x, a1, b1) and F(x, a2, b2) be two beta distributions with identical medians xm. If F(x, a1, b1) has a wider interquartile range, then F(x, a1, b1) > F(x, a2, b2) for all x < xm.
Proposition 2: Let F(x, a1, b1) and F(x, a2, b2) be two beta distributions such that, either ai < 1 and bi ≥ 1 for i=1,2, or ai ≥ 1 and bi < 1 for i=1,2. If F(x, a1, b1) has a wider interquartile range, then F(x, a1, b1) > F(x, a2, b2) for all 0 < x < 1.
The bank chooses a rate of securitization S to minimize expected cost:
(3) min ܿሺݔሻ݂ሺݔሻ݀ݔ
S
It is straightforward to verify that the solution S* satisfies:
(4) F(S*, a, b) = α/(1 + α)
Let F‐1 denote the inverse of the beta distribution F(X, a, b); then:
(5) S* = F‐1(α/(1 + α), a, b)
Since α < 1, we have S* < xm, where xm denotes the median. Therefore, it follows from Proposition 1
that across beta distributions having the same median, S* declines as the interquartile range widens.
Likewise, across beta distributions as characterized in Proposition 2, S* declines as the interquartile
range widens. Thus, in each case the rate of securitization declines as the degree of ex‐ante uncertainty,
represented by the interquartile range of the distribution, increases.7 If we further assume that lower‐
quality (riskier or more opaque) assets are characterized by greater uncertainty regarding the ex‐post
target rate of securitization, then the ex‐ante rate of securitization will decline with credit quality. Such
an assumption seems reasonable; because the repayment performance of these loans is more
uncertain, the costs and benefits associated with securitizing them are apt to be more uncertain as well.
Note that S* will also depend on the median of the distribution xm, which could reflect, for instance, the
transactions costs of securitization and the marginal contribution of a loan sale to diversifying portfolio
risk.
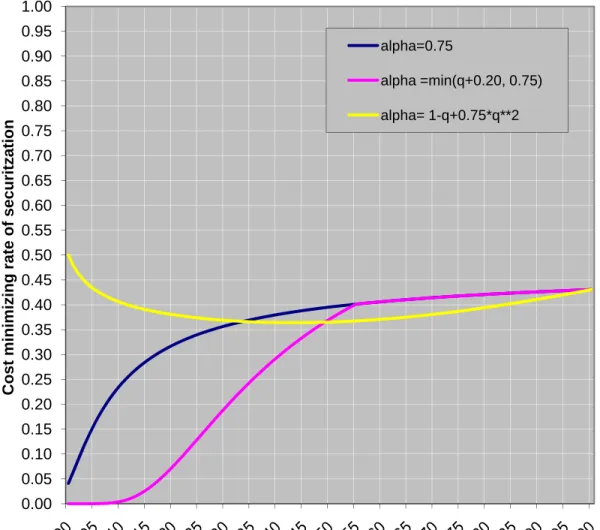
These ideas are illustrated in Figure 3 for the case of symmetric beta distributions for which a=b and
xm=µ=½. We assume that a=b=q+0.05, where q is an index of credit quality that ranges from 0 (C‐rated)
to 1 (A‐rated), with larger q corresponding to higher credit quality. The solution S* in relation to the
quality index q is indicated by the blue line in Figure 3 for the case α = 0.75. S* is upward sloping in
relation to q, reflecting the reduced variance (and interquartile range) associated with larger q.8
Further, it seems plausible that the marginal cost of excess securitization may be larger for lower‐
quality assets. For instance, it is reasonable to expect that the value added to retained loans through
7 Letting δ denote the interquartile range, we have dS*/dδ = ‐(∂F/∂δ)/(∂F/∂x) < 0. 8
risk‐mitigation efforts is greater for loans that are riskier or more opaque. 9 We can represent such a
relationship by replacing the parameter α, which quantifies the cost differential between over‐ and
under‐securitization, with a relationship α(q), where dα/dq ≥ 0. Not surprisingly, as shown by the
magenta line in Figure 3 for the case α(q) = min(q+0.20, 0.75) and a=b=q+0.05, this assumption results in
a more rapid decline in the securitized share S* as credit quality decreases.
Informational advantages of banks. Thus far, we have assumed that the bank does not have private
information concerning the return to securitization. We now consider that possibility. We consider
only the possibility of cream‐skimming as defined previously, as opposed to the traditional lemons
market situation. That is, the dimensions along which the bank has private information are either not
observed or not considered by the securities market.
Ties to local markets, for instance, may generate information advantages for depository institutions,
including knowledge of local or neighborhood conditions influencing mortgage or small business credit
risk.10 Prior or ongoing lending relationships may be a source of additional private information. Another
possibility is that banks benefit from superior controls over information processes because of better
aligned incentives and regulatory supervision. This possibility may have been applicable particularly to
the subprime mortgage market, where RMBS investors depended on rating agencies or other third
parties that may have faced conflicting incentives (Ashcraft and Schuermann 2008).
Such information advantages create opportunities for banks to “cherry pick” among loans
indistinguishable to the market, retaining those with lower expected loss conditional on information
available only to the bank. Of course, in a context of repeat relationships, investors could punish banks
that on previous occasions sold loans that underperformed, thereby deterring cream‐skimming activity.
Suppose, to the contrary, that investors are unresponsive to cream‐skimming. This might be the case,
for instance, in an environment where investors are unaware of certain risks, mistakenly relax their due
diligence activity, or are overly optimistic. Now let q index a credit quality dimension observed only (or
with greater accuracy) by the bank. In this case, the bank’s marginal benefit from securitization will
increase as credit quality decreases, because of the ability to cream‐skim lower‐quality loans. We again
can illustrate this effect by replacing the parameter α with a relationship α(q), where now dα/dq < 0 for
9
This value added is mostly realized under circumstances (realizations of X) that generate higher default rates.
10 Community banks by definition have ties to local markets. Larger banking organizations may also develop
awareness of local and neighborhood conditions by monitoring the profitability of branch networks or broker and correspondent relationships, or through community reinvestment activities.
a range of q. The yellow line in Figure 3 represents the case α(q) = 1‐q+3q2/4, again with a=b=q+0.05.
Not surprisingly, the possibility of cream‐skimming leads to reversal of the relationship between
(asymmetrically observed) credit quality q and the rate of securitization; for q < 0.44, securitized share
increases as credit quality declines. We question whether this latter scenario had some role in the crisis
of 2007.
4. Data
Our empirical analysis focuses on the loan sale (securitization) decision of depository institutions
regarding subprime home purchase mortgages originated in 2005 and 2006. The analysis relies on loan‐
level HMDA data, which indicate whether a loan was sold during the year when it was originated, and
the type of institution purchasing the loan.11
In addition to indicating whether a loan is sold or retained, the HMDA data provide a variety of loan,
borrower, and property characteristics that we use to develop our empirical analysis. These include the
loan amount; loan purpose (home purchase or refinance) and type (conventional or government
insured); identity of the institution that originated the loan; income of the borrower, state, county, and
census tract location of the property being financed; and ownership status of the property (owner‐
occupied primary residence or not). For high‐cost loans, defined in the HMDA regulation as first‐lien
loans with APR spread greater than or equal to 300 basis points above the applicable Treasury yield (500
basis points for junior liens), the APR spread is also provided. We limit the population for our analysis to
high‐cost loans plus loans originated by HUD‐identified subprime specialists (whether high‐cost or not),
defining this to be the subprime population in the HDMA data.12 We further restrict the sample to
conventional, first‐lien, single‐family home purchase loans.13
11 Purchaser categories include Fannie Mae; Freddie Mac; Ginnie Mae, Farmer Mac; commercial or savings
bank or savings and loan association; affiliated institution; mortgage, finance, or life insurance company or credit union; other type of purchaser. Note that the disposition of a loan originated late in the year generally is not known, since a sale of the loan would typically not occur until the following year.
12 We also exclude loans larger than $1,000,000. 13
The restriction to home purchase loans is motivated in part for the sake of brevity and in part by the lack of distinction in HMDA data between two important categories of refinance loans: cash‐out refinancing used to extract accumulated home equity, and rate‐refinancing used to obtain a lower interest rate or to reduce (at least temporarily) the monthly mortgage payment. Moreover, a prior relationship with the borrower is more likely to be a factor in refinance lending. Inability to distinguish such factors complicates interpretation of empirical results based on refinance loans. Results obtained with refinance loans are similar to those reported below for home purchase loans.
We supplement the HMDA data with institution‐specific information: primary regulator; total assets;
and whether the institution is a subprime lending specialist as defined by HUD. For depository
institutions, we also add an indicator for thrift institutions (saving and loan institutions and savings
banks) and an indicator for whether the institution has a branch in the county where the loan was
originated.14
We also combine the loan‐level data with a number of local and neighborhood‐level housing and
mortgage market variables. Annual house‐price appreciation rates by metropolitan statistical area
(MSA) and state are calculated using the Federal Housing Finance Agency’s ((FHFA), formerly the Office
of Federal Housing Enterprise Oversight (OFHEO)) weighted repeat‐sales price index. Percent change in
housing starts from the previous year, by MSA and state, are obtained from Economy.com.
Neighborhood‐level variables include number of owner‐occupied units in the census tract where the
property is located, from the 2000 U.S. census, and information from HMDA aggregated to the tract
level. The latter include, by year, the proportion of mortgages that are high‐cost loans; the fraction of
subprime mortgages that are originated by HUD‐identified subprime lenders; the proportion of home
purchase loans that are for non‐owner‐occupied properties; and the fraction of high‐cost home
purchase loans that are second lien.15
HMDA does not provide detailed information on loan terms, loan‐to‐value ratio (LTV), or borrower
credit information such as FICO score. We accessed such information, along with data on subsequent
payment performance, at the aggregate ZIP code level using the LoanPerformance TrueStandings
Servicing™ online data analytics tool. This platform provides aggregated ZIP‐code‐level information on
the current payment status of active mortgages and original loan terms and LTVs and FICO score ranges
for both paid‐off and active mortgages serviced by the top mortgage servicing institutions.16 In contrast
to the more commonly used loan‐level subprime securities database of LoanPerformance, the subprime
servicing database includes subprime loans retained in bank portfolios as well as those in securities.17
14
We thank Robert Avery of the Federal Reserve Board of Governors for supplying the institution‐level data.
15 The aggregated tract‐level measures from HMDA are defined with respect to conventional, single‐family,
home purchase, and refinance loans originated by the HMDA‐reporting institution. Other than the fraction of second liens, they are calculated with respect to first liens only.
16 This online business intelligence platform accesses the subprime mortgage database of LoanPerformance, a
division of FirstAmerican CoreLogic. Information about TrueStandings Servicing® is available at
www.loanperformance.com.
17 Loans assigned to the subprime database are serviced by institutions that specialize in servicing subprime
loans or are identified as subprime by the servicing institution. Despite the recent demise of most subprime specializing institutions, the subprime database continues to track the performance of active subprime loans,
Specifically, we obtain estimates of first‐lien subprime mortgage delinquency and foreclosure rates
as of October 2008 by ZIP code and of the proportion of subprime mortgages originated during 2005
and 2006 in each ZIP code by range of origination LTV ratio, FICO score range, and interest rate type.
We merge these ZIP‐code‐level data into our loan‐level HMDA data. Since HMDA data indicate the
state, county, and census tract associated with a mortgage, not the ZIP code, we first map each state,
county, and census tract into one or more ZIP codes.18
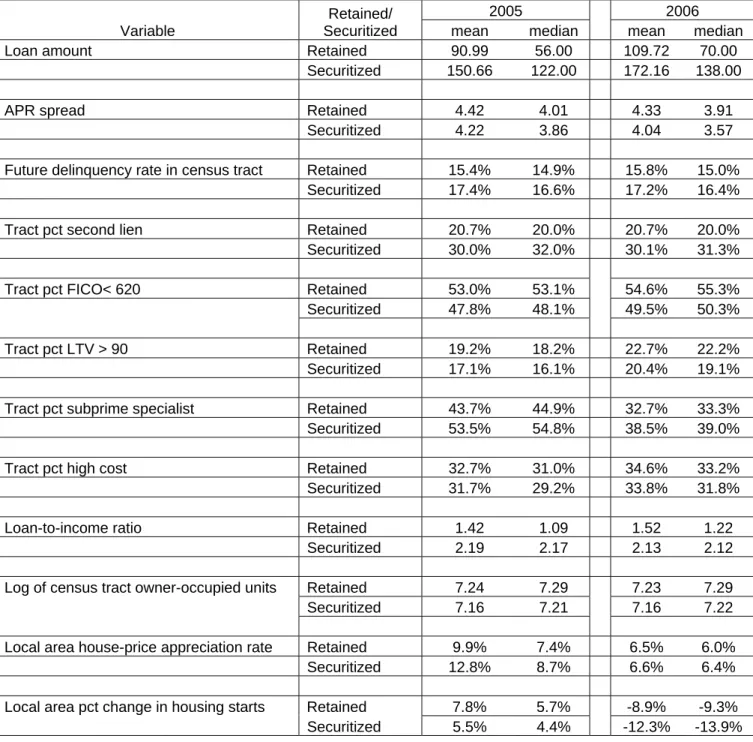
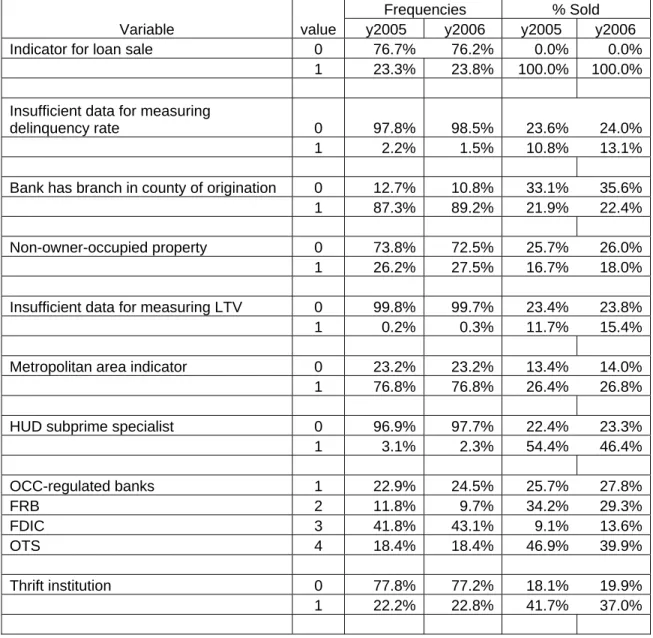
Overview of the subprime market in 2005 and 2006. Figures 3 through 12 present descriptive
information on the composition of the subprime home purchase loan market in 2005 and 2006,
providing background for our analysis. Figures 3 through 8 describe subprime lending activity by type of
institution, based on the subprime HMDA data. Figure 9 provides summary statistics from the HMDA
data merged with the data on MSA house‐price appreciation and housing starts, with 2004 data
appended for comparison. Figures 10 and 11 provide summary statistics on product mix and loan
characteristics from the HMDA data merged with the data from LoanPerformance TrueStandings
Servicing™, again with 2004 appended for comparison. Figure 12 presents information from HMDA on
proportion of subprime, first‐lien home purchase loans originated with “piggyback” second liens in 2004
through 2006.
The distribution of high‐cost home purchase loans by type of institution is presented in Figure 3. In
2005, a slim majority of the loans were originated by subprime specialists; nonspecialist nondepository
institutions had the next highest share, nearly 30 percent, followed by large (more than $10 billion in
total assets) and small depository institutions, respectively. In 2006, the share of subprime specialists
declined to about 36 percent, while the share of nonspecialist nondepository institutions increased to
match that of the specialists. The shares of large and small depositories increased as well, from around
20 to about 30 percent combined share.
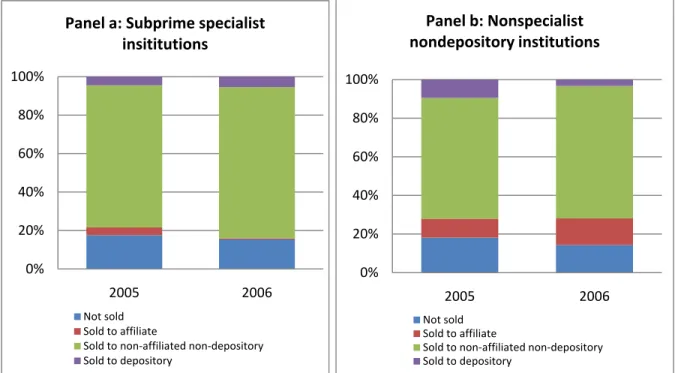
Figure 4 reports the disposition of subprime home purchase loans (whether sold or retained, and
type of purchaser) in 2005 and 2006, by type of institution originating the loan. Similar patterns are
observed in each year. Nearly 80 percent of the originations of subprime specialist institutions are
reported sold to nonaffiliated nondepository institutions. For convenience, we shall refer to this loan
sale category as securitization, since it is likely that these loans were packaged in securities and sold to
because the servicing of these loans has largely been transferred to other institutions that contribute to the database.
18 Where a census tract traverses more than one ZIP code, we allocate the tract across the ZIP codes in
investors. Small quantities are sold by subprime specialists to affiliated institutions or nonaffiliated
depository institutions, while a little less than 20 percent are recorded as not sold. It is likely that most
of the latter are in the securitization “pipeline” or are “warehouse” loans being held for sale, including
loans originated near the end of the HMDA‐reporting year. At nonspecialist nondepository institutions
(including independent mortgage companies as well as mortgage subsidiaries of depository institutions
or of bank or thrift holding companies), the share sold directly to the securities market was somewhat
smaller, closer to 70 percent, reflecting a somewhat larger share sold to affiliates and depositories,
while the share recorded as not sold was again not quite 20 percent. About half of the loans of large
depository institutions in 2005, rising to 55 percent in 2006, and less than 20 percent of the originations
of small depository institutions, are sold directly to the securities market. Close to 20 percent of the
originations of large depository institutions are sold to affiliates, while 80 percent of the originations of
small depository institutions are recorded as not sold.
Figure 5 indicates the average ratio of loan amount to income by type of institution in 2005 and
2006. This ratio is highest at subprime specialists, close to 2.5 in each year, suggesting relatively high
risk exposure with respect to the repayment capacity of borrowers. It is marginally smaller at large
depository institutions and nonspecialist nondepository institutions, in the range of 2.2 to 2.4, and much
lower, about 1.5, at small depository institutions.19 Average loan sizes show a similar pattern by
institution category, as indicated in Figure 6.
Average APR spread in 2005 and 2006 by type of institution is shown in Figure 7. Subprime
specialists and nonspecialist nondepository institutions have larger average APR spreads than depository
institutions. In 2006, spreads for subprime specialists rose dramatically, while spreads for small
depository institutions declined, relative to the other institution categories.
Figure 8 indicates percent of loans associated with a nonprimary residence (investment property or
second home), by type of institution in 2005 and 2006. Percent of loans in this occupancy category is
greatest for small depositories, about 25 percent, and smallest for subprime specialists, only 10 percent,
in both years. The share of loans associated with nonprimary residence increased substantially between
2005 and 2006 for nonspecialist nondepository institutions and for large depositories.
Housing market conditions in 2004 through 2006 are summarized in Figure 9. Sample averages of
annual percent change in the local area FHFA house price index and annual percent change in local area
19 Note that the decline in the average loan‐amount‐to‐income ratio between 2005 and 2006 does not
necessarily imply declines in payment‐to‐income ratios, since subprime product mix changed, and shorter‐term interest rates rose.
housing starts are shown, along with annual percent change in the FHFA national house‐price index.20
House‐price appreciation and growth in housing starts declined in 2006 from the elevated levels
observed in 2004 and 2005. The sample average rate of house‐price appreciation exceeds the percent
change in the FHFA national index each year, indicating that subprime home purchase loans were
disproportionately originated in markets with high rates of house‐price appreciation.
Figure 10 indicates that about half of the dollar volume of subprime home purchase mortgages
originated in 2005 was in hybrid ARMs (mostly 2‐28 and 3‐27); about 30 percent was standard ARMs;
about 10 percent were fixed‐rate (FRMs); and the remainder (less than 10 percent) was a mix of
nontraditional products (balloon and others, including interest‐only mortgages). From 2005 to 2006,
substantial shifts occurred from hybrid ARMs to the nontraditional products and from FRMs to standard
ARMs, a continuation of a trend observed between 2004 and 2005.
As shown in Figure 11, around a third of subprime home purchase mortgages in 2005 and 2006 were
categorized as low documentation. A slim majority had FICO scores greater than 620, indicating that
borrower credit rating was only one of a number of factors distinguishing subprime from prime loans.
Fewer than 20 percent have an LTV of 90 percent or greater. These proportions were similar in 2004.
Note, however, that these data indicate only the LTV associated with the first lien. Figure 12
provides estimates of the proportion of first‐lien, subprime home purchase loans associated with
“piggyback” second liens in 2004, 2005, and 2006.21 About half of first‐lien subprime loans originated in
2005 and 2006 had a “piggyback” second, a considerable increase compared with 2004 and even more
so compared with previous years.22
5. Empirical Approach
The primary objective of our empirical analysis is to explore the subprime loan sale decisions of
depository institutions in 2005 and 2006 for evidence of cream‐skimming behavior. A finding that
20 Sample averages are obtained by weighting the local values by the subprime loan counts in the sample. 21 Our estimate of proportion of first liens with a piggyback second is based on HMDA data with matched first
and second liens (generously provided by Robert Avery of the Federal Reserve Board) and is calculated as follows. Let N = total number of matched seconds (subprime or prime) in these data; M = total number of subprime firsts; n1= number matched to a subprime first; n2 = number matched to a prime first; and Y= total no. of unmatched seconds (subprime or prime). We impute y1=Y*(n1/N) to be the number of unmatched seconds that are
piggybacks to a subprime first. Then the total matched to subprime first‐lien (actual + imputed) = n1 + y1, and the proportion of firsts with a piggyback second is (n1 + y1)/M.
22 Lien status is not provided in HMDA data prior to 2004. However, monthly 2004 HMDA data indicate rapid growth in second‐lien loan originations during the year.
likelihood of sale is inversely related to credit quality along dimensions associated with bank
informational advantages would be consistent with cream skimming.
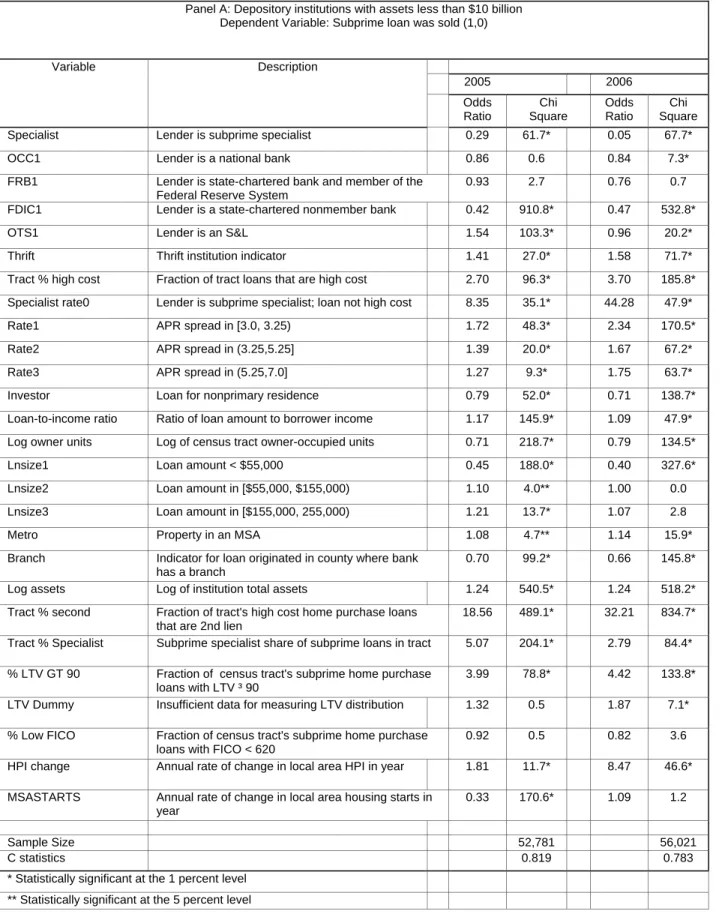
We estimate logit regression models relating the disposition of subprime loans originated by
depository institutions (sold or not) to factors likely to be associated with information advantages; other
indicators of credit quality; and other control variables. We estimate separate equations for large and
small institutions (greater or less than $10 billion in assets) and by year (2005 and 2006). We include
institution‐specific fixed effects in the equation for large institutions and a vector of institution‐specific
characteristics in the equation for small institutions.
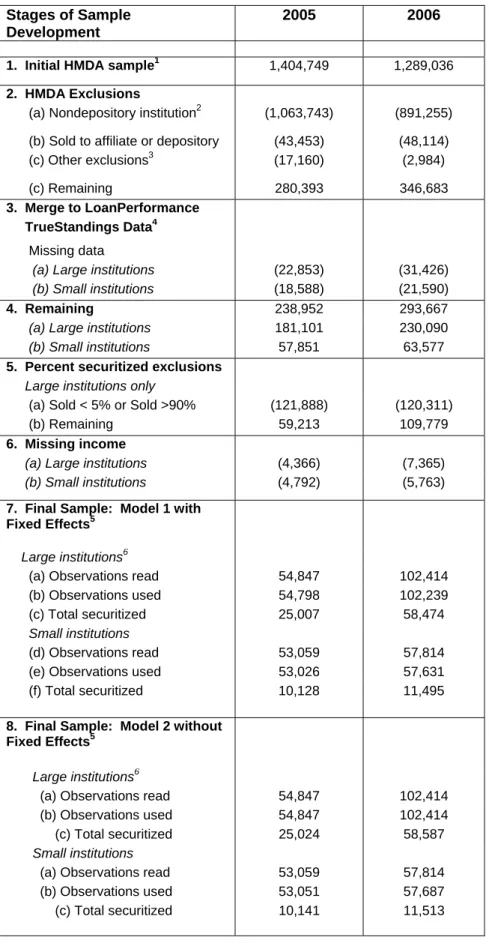
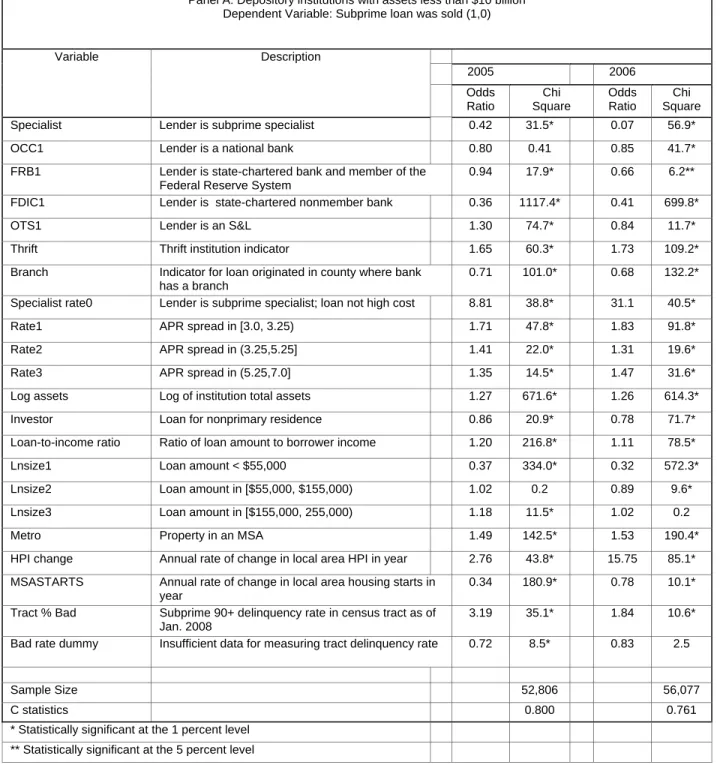
Most of the original HMDA sample (75 percent of the 2005 sample and 70 percent for 2006) is
excluded by the restriction to loans originated by depository institutions, as shown in Table 1, lines 1
and 2a. We further restrict the sample by excluding loans sold to affiliates and or to nonaffiliate
depository institutions, since the meaning of the sale is ambiguous and the ultimate disposition of the
loan is not known (they may or may not be resold in securities.) In addition, we exclude the depository
subsidiary of AIG and large institutions that originate fewer than 100 loans.23 The effect of these
exclusions on sample size is shown in Table 1, lines 2b and 2c.
As shown in line 3, about 15 percent of the remaining HMDA sample for each year cannot be
merged with the LoanPerformance data, because information on loans originated in the ZIP code is
lacking in the LoanPerformance database. The post‐merge sample sizes are shown in line 4.
Most of the loans excluded on the basis of sale to affiliate or to nonaffiliate depository institutions
were sales to affiliates by large depository institutions. Although in the aggregate, about 20 percent of
the subprime loans originated by large depository institutions in both 2005 and 2006 were sold to
affiliates, most of these sales were by institutions that sell all or nearly all of their loans. In estimating
the fixed effects model, where institution‐specific effects are accounted for, such institutions are
necessarily excluded from the sample. Thus, we need not be concerned about censoring bias arising
from these exclusions.24
23 These institutions are viewed as nonrepresentative of large depository institutions that are active in the
mortgage market. The AIG subsidiary is excluded because its parent is an insurance company. The large institutions that originate fewer than 100 loans are not active mortgage lenders and their loans represent a negligible share of the large institution sample. Moreover, it is convenient to exclude them for the purpose of estimating a fixed effects model. Note that depository subsidiaries of investment banks also end up excluded from the final sample, on the basis of criteria introduced below, because they sell more than 90 percent of the loans they originate.
24 With exclusion of the institutions that sell all or nearly all of their loans, the share of the large bank sample
Specifically, because we allow for systematic differences across institutions through inclusion of
fixed effects, we exclude from the large bank sample institutions that sell more than 90 percent or fewer
than 5 percent of the loans they originate. Row 5 of Table 1 reports the impact of these exclusions on
sample size. 25
Bank informational advantages. Banks are likely to have an information advantage along
dimensions associated with neighborhood‐specific credit factors, reflecting their ties to local markets.
We employ two alternative approaches to test for cream‐skimming related to neighborhood‐specific
information. The first approach, termed Model 1, includes several neighborhood risk factors in the
vector Xi in equation (7):
Percent of home purchase loans originated in census tract that are subprime Percent of census tract’s subprime loans that are originated by subprime specialists Housing market depth (log of the number of owner‐occupied units in the census tract)
The second approach, Model 2, includes a single neighborhood variable:
The future (January 2008) subprime mortgage default rate in the census tract26
Neighborhood concentrations of subprime loans can generate elevated neighborhood default rates
with adverse spillover effects on collateral values.27 Concentrations of loans originated by subprime
specialists can have similar effects.28 Neighborhoods with fewer home sales will tend to have fewer
informed appraisals and, therefore, a higher default risk associated with a particular measured LTV
25
We apply a weaker criterion at the upper end to account for the fact that sales of loans originated near the end of the year are underreported. Three institutions in 2005 and four in 2006 were excluded because they had fewer than 5 percent sold loans, and ten institutions in 2005 and eight in 2006 were excluded because they had more than 90 percent sold loans. In addition, for consistency, for both years we exclude Fremont Mortgage, which straddled the 90 percent threshold, meeting it in 2005 and falling just short of it in 2006.
The final large bank samples are composed of 24 and 31 institutions, respectively, for 2005 and 2006. A list of these institutions is available from the authors on request.
26
The default rate is measured as number of loans 90‐days or more delinquent or in foreclosure, divided by number of active loans.
27 See Lee (2008) for a literature review of price‐related spillover effects. 28
About 10 percent of the loans originated by subprime specialists each year in 2005 and 2006 were not high cost as defined in HMDA data but would have been higher risk than loans originated by prime lenders. Subprime specialists may also have tended to serve higher‐risk segments among borrowers obtaining high‐cost loans, as suggested by the data in Figures 5 through 7.
ratio.29 If depository institutions are better informed regarding these risk factors and use their
advantage to cream‐skim, then the likelihood of loan sale would increase in relation to the first two
measures and decrease in relation to the third.30 Similarly, if they are cream‐skimming, then the
likelihood of sale would be positively related to the ex‐post neighborhood default rate.
In both Models 1 and 2, we include two additional variables that we associate with likely
information advantages of depository institutions:
An indicator for whether the institution has a branch in the county where the property is located The ratio of loan amount to borrower income
Loans originated “out‐of‐market” (where the institution has no branch presence) more likely were
obtained through mortgage brokers compared to loans in areas covered by the bank’s branch network.
Broker originations have been associated with agency problems and elevated credit risk (Jiang, Nelson,
and Vytlacil 2009). If origination channel is not consistently reported to investors, then the possibility of
cream‐skimming based on origination channel arises.31 Such cream‐skimming would be reflected in the
likelihood of sale being positively related to branch presence.
The ratio of loan amount to income is a proxy for debt‐repayment capacity, where a larger loan
amount relative to income indicates a greater payment burden and increased credit risk. Underwriting
in the subprime RMBS market generally relied on standard payment‐to‐income ratios based on initial
loan terms and did not account for potential post‐reset payment shocks associated with hybrid ARMs
and nontraditional loan products. Depository institutions may have gained an information advantage by
applying more robust measures of repayment capacity of subprime borrowers than those used by
ratings agencies or investors. Note that the advantage here relates to how information is used rather
29 It is commonly argued that housing market depth is associated with the accuracy of appraised values and
the resulting LTV ratios (Nakamura 2010). Because of potential endogeneity of number of home sales, we employ the log of the number of owner‐occupied units as an instrument.
30 Alternatively, subprime lenders may have relied disproportionately on brokers, in which case subprime
share or share originated by subprime specialists may be correlated with share originated by brokers. As discussed below, broker channel may be a source of risk concerning which investors may have incomplete information, creating an opportunity for cream skimming.
31 Origination channel is a requested but not a required field for rating agency RMBS models. Even when loans
originated through the wholesale channel are identified, the investor or rating agency likely would not be able to distinguish between third‐party originators who have long‐term relationships with the bank from those that do not. The latter would be more strongly associated with agency problems and increased credit risk (Jiang, Nelson, and Vytlacil 2009).