Mixed Anion Amides for
Hydrogen Storage
by
David R. Hewett
Supervisor: Dr Paul A. Anderson
A thesis submitted to The University of Birmingham for the degree of Doctor of Philosophy
The School of Chemistry College of Engineering and Physical Sciences The University of Birmingham August 2012
University of Birmingham Research Archive
e-theses repository
This unpublished thesis/dissertation is copyright of the author and/or third
parties. The intellectual property rights of the author or third parties in respect
of this work are as defined by The Copyright Designs and Patents Act 1988 or
as modified by any successor legislation.
Any use made of information contained in this thesis/dissertation must be in
accordance with that legislation and must be properly acknowledged. Further
distribution or reproduction in any format is prohibited without the permission
of the copyright holder.
Abstract
Metal hydride materials have attracted much interest for their potential use as hy-drogen storage materials. Complex hydrides are amongst the most promising due to their high gravimetric storage capacities and favourable de/rehydrogenation conditions. Here, mixed anion complex hydrides are investigated both through halide doping of LiNH2 and Li2NH, and though a mixed LiNH2-LiBH4 system.
The reaction of LiNH2 and Li2NH with lithium or magnesium chloride,
bro-mide and iodide has been shown to form a series of abro-mide- and ibro-mide-halide phases. The structures of these phases were investigated through powder diffrac-tion methods as well as Raman spectroscopy. The hydrogen releasing properties of these materials were investigated through reaction with LiH and MgH2; while
the equivalent hydrogenation reactions were also tested. In both cases these ma-terials performed more favourably than the pure LiNH2-LiH system. The lithium
ion conductivity of these materials was also investigated; it was shown that the most conducting materials were also the quickest to release and uptake hydrogen. The LiNH2-LiBH4 system was studied, with particular focus on the
decom-position product, Li3BN2. All three known polymorphs of this compound were
shown to be able to form by the reaction of 2LiNH2+ LiBH4by carefully changing
the reaction conditions. Further stages of this system were investigated through reaction of Li2NH and Li3N with LiBH4. Here the products from these reactions
were studied along with the thermal desorption properties of the systems.
Acknowledgements
Well here it is, at some points I didn’t think I would make it, but I have now completed my thesis. There are many people who have helped and supported me during this work, and I owe them all a great deal of thanks. Firstly I would like to thank my supervisor Paul Anderson for all his help and guidance over the last few years. I would like to thank the other members of Paul’s group, Big Matt, Alex, Alvaro, Ivan and Trang; with a special mention to Phil Chater for continuous help with this work. I would also like to thank the rest of Floor 5 for making it an enjoyable place to work. In Met & Mat I would like to thank David Book, Allan Walton and especially Dan Reed for the use of equipment.
Many friends have given a welcome relief from work over the years and for that I am grateful. My thanks to Laird, Luke, Matt, Hank, Jack, Gemma, Yan, Carey, Becky, Tom, Tim; as well as members of Bournville Village FC and BRAT athletics club. Hopefully I will be able to see much more of you all now that this is done.
I would like to thank my family for their continued support; thanks to Mum, Dad, Ruth, Nathan, Chris, Trish, Richard, Sam, Olivia, Bethany and Josh.
Finally I would to thank my wife Chlo¨e, for telling me to do some work when I was being lazy, and for telling me to take a break when I needed one. Thank you for always believing in me.
Thank you all.
ix
Contents
Abstract v Acknowledgements vii Contents ix 1 Introduction 1 1.1 Hydrogen Production . . . 2 1.1.1 Current Production . . . 21.1.2 Hydrogen from Water . . . 3
1.1.3 Hydrogen from Biomass . . . 4
1.2 Hydrogen as a Fuel . . . 5
1.2.1 Internal Combustion Engine . . . 6
1.2.2 Fuel Cells . . . 7 1.3 Alternatives to Hydrogen . . . 8 1.4 Hydrogen Storage . . . 9 1.4.1 Molecular Hydrogen . . . 10 1.4.2 Atomic/Ionic Hydrogen . . . 13 1.4.3 Metal Hydrides . . . 13 1.4.4 Complex Hydrides . . . 15
1.4.5 Mixed Complex Hydride Anions . . . 21
CONTENTS x
1.5 Thermodynamics of Hydrogen Storage . . . 23
1.6 Hydrogen Storage Targets . . . 25
1.7 Aims . . . 27
2 Experimental 29 2.1 Solid State Synthesis under Inert Gas . . . 29
2.2 Hydrogenation . . . 30 2.3 Crystallography . . . 31 2.4 Diffraction . . . 33 2.4.1 X-ray Diffraction . . . 33 2.4.2 Powder Diffraction . . . 36 2.4.3 Neutron Diffraction . . . 38 2.5 Rietveld Analysis . . . 38 2.6 Mass Spectrometry . . . 40
2.7 Temperature Programmed Desorption . . . 42
2.8 Vibrational Spectroscopy . . . 45
2.8.1 Infrared . . . 45
2.8.2 Raman . . . 46
2.9 Intelligent Gravimetric Analysis . . . 48
2.10 AC Impedance . . . 49
2.11 Scanning Electron Microscopy . . . 50
3 Synthesis and Crystal Structure Determination of Amide- and Imide-Halides 51 3.1 Introduction . . . 51
3.2 Experimental . . . 52
3.3 Amide-chlorides: xLiNH2 +yLiCl or (y/2)MgCl2 . . . 53
3.3.1 Synthesis . . . 53
3.3.2 Raman Spectroscopy . . . 55
CONTENTS xi
3.3.4 Crystal Structure Investigation - cubic Li4(NH2)3Cl . . . . 68
3.3.5 Crystal Structure Investigation - Li3Mg0.5(NH2)3Cl . . . 74
3.3.6 Investigations into a Solid Solution Range . . . 75
3.4 Imide-chlorides: xLi2NH +yLiCl or (y/2)MgCl2 . . . 79
3.4.1 Synthesis . . . 79
3.4.2 Investigations of a Solid Solution Range . . . 83
3.5 Amide-bromides: xLiNH2 +yLiBr or (y/2)MgBr2 . . . 83
3.5.1 Synthesis . . . 83
3.5.2 Raman Spectroscopy . . . 86
3.5.3 Crystal Structure Investigation - Li7(NH2)6Br . . . 86
3.5.4 Crystal Structure Investigation - Li6Mg0.5(NH2)6Br . . . . 91
3.5.5 Investigations into a solid solution . . . 93
3.6 Imide-bromides: xLi2NH +yLiBr or (y/2)MgBr2 . . . 95
3.6.1 Synthesis . . . 95
3.6.2 Investigations into a solid solution . . . 99
3.7 Amide-iodides: xLiNH2 +yLiI or (y/2)MgI2 . . . 99
3.7.1 Synthesis . . . 99
3.7.2 Raman Spectroscopy . . . 102
3.7.3 Crystal Structure Investigation - Li3(NH2)2I . . . 102
3.7.4 Crystal Structure Investigation - Li2Mg0.5(NH2)2I . . . 104
3.7.5 Investigations into a solid solution . . . 107
3.8 Imide-iodides: xLi2NH +yLiI or (y/2)MgI2 . . . 107
3.8.1 Synthesis . . . 107
3.8.2 Crystal Structure Investigation - Li5(NH)2I . . . 110
3.8.3 Crystal Structure Investigation - Li4Mg0.5(NH)2I . . . 113
3.9 Conclusions . . . 117
4 Hydrogen Storage Properties of Amide- and Imide-Halides 119 4.1 Introduction . . . 119
CONTENTS xii
4.2 Experimental . . . 120
4.3 Temperature Programmed Desorption . . . 120
4.3.1 Amide-chlorides . . . 120
4.3.2 Amide-bromides . . . 126
4.3.3 Amide-iodides . . . 128
4.4 Rehydrogenation . . . 132
4.4.1 High-pressure H2 Reactor . . . 132
4.4.2 Intelligent Gravimetric Analysis . . . 141
4.5 Ionic Mobility . . . 146
4.6 Conclusions . . . 147
4.7 Discussions and further work . . . 148
5 Reactions of LiBH4 with LiNH2, Li2NH and Li3N 151 5.1 Introduction . . . 151
5.2 Experimental . . . 152
5.3 xLiBH4 +yLiNH2 . . . 152
5.3.1 Powder X-ray Diffraction . . . 152
5.3.2 Temperature Programmed Desorption . . . 157
5.3.3 B=N bond strength . . . 158
5.3.4 SEM . . . 161
5.3.5 Hydrogenation . . . 163
5.4 xLiBH4 +yLi2NH . . . 167
5.4.1 Powder X-ray Diffraction . . . 167
5.4.2 Temperature Programmed Desorption . . . 171
5.4.3 Hydrogenation . . . 172
5.5 xLiBH4 +yLi3N . . . 175
5.5.1 Powder Diffraction Study . . . 175
5.5.2 Temperature Programmed Desorption . . . 177
CONTENTS xiii 5.6 Conclusions and further work . . . 180
Bibliography 183
A Appendix 193
List of Figures 197
Chapter 1
Introduction
Currently the majority of the world’s energy needs are met by the use of fossil fuels: coal, oil and natural gas. The use of fossil fuel as our main energy supply is not sustainable for two main reasons: first there is only a finite supply of these fossil fuels, a supply which is rapidly depleting; secondly the carbon released by the combustion of these fossil fuels has been linked to global climate change. For these reasons there is need to find a replacement for fossil fuels with ever increasing urgency.
Before the invention of the steam engine, man’s energy requirements were met solely by the use of plants for fuel. This provided a carbon neutral cycle as the carbon released from this fuel was offset by that absorbed by plants via
photosynthesis. After the invention of the steam engine, fossil fuels could be used to increase the amount of work man was able to do, and this led to the basis of an industrialised society, with ever increasing energy demands. Since the industrial revolution, the world’s energy demands have increased dramatically, with around 80% of these needs being met by fossil fuels [1]. The use of these fossil fuels releases CO2 into the atmosphere which was stored in the ground. Already the
concentration of CO2 in the atmosphere is over 30% above the level from before
the industrial revolution and if the current rate of growth continues, the yearly rate of CO2 emissions into the atmosphere will have doubled by 2050 [2, 3].
1.1. HYDROGEN PRODUCTION 2 Hydrogen is an energy carrier, much like electricity, and as such it has the potential to help solve the world’s energy needs. It can also be seen in equation 1.1 that there is a trend in the form of energy carriers away from carbon, towards a more hydrogen rich fuel, as well as from a solid fuel to a gaseous one. While by no means an argument by itself, this suggests that hydrogen could be an ideal energy carrier to help reduce CO2 emissions.
C(s) (coal)→-CH2-(l) (oil)→CH4(g) (natural gas)→H2(g) (1.1)
1.1
Hydrogen Production
Hydrogen is comfortably the most abundant element in the universe, however, on earth less than 1% of this is found in its molecular form, H2gas. The vast majority
found on earth is in the oxidation product of water, H2O, while some is found in
liquid or gaseous hydrocarbons [4]. It is the molecular, gaseous form of hydrogen which can be used a fuel, as such the first step towards to use of hydrogen as a fuel is the synthesis of the molecular form, H2 [5]. The move to a hydrogen economy
would therefore involve the move to a synthetic fuel rather than ‘free energy’ as with fossil fuels, where the energy has been naturally stored for millions of years and the cost is associated with the mining rather than synthesis. If the worlds demand for fossil fuels were to be met by hydrogen then roughly 100 times the present production rate would be required [1], more than 3 x 10¹²kg. This move would require significant investment and the world economy would need to be convinced of the benefits.
1.1.1 Current Production
In recent years more than 90% of the world’s hydrogen has been produced by the steam reforming process [6]. Steam reforming is a fuel processing technol-ogy where hydrocarbons are converted into a hydrogen rich steam. The process
1.1. HYDROGEN PRODUCTION 3 involves the use of high temperature steam, above 500◦C, and occurs via the endothermic reaction shown in equation 1.2. Due to the formation of carbon monoxide, a water-gas shift reaction (equation 1.3) is used to turn this carbon monoxide into carbon dioxide and produce more H2 in the process.
-(CH2)-(n)+ H2O→CO + (n+1)H2 (1.2)
CO + H2O→CO2+ H2 (1.3)
Two other primary fuel processing technologies of partial oxidation and au-tothermal reforming also convert hydrocarbons in hydrogen, however, steam re-forming is by the far the most commonly used [7]. All of these techniques, how-ever, use fossil fuels as the source of the hydrogen and therefore have an overall release of CO2 from the process. While it is likely that hydrogen will continue
to be produced via this method for the short-term, it is not sustainable in the long-term due to its reliance on fossil fuels and failure to reduce CO2 emissions
[8].
1.1.2 Hydrogen from Water
Splitting water to make hydrogen and oxygen is potentially the cleanest way to produce hydrogen and there has been a great deal of research into this; in fact, its commercial use dates back to the 1890’s [7]. Despite the hydrogen not being produced from fossil fuels, how clean and sustainable the process is, is dependent upon the energy source used in the process.
The most common form of water splitting to make hydrogen isviaelectrolysis, this is simply using an electric current run through two electrodes, made of an inert metal, to break water apart to make hydrogen and oxygen. Reduction occurs at the negatively charged cathode to produce hydrogen, while oxidation occurs
1.1. HYDROGEN PRODUCTION 4 at the positively charged anode; these process are shown in equations 1.4 and 1.5, respectively. As this process is thermodynamically unfavourable, an electric potential is required to drive process. An electrolyte is added to the water to increase the rate of electrolysis.
2H+(aq)+ 2e− →H2(g) (1.4)
2H2O(l)→O2(g)+ 4H+(aq)+ 4e− (1.5)
Efficiencies from electrolysis of this type are around 70% at ambient conditions [9], however, improvements to the process can push to efficiency up as high as 85 % [10]. Electrolysis powered by electricity from renewable energy sources like wind turbines or photo-voltaics would provide a long-term and clean method of hydrogen production for the long-term.
Hydrogen can also be produced from water via thermochemical water split-ting (or thermolysis). This is the decomposition of water to hydrogen and oxygen purely by heating. Water will decompose at around 2500◦C, however, suitable heating sources are not readily available. Solar furnaces can be built which focus the suns light energy onto a small area and are capable of reaching the required temperatures [11]. This process has the advantage of using a renewable energy source in the form of sunlight. Product gases must be separated to avoid recom-bination and so that the hydrogen produced may be used.
1.1.3 Hydrogen from Biomass
Producing hydrogen from biomass is seen by many as the most likely renewable substitute to petroleum in the short-term and in the United States it is second only to hydropower as a primary renewable energy source [7, 12]. Biomass is available from a wide range of sources including animal waste, municipal wastes
1.2. HYDROGEN AS A FUEL 5 and agricultural wastes. Biomass can also be used to produce hydrogen; the main techniques for this are gasification and fermentation.
Gasification is a similar process to that of steam reformation. The biomass is heated and broken down to produce a mixture of H2, CH4, CO and CO2 amongst
other gases. Steam is then added to this mixture (eq. 1.2) to produce CO and H2 before a water-gas shift reaction (eq. 1.3) produces CO2 and further H2. The
process of hydrogen production through gasification of biomass can be considered carbon neutral; while CO2is released in the process, it is CO2which has originally
been absorbed by the plant life which forms the biomass.
Dark fermentation of biomass can produce hydrogen and carbon dioxide. These are produced alongside oxygen from the anaerobic growth of bacteria on carbohydrate rich substrates. As is the case with gasification, this process can be considered as CO2 neutral, however, this process has further advantages of being
able to use low quality biomass which requires minimal pre-treatment; further-more the system may be integrated to use the remaining substrate to produce further products such as CH4 [13].
1.2
Hydrogen as a Fuel
Chemical potential energy is the energy relating to the valence electrons in atoms or molecules and their potential to form more stable arrangements through re-action. Hydrogen has the best ratio of valence electrons available to a reaction per unit mass as it is made up of only one electron and one proton. This makes hydrogen a very attractive source of chemical potential energy.
Hydrogen as a fuel is the cleanest burning; when burnt in oxygen the only exhaust gas is water. This gives hydrogen a large advantage over petroleum by cutting CO2 emissions into the atmosphere. As hydrogen is a synthetic fuel it
also overs energy independence and security, free from the need to import fuels. Once produced, hydrogen also offers energy rich fuel; it has a lower heating
1.2. HYDROGEN AS A FUEL 6 values of 120.1 MJ kg−1, compared to that of petroleum (42.5 MJ kg−1) [14]. This energy can either be harnessed in the same way as petroleum, through an internal combustion engine (ICE), producing mechanical power, or it can be harnessed through electrochemical means using a fuel cell.
1.2.1 Internal Combustion Engine
The internal combustion engine is a well established and extremely widely used technology and in fact the first ICE was designed and built to run on a mixture of hydrogen and oxygen. This was built by Fran¸cois Isaac de Rivaz in 1807 [15]. Hydrogen as a gas can be used directly in a modern day petroleum combustion engine, with limited modifications required. The hydrogen fuel is burnt in the same way as petroleum; some of the need for modification to the engine comes from the fact that the hydrogen burns hotter. Other modifications include the need for a lubricant which is resistant to reduction and an exhaust system which is capable of withstanding the water vapour [16].
The technology of ICEs is well established and has good background of relia-bility. While the efficiency of ICEs has been fine tuned and many improvements have been made, the energy efficiency of ICEs is partially limited by Carnot cycle. This thermodynamic limitation gives a theoretical efficiency of roughly 40 %, this has been shown by some diesel engines and has been achieved by hydrogen ICEs [17]. However, the real limitation on the efficiency of an ICE comes from not being able to operate at the maximum combustion temperature. This limitation is therefore imposed by materials constraints, not thermodynamics [18].
Due to the well established ICE technologies and the potential to use the cur-rent manufacturing infrastructure, it is possible that the use of hydrogen ICEs could be a good starting point for the development of a hydrogen infrastructure and economy. ICE technology is currently cheaper than that of fuel cells and when run with hydrogen as fuel offers huge reductions in CO2 emissions. There
1.2. HYDROGEN AS A FUEL 7 could further act as a stepping stone to a hydrogen economy while still offering some reduction on CO2 emissions on a petroleum ICE [19]. Despite the
possi-ble advantages, only BMW, Ford and Mazda had active hydrogen ICE research programmes of the major automotive companies.
1.2.2 Fuel Cells
If ICEs are to be replaced then fuel cells are seen by many as the best alternative technology. Fuel cells were invented by William Grove in 1839 and are electro-chemical energy conversion devices in which electrical energy is obtained directly from the chemical energy of a reaction. There is a large variety of fuel cells, char-acterised by the type of electrolyte used; some of the most common electrolytes are alkaline, solid oxide, phosphoric acid and polymer membrane. When used with hydrogen, produced from a sustainable source, as a fuel, fuel cells are seen as the best way to a clean energy future [20].
Polymer electrolyte membrane (or proton exchange membrane) fuel cells, PEMFC, are the primary candidate for next generation power sources for trans-portation applications due to a number a key advantages. The first of these advantages is that, when hydrogen is used as the fuel, the only exhaust gas is water, using oxygen from the air as the oxidant. Other advantages include the ability to work with high efficiencies at low temperatures of around 70◦C giving quick start up times; they have a high power density and can easily be scaled up
via the use of a fuel stack to further increase the power density [21]. A disadvan-tage of PEMFCs is that the performance of the fuel cell is negatively affected by the presence of low levels of contaminants in the fuel supply such as ammonia, carbon monoxide and organic compounds [22]. One other problem with the large-scale use of PEMFCs is the high cost, relative to ICEs; including the high cost of materials such as platinum for electrode catalysts. However, as the technologies have improved the cost has reduced by around 30% in the last 5 years and is expected to continue to fall.
1.3. ALTERNATIVES TO HYDROGEN 8 In a PEMFC, hydrogen gas is supplied to the anode, where a catalyst (usu-ally platinum) splits the hydrogen into protons and electrons (equation 1.6). The polymer membrane itself acts as the electrolyte and allows the protons to per-meate through but does not conduct electrons, therefore forcing these through an external circuit, producing electric power. At the cathode, oxygen, from air, combines with the protons and electrons to produce water (equation 1.7). A schematic of a PEMFC is shown in figure 1.1. Several automotive compa-nies have produced cars using PEMFCs for the power supply including Toyota, Honda, General Motors, Hyundai, Kia and Daimler [21].
2H2 →4H++ 4e− (1.6)
O2+ 4H+→H2O (1.7)
Figure 1.1: Schematic representation of a PEMFC, adapted from ref. [23].
1.3
Alternatives to Hydrogen
There are many different technologies available and currently being researched to replace fossil fuels and/or lower greenhouse gas emissions. For mobile applications
1.4. HYDROGEN STORAGE 9 these include liquified petroleum gas (LPG) and biofuels. While made from fossil fuels, LPG has significantly lower CO2 emissions than petrol and can be used
in petrol ICEs with minor modifications. Biofuels can be made from different sources including food crops. The oil from these can either be used directly (biodiesel) or they can be treated to produce ethanol; both routes have lower emissions than petrol or diesel. However, the main alternative to hydrogen as a replacement for fossil fuels is the direct use of electricity, stored in batteries.
As mentioned previously, hydrogen needs to be synthesised, potentially via
the process of electrolysis. The hydrogen is then converted back to electrical energy in a fuel cell as discussed in the previous section. This conversion of energy into hydrogen and back again has an effect on the efficiency of the hydrogen-fuel cell system compared to using electricity directly. Typically a hydrogen fuel efficiency is roughly two thirds that of a battery in the same system [24, 25].
This energy efficiency is a big advantage of the use of batteries in mobile applications. A further, and even bigger, advantage of batteries is that the in-frastructure required for the use of this technology is already in place. Conversely the move to the use of hydrogen would need a huge amount of investment. One significant disadvantage to the use of batteries for mobile applications is that in contrast to a fuel cell which, if provided with fuel, can run continuously, a battery needs recharging which can take several hours; and the ranges between charges are currently low. It is likely that the majority of fuel cell vehicles will use a hybrid system, combining a battery and a fuel cell, to meet the energy demands for mobile applications [26].
1.4
Hydrogen Storage
The storage of hydrogen for use in mobile applications involves a balance and compromise between two properties of the storage system; the volumetric and gravimetric capacities.
1.4. HYDROGEN STORAGE 10 Hydrogen has a density of 0.0899 kg m−3 at ambient temperatures and pres-sures. To travel around 400 km in a car, 4 kg of hydrogen would be required when used with a fuel cell; this compares favourably to 8 kg of hydrogen for use with an ICE or 24 kg of petrol in an ICE. However, due to its extremely low volumetric density, this 4 kg of hydrogen would take up an extremely impractical volume of 44 m3 [4]. It is therefore clear that the challenge of volumetric storage capacity is to reduce this large volume of hydrogen. However, this increase in volumetric capacity will always have an effect on the gravimetric capacity of the system. For consideration of the gravimetric capacity of the system we need to consider not only the hydrogen itself but also any other material used in the system, for example, the vessel in which the hydrogen is contained. As such, a compromise between the volumetric and gravimetric storage capacities of the overall system must be made.
There are two broad categories of hydrogen storage which cover a range of different methods; these are storage of molecular hydrogen via the compression or liquefaction of hydrogen gas, or by adsorption onto a surface, or the storage of atomic/ionic hydrogenvia reaction to form metal hydrides/complex hydrides.
1.4.1 Molecular Hydrogen
Compressed Gas
The storage of hydrogen at high pressures as a compressed gas is the most com-monly used today. As this is also the most common storage technique for many other gases, the infrastructure is in place and any safety issues for handling high pressure gases are well understood. Traditionally hydrogen is stored at pressure of 200 bar in reasonably cheap steel vessels. This improves the volumetric capacity, although the volume required for 4 kg of hydrogen is still 225 litres [4]; however, the gravimetric cost of storing hydrogen at this pressure comes mainly from the mass of the steel required. This makes the overall system have a gravimetric
1.4. HYDROGEN STORAGE 11 capacity of roughly 1 wt % hydrogen [5]. Higher pressures can be achieved, how-ever, with the use of steel for the vessel, this only lowers the gravimetric capacity further.
While the majority of cylinders being made at the moment are stainless steel, copper or aluminium alloys, research has been carried out into the use of carbon fibre gas cylinders. These cylinders are lightweight and have a high density; they are capable of having a gravimetric hydrogen capacity of 10 wt % by storing the hydrogen at pressures of up to 1000 bar [5]. There are obvious advantages in the storage capacities of these extremely high pressure cylinders. However, there are also significant disadvantages, first there are problems relating to the safety of having such high pressure gas in mobile systems. There are also issues with the complexity of the system required to step the pressure down to a usable pressure. Finally there is the issue of the cost, financially and also in terms of energy, of compressing the gas to such great pressures, energy which can not be reclaimed upon using the gas [27].
Liquefaction
Hydrogen is a liquid at temperatures below−252◦C; in this state the hydrogen has a gravimetric density of 70.8 kg m−3. This is the highest density of hydrogen in any state and is a significant improvement on compressed gas storage which has gravimetric densities of <40 kg m−3 at realistic pressures (<800 bar) [1].
Liquefaction of hydrogen is unfortunately a very inefficient way of storing hydrogen. First there is the energy cost of cooling the hydrogen to the required temperature. This is extremely energy intensive, using roughly 30 % of the chemical energy of the liquefied hydrogen in the process [5]. There is then the problem of maintaining these low temperatures to prevent boil off. Even with the best available thermal insulation, hydrogen boil off cannot be reduced below around 1% a day in tanks large enough to be suitable for mobile applications. There are also the issues concerned with cooling all the components required
1.4. HYDROGEN STORAGE 12 for the delivery and storage of the liquid hydrogen; this adds further cost both financially and energetically. These issues will limit the use of liquified hydrogen and make it unlikely to be used on a wide scale.
Physisorption
The two conventional methods of hydrogen storage discussed so far seem unlikely to solve the problem of hydrogen storage. The most likely alternative is the use of solid state storage. Here I discuss the use of physisorption, a way of storing molecular hydrogen in the solid state. In the following section I discuss solid state storage methods for atomic/ionic hydrogen (chapter 1.4.2).
Physisorption is the binding of hydrogen to or inside a host through weak interactions, generally van der Waals forces. As these interactions are weak, typ-ically 2 - 20 kJ mol−1H2 [1], therefore the thermal energy at room temperature is
enough to desorb the hydrogen. This restricts significant hydrogen adsorption to low temperatures (typically with liquid nitrogen as a coolant) or high pressures. Hydrogen will bind most strongly to the surface of the host solid, with subse-quent layers binding more weakly. Therefore materials used for physisorption of hydrogen must have high surface areas. Typical materials include zeolites, metal organic frameworks (MOFs), covalent organic frameworks (COFs) or polymers of intrinsic microporosity (PIMs).
Zeolites are aluminosilicate based materials and were the first inorganic porous materials to be investigated for gas storage; hydrogen storage capacities of around 1.8 wt % have been seen [28, 29]. MOFs are made up of inorganic clusters connected via organic linkers and like zeolites, they can use binding to metal centres to increase hydrogen uptake [30]. Through this, gravimetric capacities of over 6 wt % have been obtained at 77 K [31]. COFs are similar to MOFs but rather than the organic units being held together by metals ions, they are held together by strong covalent bonds between light elements (C, O, B, Si, N) [32]. Due to having low densities and permanent, high porosity they are thought
1.4. HYDROGEN STORAGE 13 to be promising for us for storing hydrogen [33]. PIMs are polymers with rigid structures which are unable to pack efficiently, this gives them large free volume and inner surface [34]. They have a range of potential applications including hydrogen storage where they have been shown to have gravimetric capacities at 77 K of around 2.7 wt % [35].
These materials for hydrogen storage tend to be relatively cheap and simple in design. However, the low temperatures required for hydrogen storage along with relatively poor gravimetric and volumetric storage capacities.
1.4.2 Atomic/Ionic Hydrogen
Atomic/ionic hydrogen can be chemically bound in a metal-based compound. The hydrogen adsorption process first involves a chemisorption step where the hydrogen molecule is dissociated at the surface before diffusing into the bulk material and forming the chemical bond. There is therefore a relatively strong chemical bond to the hydrogen and the transition back to the original material requires an increase in temperature or reduction in pressure.
In the following two sections I will discuss first the use of metal hydrides as hydrogen storage before moving onto the use of complex hydrides.
1.4.3 Metal Hydrides
Stoichiometric ionic hydrides are formed from the alkali and alkaline earth metals (e.g. MgH2), whereas transition metal hydrides are seen to form non-stoichiometric
interstitial hydrides (e.g PdH0.6). Figure 1.2 shows a typical pressure-composition
isotherm [1]. This can be used to understand the formation of interstitial hy-drides. At low pressure hydrogen is dissolved into the lattice of the host metal, forming a solid solution (α phase). At higher pressures more hydrogen is ab-sorbed, forming an ordered hydride phase (β phase). The area of interest of this graph is the plateau region where both theαandβphases co-exist. In this region the amount of hydrogen in the metal may be easily changed by changes in
pres-1.4. HYDROGEN STORAGE 14 sure or temperature. Above a certain temperature, Tc this plateau behaviour is
lost and a continuous transition between the two phases is seen.
H/M
Pressure(bar)
α
α
+
β
β
Figure 1.2: A pressure-composition-temperature plot for a metal hydride [1]
Metal hydrides have high volumetric hydrogen capacities, more than six times higher than that of hydrogen stored as a compressed gas at 200 bar [36]. However, metallic hydrides can be split broadly into two groups with opposing advantages and disadvantages for hydrogen storage applications.
The first of these groups is the intermetallic metal hydrides, for example LaNi5H6. This material has an extremely high volumetric hydrogen capacity with
a density of 115 kg H2 m−3(compared to 70.8 kg H2m−3for liquid hydrogen) and
will release all of the hydrogen at pressures below 2 bar H2 [1]. While LaNi5H6
is an excellent hydrogen storage material, for mobile applications the mass of the elements is too high, giving a gravimetric storage capacity of only 1.5 wt % H2.
This is the main issue with all intermetallic hydrides, with gravimetric capacities being limited to <4 wt % H2 making them impractical for mobile applications
[5].
The next group of materials is the light metal hydrides, through the use of light, alkali and alkaline earth metals, large increases in the gravimetric storage
1.4. HYDROGEN STORAGE 15 capacities of metal hydrides can be achieved. Magnesium hydride, MgH2, has the
highest gravimetric storage capacity of the metal hydrides with proven reversibil-ity with a gravimetric capacreversibil-ity of 7.7 wt % H2. However, the problematic issue
with MgH2, along with other light metal hydrides, is the slow rates of hydrogen
release and uptake [37]. The kinetics of the de/rehydrogenation reactions have been improvedvia the use of mechanical milling, with and without precious met-als, and the inclusion of LiBH4 [38]. However, temperatures greater than 275◦C
are still required for reasonable rates of hydrogen release and uptake.
1.4.4 Complex Hydrides
Many different metal-hydrogen complexes can be formed from the simple metal hydrides discussed previously. In these materials, hydrogen is covalently bonded to a central atom to form a complex anion. This then forms an ionic bond to a metal cation [39]. The complex anions which will be discussed here are aluminium hydrides, AlH4−, amides, NH2− and borohydrides, BH4−. Along
with heavier, transitions metals, complex hydrides form with most alkali and alkaline earth metals. When they are formed with light metals such as lithium, magnesium, sodium and aluminium they have high gravimetric storage capacities and are considered to be among the best candidates for hydrogen storage in mobile applications.
Aluminium Hydrides
Lithium and sodium aluminium hydrides (or alanates) can be synthesised directly from the elements or through reaction of aluminium halides with the appropriate metal hydride in solution [40]. While magnesium aluminium hydride can be easily prepared from NaAlH4 and MgH2 via a salt metathesis reaction [41].
LiAlH4 and NaAlH4 have high gravimetric storage capacties of 10.5 wt % H2
and 7.4 wt % H2 respectively. These two aluminiun hydrides release hydrogen via the two step reaction shown in equation 1.8, The first step of
decompos-1.4. HYDROGEN STORAGE 16 tion of LiAlH4 beginning at around 190◦C, with the second step at 230◦C [42].
In the case of NaAlH4 the two stages begin at around 210◦C and 250◦C [43].
Decomposition of the relevant metal hydride will occur at considerably higher temperatures.
3MAlH4 →M3AlH6+ 2Al + 3H2→3MH + 3Al + 9/2H2 (1.8)
Mg(AlH4)2 also has a high gravimetric storage capacity of 9.4 wt % H2 and
releases hydrogen at the lower temperature of 163◦C [41]. However, this decom-position is a one step reaction without the formation of an (AlH6)3− complex
anion as shown in equation 1.9.
Mg(AlH4)2 →MgH2+ 2Al + 3H2 (1.9)
Only the rehydrogenation of NaAlH4 is thermodynamically favourable under
moderate conditions of the considered aluminium hydrides, and further kinetic issues mean that full rehydrogenation of this system requires temperatures greater than 250◦C and pressures of 150 bar H2 [39]. The kinetics of hydrogenation
were greatly improvedvia Ti doping, this gave a decomposition temperature of 150◦C and full hydrogenation at 170◦C and 152 bar H2 [44]. While the potential
gravimetric hydrogen capacity of this system is 7.5 wt % H2, cycling studies of
the NaAlH4 doped with titanium gave a reversible capacity of 3 - 4 wt % H2 [45].
Amides
The complex amide anion (NH2−), along with the partially dehydrogenated imide
anion (NH2−), have high gravimetric hydrogen storage capacities when in com-pounds with light metals. LiNH2 was synthesised as early as 1894 and it was
later shown that LiNH2 can readily be formed from reaction of the molten metal
1.4. HYDROGEN STORAGE 17 Other amides such as sodium and potassium can also be synthesised this way. The synthesis of Mg(NH2)2was also reported by reaction of Mg3N2or magnesium
metal with ammonia, however, the reaction would take days to go to completion [47]. More recently the reaction of MgH2 with ammonia has been used to form
Mg(NH2)2 more readily [48].
Pure LiNH2 decomposes to lithium imide, Li2NH, and ammonia. However,
the breakthrough in the use of the system for hydrogen storage came from be-ginning at the fully dehydrogenated product, lithium nitride, Li3N. It was seen
that Li3N could absorb 9.3 wt % H2in a two step process shown in equation 1.10
[49]. This reaction was shown to be fully reversible with a theoretical gravimetric capacity of 10.4 wt % H2.
Li3N + H2↔Li2NH + LiH + H2 ↔LiNH2+ 2LiH (1.10)
The first step of this reaction was not found to be readily reversible, requir-ing temperatures in excess of 400◦C for hydrogen release and having very slow hydrogen uptake. The second step of this reaction, however, is reversible under realistic conditions for hydrogen storage applications, with a good gravimetric storage capacity of 6.5 wt % H2. Due to its obvious promise this reaction has
been subject to extensive research, although the mechanism is still not com-pletely understood. It was first thought that it was direct reaction of LiNH2
with LiH to give Li2NH with H2 [49]. However, the mechanism was investigated
further and it was concluded that it was in fact a two stage reaction where LiNH2
first decomposed to Li2NH and NH3 (equation 1.11) before the NH3 then reacts
rapidly with LiH (equation 1.12) [50]. It was also concluded that the mechanism of hydrogen release involved the combination of protic (δ+) hydrogen bonded to nitrogen atoms and hydridic (δ−) hydrogen bonded to the lithium [51]. Lithium ion mobility has also been highlighted as a key factor in both stages of equation 1.10. There is a structural relationship between LiNH2 and Li2NH which
main-1.4. HYDROGEN STORAGE 18 tains a face centred cubic nitrogen lattice, with a topotactic de/rehydrogenation equating to the diffusion of Li+and H+into and out of the bulk. This is thought to occurvia a solid solution of the form Li(1+x)NH(2−x) [52].
2LiNH2 →Li2NH + NH3 (1.11)
NH3+ LiH→LiNH2+ H2 (1.12)
As is the case with LiNH2, Mg(NH2)2 decomposes to magnesium imide,
MgNH, with the release of ammonia, however, the rate of the reaction is ex-tremely slow. The decomposition of Mg(NH2)2 with MgH2 was investigated and
it was initially found that only the desorption from Mg(NH2)2was seen [48];
how-ever, it was later found that hydrogen desorption was seen after energetic ball milling of the mixture [53]. Despite occurring at a lower temperature than the LiNH2 reaction, it took 72 hours to complete the hydrogen desorption, showing
that the kinetics of this system are too slow for practical use.
To try and tune the thermodynamics and kinetics of amide system, mixed lithium and magnesium combination systems have received much research inter-est [54, 55]. As LiH is known to react extremely quickly with NH3 [50], a system
of Mg(NH2)2-2LiH was investigated and it was found to form a mixed
lithium-magnesium imide as show in equation 1.13. This system was found to reversibly store around 5.5 wt % H2 at 200◦C and 35 bar [56]. A system of 2LiNH2-MgH2
has also been investigated, however the products from the decomposition, rehy-drogenated back to Mg(NH2)2-2LiH as this is the thermodynamically favourable
product [54].
1.4. HYDROGEN STORAGE 19 Further research has been carried out into the optimisation of these amide systems for hydrogen storage applications including the use of ball milling to reduce particle size [57] and the use of catalysts which have been shown to increase the rate of hydrogen release, however, it should be noted that the particle size of the catalyst is also important [58].
Borohydrides
Borohydrides have been known for many years, having first been synthesised as early as 1940 via the reaction of ethyllithium and diborane [59], and later syn-thesised from the relevant metal hydride [60]. Borohydrides are strong reducing agents and are widely used in organic chemistry, however, in recent years there has been much research into their potential use for hydrogen storage applications. Lithium borohydride, LiBH4, is one of the most promising materials for
hy-drogen storage applications with a gravimetric hyhy-drogen capacity of 18.5 wt % and a volumetric density of 121 kg H2 m−3. The decomposition gives only LiH
as a crystalline product, through the reaction shown in equation 1.14. This hy-drogen release from the decomposition does not begin until over 280◦C, with the main release of hydrogen occurring at over 380◦C, although this temperature can be significantly lowered by the addition of SiO2 [61]. This process does not
release all of the hydrogen and therefore has a gravimetric storage capacity of 13.9 wt % H2.
2LiBH4→2LiH + 2B + 3H2 (1.14)
The exact mechanism of the decomposition of LiBH4 is still not fully
under-stood, however, it is known that equation 1.14 is not the complete story. The decomposition is thought to govia an intermediate, with computational studies giving the phase Li2B12H12 as the most likely [62]. The presence of this
1.4. HYDROGEN STORAGE 20 The desorption from LiBH4 is a reversible process, however, rehydrogenation
re-quires harsh conditions of 600◦C and 350 bar. Even under these conditions the absorption is not completed after 12 hours [65].
As these conditions are considered too severe for mobile applications, several techniques have been tried to improve the reversibility of LiBH4. These include
the destabilisation of LiBH4 by the addition of another material, the use of
cat-alysts or by nano-structuring.
A much researched form of destabilisation is the use of a 2LiBH4-MgH2system
which gives a different decomposition pathway (equation 1.15) to that of pure LiBH4. This system still has high gravimetric storage capacity of 11.6 wt % H2
and has been shown to have improved thermodynamics, releasing hydrogen from above 250◦C and absorbing greater than 10 wt % H2 at 400◦C and 24 bar [66].
2LiBH4+ MgH2→2LiH + MgB2+ 4H2 (1.15)
The addition of catalysts has a significant affect on reducing the dehydrid-ing temperature of LiBH4, as previously mentioned with the use of SiO2 [61].
The lowest hydrogen desorption temperature was achieved with a mixture of LiBH4-0.2MgCl2-0.1TiCl3, where hydrogen release began at 60◦C. This mixture
desorbed 5 wt % H2 at 400◦C and absorbed 4.5 wt % H2 at 600◦C and 70 bar
[67].
One method of nanoengineering which has been researched is the incorpora-tion of LiBH4 into an activated carbon (AC) scaffold. This LiBH4/AC composite
material had a hydrogen desorption temperature over 150◦C lower than that of bulk LiBH4 (around 220◦C); the dehydrogenation conditions were also
signifi-cantly lowered and the rate increased by over an order of magnitude [68]. Two other metal borohydrides which have received interest as hydrogen stor-age materials are that of sodium and magnesium borohydride. NaBH4 releases
1.4. HYDROGEN STORAGE 21 but significant release is not seen until closer to 550◦C. The difference to the decomposition of LiBH4 is that NaH decomposes at a much lower temperature
than LiH and therefore the decomposition of NaBH4 goes through to sodium
metal [69]. Mg(BH4)2 has an extremely high gravimetric storage capacity,
de-composing at temperatures greater than 300◦C to form MgB2, while releasing
14.8 wt % H2. Rehydrogenation of over 11 wt % H2 has been seen, although high
pressures (>600 bar) are required [70]. Recent work has reported a porous form of Mg(BH4)2. This nanostructuring has been shown to improve the kinetics of
both hydrogen desorption and uptake [71].
1.4.5 Mixed Complex Hydride Anions
In an attempt to tune the thermodynamics of complex hydride systems while maintaining a high gravimetric capacity, research has been done into light-metal mixed-anion complex hydrides, combining two different complex hyrdide anion groups.
Reaction of LiNH2 and LiBH4 gave rise to new crystalline compounds at
mo-lar ratios of both 1:1 and 3:1. These materials are considered as Li2BH4NH2 and
Li4BH4(NH2)3 as structural work confirmed that the NH2− and BH4− groups
remain within the new structures [72, 73]. These new compounds formed at a 1:1 and 3:1 ratio have high hydrogen storage capacities of 13.5 and 11 wt % H2,
respectively, and release this hydrogen at temperatures of around 250◦C. It is thought that combining the protic hydrogen from the amide group and the hy-dridic hydrogens from the borohydride group in one compound may be beneficial to the hydrogen desorption process. However, the decomposition product from these materials is Li3BN2 which has so far only shown limited reversibility [74].
An analogous sodium amide-borohydride can also be synthesised of the form Na2BH4NH2. This system releases around 7.8 wt % H2 from roughly 290◦C,
accompanied by a small amount of ammonia [75]. More recent work has focussed on a mixed aluminium hydride-borohydride material using both LiBH4-NaAlH4
1.4. HYDROGEN STORAGE 22 and LiBH4-LiAlH4-CaCl2 [76]. While not forming new, distinct, mixed phases,
the work suggested altered thermodynamics to the pure systems.
1.4.6 Halides in Hydrogen Storage
Halide containing materials have been used with metal hydrides and complex hydrides for hydrogen storage applications for many years. For the most part, these have been used as catalysts to tune the kinetics and thermodynamics of the de/rehydriding process. Examples of this have been discussed in the previous sections where TiCl3 was used to dope NaAlH4, giving a significant reduction in
the conditions required for hydrogen release and uptake [44]. Similarly a mixture of MgCl2 and TiCl3 was used to improve the de/rehydriding conditions of LiBH4
[67].
Further extensive research has been carried out into using transition metal halides to catalyse similar reactions, TiCl3, TiCl4, AlCl3 and VCl3 have all been
used with LiAlH4 and have been shown change the decomposition pathway and
reduce the decomposition temperature by over 50◦C [77]. The effect of various transition metal halides, namely TiCl3, VCl3, ScCl3 and NiCl2, have been tested
on the de/rehydriding kinetics of the Li-Mg-N-H complex hydride system. It was found that a significant decrease in the hydrogen desorption temperature was achieved, however, after cycling, no significant kinetic effect remained from the catalytic doping [78]. The effects of halide based additives were also investigated in the decomposition of MgH2. It was found that transition metal halides such
as ZrF4, VCl3 and TiCl3 had a significant effect on reducing the decomposition
temperature of MgH2 [79].
While this work has focussed on the use of transition metal halides as cat-alysts, more recent research has looked into the incorporation of halides anions into the structures of complex hydrides. Research has been carried out into io-dide substitution in LiBH4. It was found that no new distinct phase was formed
1.5. THERMODYNAMICS OF HYDROGEN STORAGE 23 research focussed on the high lithium ion conduction of this material as compared to pure LiBH4, particularly at low temperatures [81], it has also been seen that
this material rehydrides much more readily than pure LiBH4 [80]. Similar
re-search has been carried out into fluoride and chloride doping of Ca(BH4)2. While
it was found that this doping could change the decomposition pathway from that of pure Ca(BH4)2, it was calculated that the thermodynamics of the system
would only have a limited change (<10◦C on the decomposition temperature) [82]. There has also been limited research done on halide doped lithium amide. A bromide-doped amide of the form, Li2NH2Br was synthesised in 1994 and more
recently an imide doped material of the form Li3(NH2)2I [83, 84]. Again these
materials were predominantly researched as fast lithium ion conductors and not for hydrogen storage properties.
1.5
Thermodynamics of Hydrogen Storage
The thermodynamic properties of a hydride material can be used to predict and/or explain the hydrogen storage properties of the material; the relationship between the two properties has been discussed in great detail [85].
If you consider the decomposition of a metal hydride as shown in equation 1.16, this can be related to the thermodynamic parameters shown in equation 1.17. In this equation ∆H◦dec is equal to the negative of the standard enthalpy of formation of the hydride, ∆H◦f.
MHn→M +n/2 H2(g) (1.16)
∆G◦dec= ∆H◦dec−T∆S◦dec (1.17)
In the majority of cases the entropy term in equation 1.17 will be dominated by the change from an ordered solid in the metal hydride to disordered gaseous
1.5. THERMODYNAMICS OF HYDROGEN STORAGE 24 hydrogen. Therefore it can be said that ∆S◦dec≈S(H◦2) = 130.7 J mol−1 K−1. For a stable hydride thermodynamically to decompose, ∆G◦dec must fall below zero. This occurs when at the decomposition temperature, Tdec, is reached and the
entropy factor overcomes the enthalpy contribution. At this point where ∆G◦dec falls below zero and thermal decompostion can proceed, it can be said that:
0 = ∆H◦dec−(n/2)TdecS(H2)◦ (1.18)
and from this the thermal decomposition temperature can be calcluated from equation 1.19.
Tdec = (∆H◦dec/n)(2/S(H2)◦) (1.19)
In this equation the term, (∆H◦dec/n) is equal to the negative of the enthalpy of formation of the hydride per atom of hydrogen atom stored. From equation 1.19 it can be shown that to reach an equilibrium pressure of 1 bar at 300 K, the standard enthalpy of formation of the hydride for each hydrogen atom stored should be +19.6 kJ molH−1. Therefore the ideal decomposition reaction from a
metal hydride should be endothermic, so that the rehydriding reaction may be thermodynamically favourable.
This method is a relatively easy and extremely useful tool for predicting the re-versible hydrogen storage properties of metal hydrides, however, materials which do not match the criteria from this method should not be ruled out immediately. It is generally considered that when used with a fuel cell, the supply of hydrogen will be required to be at a pressure greater than 1 bar; equally, for rehydrogena-tion to proceed at high enough rates, pressures of considerably higher than 1 bar will be required. It is therefore likely that some reactions which are irreversible at 1 bar and 300 K will be reversible at increased pressures. A different consider-ation altogether is the kinetics of a reaction, this is not easily predicted and will have a major effect on the reversibility of a material.
1.6. HYDROGEN STORAGE TARGETS 25
1.6
Hydrogen Storage Targets
With the main problems of hydrogen storage for use as a fuel being related to the gravimetric and volumetric capacities of the storage system, the most demanding challenge is to use in mobile applications, where both the size and weight of the storage system are critical. The U. S. Department of Energy has set out criteria for the practical use of hydrogen storage in mobile applications [86]. As further knowledge of the working of hydrogen vehicles was gained, these targets were considered to be extremely optimistic and have since been revised. A selection of the current targets are shown in table 1.1; along with the criteria set out here the system must be of a low enough cost to be commercially viable as well as meeting all safety regulations.
Storage Parameter Current 2017 Ultimate
Gravimetric capacity 4.5 wt % 5.5 wt % 7.5 wt %
Volumetric capacity 0.028 kg H2 L−1 0.040 kg H2 L−1 0.070 kg H2 L−1
Delivery temperature −40 / 85◦C −40 / 85◦C −40 / 85◦C
Delivery pressure 5 bar 5 bar 3 bar
Cycle life 1000 1500 1500
System fill time (5 kg) 4.2 mins 3.3 mins 2.5 mins
Table 1.1: Selected targets for onboard hydrogen storage systems for light-duty vehicles [86].
It should also be taken into account that these criteria are for the whole system, not just, in the case of solid state storage, the storage material itself. This has to therefore include the storage vessel itself, as well as any other components such as heat exchangers or pressure regulators that may be required for use of the hydrogen storage system with a fuel cell or ICE. The general term for this is the ‘balance of plant’ and it needs to be taken into consideration that the hydrogen storage material itself will need significantly higher capacities (particularly the gravimetric capacity) than the figures quoted in table 1.1 to compensate for this. These criteria put serious constraints on the hydrogen storage technology that can be used and as of yet no single system has met all of these criteria.
1.6. HYDROGEN STORAGE TARGETS 26 Serious reduction from the quoted hydrogen storage capacities of certain systems can be incurred when the a full hydrogen storage system is considered with these criteria. For example, storage through physisorption in framework materials such as zeolites or MOFs can give high gravimetric storage capacities as previously discussed. However, to meet these criteria the hydrogen must be delivered at pressures of 3 - 5 bar for use with a fuel cell (35 bar for ICE). This severely limits the amount of hydrogen that can be desorbed from these systems. Similarly, complex hydrides may offer high gravimetric hydrogen capacities, however, only a small proportion of this hydrogen may be released at the desired operating temperatures (<100◦C) and considerably higher temperatures may be required to release all of the hydrogen.
These are just a couple of examples in which it is demonstrated that the meeting of the criteria will be extremely challenging. Further research is required to find a system to store hydrogen reversibly at temperatures between−40 and 85◦C at moderate pressures, with a high volumetric and gravimetric capacity, whilst also being safe and low cost.
1.7. AIMS 27
1.7
Aims
Complex hydrides are identified as the most likely hydrogen storage materials to fulfil the criteria for a high gravimetric storage capacity combined with favourable de/rehydrogenation conditions. Two of the most promising complex hydride hydrogen storage systems to date are that of LiNH2-LiH system and the mixed
amide-borohydride, Li4BH2(NH2)3.
The aims of this project were to investigate new mixed anion complex hydrides
via halide doping of LiNH2 in the hope of improving the thermodynamics and
kinetics of the system. Also to investigate fully the amide-borohydride system, in particular looking at the decomposition product, Li3BN2, and investigate other
areas of the system, namely the interaction of LiBH4 with the partially and fully
Chapter 2
Experimental
2.1
Solid State Synthesis under Inert Gas
All manipulations in this work were performed under inert conditions due to the materials being used having a high reactivity towards moisture and oxygen. The samples were weighed out on an analytical balance (up to an accuracy of 0.1 mg) in an argon filled glove box (MBraun, UniLab, <1ppm O2, <0.1ppm H2O) and
ground together by hand using a pestle and mortar.
After being prepared in the glove box, samples were transferred into a quartz reaction tube (0.5” O/D), sealed with a Young’s tap T-piece with an Ultra-torr⃝R fitting before being removed from the glove box. The quartz reaction tube was then clamped in place so that the sample was in the centre of the hot zone of the vertical tube furnace (Lenton Furnaces, LTF 12/25/250 fitted with a Eurotherm 3216P1 controller). Argon gas was then connected to the T-piece so that it flowed over the reaction, first purging the gas line of air before opening the Young’s tap. In general, a ramp rate of 2◦C min−1 was used so that the furnace would accurately control the temperature, with the reaction being held at temperature for 12 hours before being allowed to cool at around 1−2◦C min−1.
2.2. HYDROGENATION 30
2.2
Hydrogenation
Hydrogen absorption reactions were performed under pressures of up to 100 bar H2; these were carried out in a stainless steel reactor connected to a gas manifold
(figure 2.1). Reactions were performed at temperatures up to 400◦C for times between 1 and 60 hours.
H
2Ar
Fume
cupboard
Vacuum pump
Reactor
vessel
Plug valvePressure release valve Pressure gauge
Figure 2.1: Schematic diagram of the gas manifold.
Initial sample manipulations were carried out in an argon filled glove box due to the air sensitive nature of these materials. Samples were loaded into quartz tubes and then placed into the stainless steel reactor. The reactor was then sealed using a torque wrench set to 90 Nm2, before being removed from the glove box. The reactor was connected to an argon filled manifold system, the whole system was then evacuated and purged with a low pressure of hydrogen. The manifold system is fitted with a pressure gauge and pressure release valve.
The pressure of hydrogen was then set to a pressure below 100 bar to allow for the increase in pressure with temperature (≈ 80 bar). A furnace was then fitted around the reactor vessel and the temperature set. At all stages of this process hydrogen detectors were used to check for leaks in the system. Once the furnace program has been completed the hydrogen gas was allowed to vent before
2.3. CRYSTALLOGRAPHY 31 the system was evacuated and purged with argon. The reactor vessel was then disconnected from the manifold before being opened with an argon filled glove box.
2.3
Crystallography [87, 88, 89]
When in the solid state [87], all crystalline materials adopt a regular arrangement of atoms in three dimensions. The unit cell of a structure is defined as the simplest portion of the structure which, through translational symmetry, can give the full structure. The lattice parameters of a unit cell are the three lengths of the unit cell and the angles between them, the lengths denoteda,band c, and the angles α,β and γ. Different combinations and relationships between these lengths and angles give rise to seven different crystal systems with varying levels of symmetry; these are shown in table 2.1.
In these materials, an array of equivalent points (or atoms) in three dimen-sions is defined as a lattice. The environment of an atom placed at one of these points would be identical to that of an atom on any other equivalent point. Lat-tices do not give information on the atomic positions within space, but show the translational symmetry of a structureviathe locations of equivalent positions. In three dimensions there are four potential lattice types in crystals. The simplest of these is a primitive cell (P), which contains only a single lattice point at the corners of the cell. The addition of a lattice point at the centre of the unit cell gives a body centred cell (I), while the addition of further lattice points in the centre of all the cell walls gives a face centred cell (F). It is also possible to have lattice points at the centre of just one unit cell wall; by convention these are denoted as C lattices where the lattice point is located at the centre of the ab
plane. The combination of these four lattice types with the seven crystal types gives fourteen possible combinations, these are known as Bravais lattices and are shown in table 2.1.
2.3. CRYSTALLOGRAPHY 32 As discussed, crystal structures are described by their lattice parameters, but they are also described by atomic positions within the unit cell as well as the internal symmetry of the cell. Atomic positions are described as fractional coordinates along each unit cell direction from one corner. Atoms within a unit cell result in further symmetry elements being required to describe the Bravais lattice. The combination of all the symmetry elements gives rise to 230 possible space groups which then completely describe the symmetry within a unit cell.
Crystal system Unit cell dimensions Essential symmetry Allowed lattices
Cubic a =b =c Four threefold axes P, I, F
α =β =γ = 90◦
Tetragonal a =b ̸=c One fourfold axis P, I
α =β =γ = 90◦
Orthorhombic a ̸=b ̸=c Three twofold axes P, I, F, C
α =β =γ = 90◦
Hexagonal a =b ̸=c One sixfold axis P
α =β = 90◦ γ = 120◦
Rhombohedral a =b =c One threefold axis R (P)
α =β =γ ̸= 90◦
Monoclinic a ̸=b ̸=c One twofold axis P, C
α =γ = 90◦ β ̸= 90◦
Triclinic a ̸=b ̸=c none P
α ̸=β ̸=γ ̸= 90◦
Table 2.1: The 7 possible crystal systems and 14 Bravais lattices
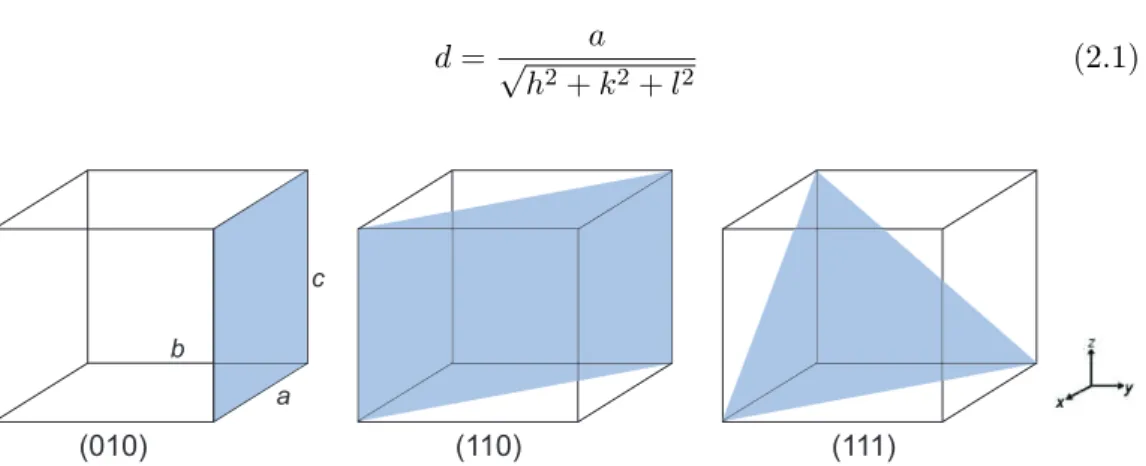
Lattice points which form a repeatable array in three dimensions can be con-nected together to form lattice planes. These planes are part of a repeatable, equally spaced set and each lattice point lies on one of these lattice planes. The planes are defined by Miller indices, which are determined by the points at which the lattice planes intersect the unit cell. For each set of lattice planes three Miller indices are required and these are denoted ash,k and l and are given by the reciprocal of the fractional intercepts along the unit cell edges of the first plane from the origin. The distance between equivalent planes is known as the d-spacing (dhkl) and can also be considered as the distance from the origin to the
2.4. DIFFRACTION 33 and lattice parameters is dependent on the system, for cubic systems it can be calculated using equation 2.1.
d= √ a h2+k2+l2 (2.1) a b c (010) (110) (111)
Figure 2.2: Examples of lattice planes and the corresponding Miller indices
2.4
Diffraction
2.4.1 X-ray Diffraction [88, 90]
X-rays are electromagnetic radiation with a wavelength of the order of the dis-tances between atoms in a solid and as such are suitable for use with crystalline materials. X-rays interact with the electrons in crystalline materials and the d-spacing between the atoms gives a diffraction pattern unique to a particular material.
Not all scattering will give rise to peaks in an X-ray diffraction pattern. Only peaks which obey Bragg’s Law give a significant amount of diffracted intensity and if we consider the diffraction of X-rays with atoms on a set of lattice planes, shown in figure 2.3, we may see why this is the case. If scattering of two X-ray photons occurs from atoms on two lattice planes at points A and D then the second wave travels a further distance than the first. Using the geometry shown in figure 2.3 the difference in path length can be shown as related to both the d-spacing and the angle of the X-ray beam.
2.4. DIFFRACTION 34
difference in path length = BD + DC = 2.dhkl.sinθ (2.2)
A D B C dhkl θ θ 2θ 1 2
Figure 2.3: Geometry used for derivation of Bragg’s Law.
Where the path difference is equal to an integer of the X-ray wavelength (nλ) constructive interference is seen and therefore it can be written that:
nλ= 2.d.sinθ where n = 0, 1, 2... (2.3)
This therefore shows that where Bragg’s law is satisfied, constructive inter-ference between waves occurs and a strong peak intensity is seen. Where Bragg’s law is not met (at angles other than the Bragg angle) destructive interference occurs and no peak intensity is seen in the diffraction pattern. It should be noted that in reality X-ray scattering occurs through thousands of consecutive planes in the crystal system and that the X-ray scattering occurs from the electron cloud and not from the nucleus of the atom.
X-ray generation
X-ray radiation is produced when high energy electrons strike a metal plate, this causes an electron to be ejected from a core orbital of the metal. This hole is then
2.4. DIFFRACTION 35 filledvia electron decay, with the emission of radiation. X-rays are also produced by the slowing down of electrons as they enter the metal target, producing a more broad spectrum of wavelengths (figure 2.4). In standard laboratory diffrac-tometers this metal is usually copper, here electron decay occursvia both 2p→ 1s and 3p → 1s transitions (denoted Kα and Kβ, respectively). Both of these
lines are in fact doublets (figure 2.4) giving two separate wavelengths for each line; for the Kα line these are 1.5406 ˚A and 1.5444 ˚A respectively for Kα1 and
Kα2. Synchrotron X-rays are high energy waves, produced in a synchrotron
par-ticle accelerator. Here charged parpar-ticles are accelerated to relativistic speeds and controlled in a circular orbit by magnetic fields. When these charged particles change speed, synchrotron radiation is released over a wide range of wavelengths.
Figure 2.4: The X-ray spectrum from a copper target
Monochromation
As already discussed X-rays are produced with a wide range of wavelengths, how-ever, for X-ray diffraction experiments, a single, intense wavelength is required, this is achieved through monochromation. In most laboratory based diffractome-ters a crystal monochromator is used. This is a single crystal orientated to a particular angle so that Bragg’s law (equation 2.3) is satisfied. Through use of this set orientation, only one wavelength is diffracted from the crystal; for a
cop-2.4. DIFFRACTION 36 per source the Kα1 wavelength is used as this is the most intense. Synchrotron
X-ray sources generally use insertion devices to produce polarised radiation of high intensity. These devices include wigglers and undulators.
2.4.2 Powder Diffraction
In a powder sample (as opposed to a single crystal) there are many small crystal-lites, which are randomly orientated, covering essentially all possible orientations. As such, the lattice planes within the structure of the crystallite will also be ran-domly orientated and X-rays will therefore be diffracted in all directions. This means that each set of equivalent lattice planes give a cone of diffraction rather than a single point, this cone is made up of many dots, where each dot corresponds to diffraction from a single crystallite in the sample. The X-ray diffractometer detects the amount of X-rays at a given angle, 2θ, where the amount of X-rays reaching the detector is directly proportional to the signal intensity.
As all crystalline materials have a characteristic diffraction pattern then pow-der diffraction pattern can be used to identify which crystalline phases are present within the powder sample as well as giving structural information on these phases. The majority of information from a powder diffraction pattern is found in the peak position, peak shape and peak intensity.
The positions of the Bragg peaks in an X-ray diffraction pattern are deter-mined by the unit cell size, shape and symmetry, as well as the wavelength of radiation used in the experiment. Through the Bragg law (equation 2.3) the peak positions correspond to the distances between lattice planes in the unit cell. Other factors such as an error in the height of the sample could cause a change in the observed peak positions.
The peak shapes are predominantly affected by the particle size and the crys-tallinity of the sample. There will also be instrumental factors which have some effect on the peak shape. The Bragg law (equation 2.3) is only truly satisfied for an infinite sized crystallite. For a finite crystal size the intensity of any Bragg