Procedia Computer Science 57 ( 2015 ) 798 – 806
1877-0509 © 2015 The Authors. Published by Elsevier B.V. This is an open access article under the CC BY-NC-ND license (http://creativecommons.org/licenses/by-nc-nd/4.0/).
Peer-review under responsibility of organizing committee of the 3rd International Conference on Recent Trends in Computing 2015 (ICRTC-2015) doi: 10.1016/j.procs.2015.07.479
ScienceDirect
Third International Conference on Recent Trends in Computing (ICRTC’ 2015)
Validating the E
ff
ectiveness of Object-Oriented Metrics for
Predicting Maintainability
Lov Kumar
a, Debendra Kumar Naik
b, Santanu Ku. Rath
c aDept. of CSE, NIT Rourkela, IndiabDept. of CSE, NIT Rourkela, India cDept. of CSE, NIT Rourkela, India
Abstract
In this study, empirically investigates the relationship of existing class level object-oriented metrics with a quality parameter i.e.,
maintainability. Here, different subset of Object-Oriented software metrics have been considered to provide requisite input data to
design the models for predicting maintainability using Neuro-Genetic algorithm (hybrid approach of neural network and genetic
algorithm). This technique is applied to estimate maintainability on two different case studies such as Quality Evaluation System
(QUES) and User Interface System (UIMS). The performance parameters of this technique are evaluated based on the basis of Mean absolute error (MAE), Mean Absolute Relative Error (MARE), Root Mean Square Error (RMSE), and Standard Error of the Mean (SEM). The results reported that the identified subset metrics demonstrated an improved maintainability prediction with higher accuracy.
c
2014 The Authors. Published by Elsevier B.V.
Peer-review under responsibility of organizing committee of Fourth International Conference on Selected Topics in Mobile & Wireless Networking (MoWNet’2014).
Keywords: CK metrics suite; Maintainability; Genetic algorithm; Neurons; Metrics; QUES; UIMS
1. Introduction
Present day software development process emphasis’s the methodology based on Object-Oriented paradigm. It is observed that the quality of Object-Oriented software can be best assessed by the use of different software metrics. A number of metrics have been proposed by researchers and practitioners to evaluate the quality of software. Some of the software metrics available in literature are as follows: Abreu MOOD metric suite1, Bansiya and Davis (QMOOD
metrics suite)2, Briandet al.3, Etzkornet al.4, Halstead5, Henderson-sellers6, Li and Henry7, McCabe8, Tegardenet al.9, Lorenz and Kidd10and CK metric11suite, etc.
The usefulness of these metrics lies in their ability to predict the quality of the developed software. Software quality attributes, identified by ISO/IEC 912612are efficiency, functionality, maintainability, portability, reliability and usability. In recent years, maintainability plays a high priority role for achieving considerable success in software
E-mail address:[email protected], [email protected] and [email protected]
© 2015 The Authors. Published by Elsevier B.V. This is an open access article under the CC BY-NC-ND license (http://creativecommons.org/licenses/by-nc-nd/4.0/).
Peer-review under responsibility of organizing committee of the 3rd International Conference on Recent Trends in Computing 2015 (ICRTC-2015)
system and it is considered as an essential quality parameter. The ISO/IEC 912612standard defines maintainability
as the capability of the software product to be modified, including adaptation or improvements, corrections of the software to changes in environment and in requirements and functional specifications. In this paper, maintainability is considered as the number of source of lines changed per class. A line change can be an ‘addition’ or ‘deletion’ of lines of code in a class7. In this proposed analysis of maintainability estimation, hybrid approach of ANN and
genetic algorithm i.e., Neuro-genetic (Neuro-GA)14approach has been used for predicting software maintainability on two software products available commercial such as Quality Evaluation System (QUES) and User Interface System (UIMS). To train these models, Object-Oriented software metrics are considered as input data.
The remainder of the paper is organized as follows: Section 2 shows the related work in the field of software maintainability estimation and Object-Oriented metrics. Section 3 emphasizes on mining of metrics values from data repository. Section 4 briefs about the methodologies used to estimate the maintainability. Section 5 highlights on the results for maintainability prediction, achieved by applying Neuro-GA approach. Section 6 gives a note (comparison) on the performance of the designed models based on the performance parameters.In Section 7 threats to validity have been discussed and Section 8 concludes the paper with scope for future work.
2. Related work
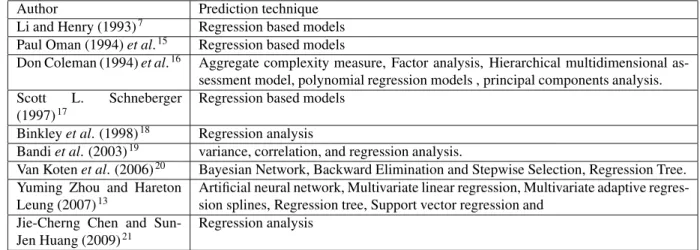
It is observed in literature that software metrics are used in design of prediction models which serve the purpose of computing the prediction rate in terms of accuracy such as fault, effort, re-work and maintainability. In this paper, emphasis is given on work done on the use of software metrics for maintainability prediction. Table 1 shows the sum-mary of literature review done on the area of software maintainability, where it describes the applicability of numerous software metrics used by various researchers and practitioners in designing their respective prediction models.
Table 1: Summary of Empirical Literature on Maintainability
Author Prediction technique Li and Henry (1993)7 Regression based models
Paul Oman (1994)et al.15 Regression based models
Don Coleman (1994)et al.16 Aggregate complexity measure, Factor analysis, Hierarchical multidimensional
as-sessment model, polynomial regression models , principal components analysis. Scott L. Schneberger
(1997)17
Regression based models
Binkleyet al. (1998)18 Regression analysis
Bandiet al. (2003)19 variance, correlation, and regression analysis.
Van Kotenet al. (2006)20 Bayesian Network, Backward Elimination and Stepwise Selection, Regression Tree.
Yuming Zhou and Hareton Leung (2007)13
Artificial neural network, Multivariate linear regression, Multivariate adaptive regres-sion splines, Regresregres-sion tree, Support vector regresregres-sion and
Jie-Cherng Chen and Sun-Jen Huang (2009)21
Regression analysis
From the above table 1, it can be interpreted that many of the authors have used statistical methods such as re-gression based analysis and their forms in predicting the maintainability. But keen observation reveals that very less work has been carried out on using neural network models for designing their respective prediction models. Neu-ral network models over the years have seen an explosion of interest, and their applicability across a wide range of problem domains. Indeed, neural network models can be mainly used to solve problems related to prediction and classification. Neural network models act as efficient predictors of dependent and independent variables due to its character in modeling where in they posses the ability to model complex functions. In this paper, software metrics have been considered for predicting maintainability by applying three artificial intelligence techniques.
3. Research background
The following subsections highlight on the metrics set used for computing maintainability. Data are normalized to obtain better accuracy and then dependent and independent variables are chosen for maintainability estimation.
3.1. Metrics set and empirical data collection
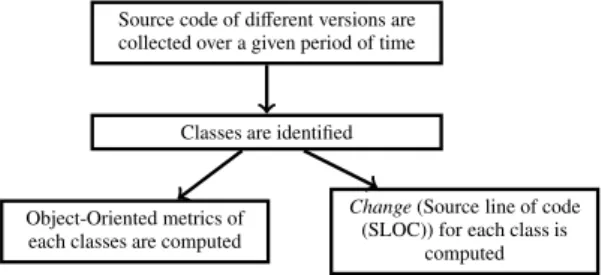
Metrics suites are defined for different goals such as effort estimation, fault prediction, re-usability and mainte-nance effort. In this paper, different set of CK metrics, Li and Henry metrics and size metrics have been considered for predicting software maintainability i.e., the number of lines changed per class is considered as a criterion in de-termining the maintainability of a class. A line change can be an ‘addition’ or ‘deletion’ of lines of code in a class7. Classic-ADa metrics analyzer was used to gather metrics from Classic-ADa’s design and source code. Classic-ADa is an Object-Oriented programing language that adds the capability of Object-Oriented programing to ADa by providing Object-Oriented construct in addition to the ADa constructs7. Figure 1 depicts the flow chart to extract thechange
i.e., altered lines of code in the developed software.
Source code of different versions are
collected over a given period of time
Classes are identified
Object-Oriented metrics of each classes are computed
Change(Source line of code (SLOC)) for each class is
computed
Fig. 1: Flow chart for extraction ofchangein a software product
3.2. Effectiveness of metrics
Once the software maintainability data values are determined, an attempt is made to establish a relationship between the required software maintainability and the metrics. The maintainability ‘change’ is measure as “the number of lines changed per class”7. Hence in this approach, change is considered as a dependent variable and each of the metric
group as a set of independent variables while developing the relation. Maintainability is thus assumed to be a function of the used metrics. To analyze the effectiveness of the metrics used, in the paper the various metrics are categorized into different groups as follows:
a. Analysis 1 (A1): CK metrics (WMC, DIT, NOC, CBO, RFC, and LCOM) are mostly used for evaluate the quality of Object-Oriented software22 23. The important aspect of CK metrics suite is that it covers most of
the features of the Object-Oriented software i.e, size, cohesion, coupling and inheritance. WMC indicates size or complexity of class, DIT and NOC indicate the class hierarchy, CBO and RFC indicate class coupling and LCOM indicates cohesion. In this first category, CK metrics suite is considered for finding the maintainability. CBO metric of the CK metrics suite has not been considered for computing maintainability as it measures “non-inheritance related coupling”22. Maintainability may be modeled as a function of different CK metrics such as:
Maintainability=Change= f(W MC,DIT,NOC,RFC,LCOM) (1)
b. Analysis 2 (A2): In this second category, the combination of both CK metrics suite and that of Li and Henry metrics (DAC, MPC and NOM) are considered for finding the maintainability. The relationship can be repre-sented as follows:
c. Analysis 3 (A3): In this third category, the SIZE metrics along with the combination of CK metrics suite and Li and Henry metrics are used for estimating the maintainability. The relationship is represented as follows:
Maintainability=Change= f(W MC,DIT,NOC,RFC,LCOM,MPC,DAC,NOM,S IZE1,S IZE2) (3)
d. Analysis 4 (A4): In the fourth analysis, only the SIZE metric is used in finding the effectiveness of predict-ing software maintainability. The relationship between the size metrics and Maintainability can be shown as follows:
Maintainability=Change= f(S IZE1,S IZE2) (4)
3.3. Case study
In this paper, order to analyze the effectiveness of the proposed approach, two Object-Oriented software data sets published by Li and Henry (1993) are used as case studies7. Softwares such as User Interface System (UIMS) and
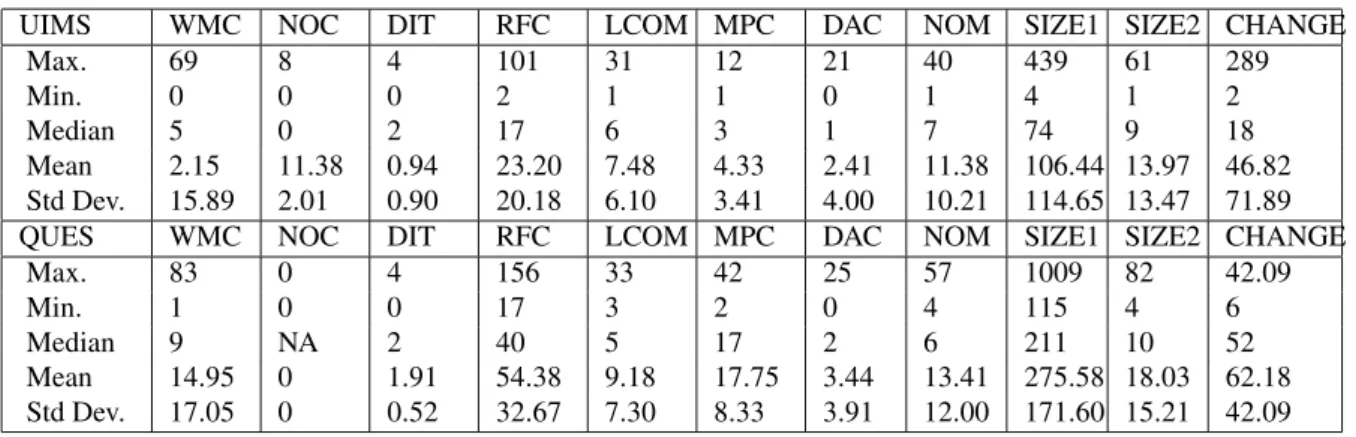
Quality Evaluation System (QUES) are chosen for computing the maintenance effort. The softwares systems viz., UIMS and QUES have 39 and 71 classes respectively. The data have been collected over the past three years. The maintainability of a software is measured by the number of lines changed per class. Table 2 shows the Min, Max, Median and Standard deviation values of the two software systems (UIMS and QUES). In this analysis, the derivative of inheritance metric ‘NOC’ in QUES software product, has all its 71 classes with NOC valueszero. This indicates that there are no immediate sub-classes of a class in the class hierarchy and hence NOC is not considered in computing maintainability in this analysis.
Table 2: Statistics of classes for UIMS and QUES
UIMS WMC NOC DIT RFC LCOM MPC DAC NOM SIZE1 SIZE2 CHANGE
Max. 69 8 4 101 31 12 21 40 439 61 289
Min. 0 0 0 2 1 1 0 1 4 1 2
Median 5 0 2 17 6 3 1 7 74 9 18
Mean 2.15 11.38 0.94 23.20 7.48 4.33 2.41 11.38 106.44 13.97 46.82 Std Dev. 15.89 2.01 0.90 20.18 6.10 3.41 4.00 10.21 114.65 13.47 71.89 QUES WMC NOC DIT RFC LCOM MPC DAC NOM SIZE1 SIZE2 CHANGE
Max. 83 0 4 156 33 42 25 57 1009 82 42.09
Min. 1 0 0 17 3 2 0 4 115 4 6
Median 9 NA 2 40 5 17 2 6 211 10 52
Mean 14.95 0 1.91 54.38 9.18 17.75 3.44 13.41 275.58 18.03 62.18 Std Dev. 17.05 0 0.52 32.67 7.30 8.33 3.91 12.00 171.60 15.21 42.09
4. Proposed work for predicting Maintainability
This section gives a brief note on the use of a hybrid approach on Artificial neural network (ANN) and genetic algorithm (GA) i.e., Neuro-GA approach14for predicting software maintainability.
4.1. Neuro-GA Approach
In this approach, genetic algorithm is used for updating the weight during learning phase. A neural network with a configuration of ‘l-m-n’ is considered for estimation i.e., the network consists of ‘l’ number of input neurons, ‘m’ number of hidden neurons, and ‘n’ number of output neurons. In this paper, for input layer, linear activation function is used i.e., the output of the input layer is treated as input of the input layer. It is represented as:
For hidden layer and output layer, sigmoidal function or squashed-S function is used. The output of hidden layer ‘Oh
for input of hidden layer ‘Ihis represented as:
Oh=
1
1+e−Ih (6)
and output of the output layer ‘Oofor the input of the output layer ‘Iois represented as:
Oo=
1
1+e−Io (7)
The number of weightsNrequired for this network with a configuration of ‘l-m-n’ can be computed using the following equation:
N=(l+n)∗m (8)
with each weight (gene) being a real number and assuming the number of digits (gene length) in weights to bed. The length of the chromosomeLis computed using the following equation:
L=N∗d=(l+n)∗m∗d (9)
For determining the fitness value of each chromosome, weights are extracted from each chromosome using the fol-lowing equation: Wk= ⎧⎪⎪ ⎨ ⎪⎪⎩− xkd+2∗10d−2+xkd+3∗10d−3+....+x(k+1)d 10d−2 if 0<=xkd+1<5 +xkd+2∗10d−2+xkd+3∗10d−3+....+x(k+1)d 10d−2 if 5<=xkd+1<=9 (10)
The fitness values of each chromosome is determined based on the derived fitness function. The algorithm for deriving fitness function is as follows:
Let ¯(Ii,T¯i) ; i=1,2,3....,N where
¯
Ii=(I1i,I2i,I3i, ....,Ili) and ¯Ti=(T1i,T2i,T3i, ....,Tni)
The fitness values of each chromosome is determined based on the derived fitness function. The algorithm for deriving fitness function is as follows:
Let ¯(Ii,T¯i) ; i=1,2,3....,N where
¯
Ii=(I1i,I2i,I3i, ....,Ili) and ¯Ti=(T1i,T2i,T3i, ....,Tni)
represent the respective input and output pairs of the neural network with a configuration of l-m-n. For each chromosomeCi,i = 1,2,3, ....,p, belonging to the current populationPiwhose size is P. The following algorithm
indicates the steps to find the fitness value of the individual chromosomes in the population.
Algorithm for fitness function: FITGEN() Input: ¯Ii=(I1i,I2i,I3i, ....,Ili)
Output: ¯Ti=(T1i,T2i,T3i, ....,Tni)
where ¯Ii, ¯Tirepresent the input and output pairs of the l-m-n configuration of neural network.
Step 1:Weights ¯WifromCiare calculated using equation 10.
Step 2:Considering ¯Wias a constant weight, the network is trained forNinput instances and the estimate valueOi
is found.
Step 3:ErrorEjfor each input instance jis computed using following equation:
Ej=(Tji−Oji)2 (11)
Step 4:Root mean square error (RMSE) for the chromosomeCiis computed using the following equation:
Ei=
j=N j=1 Ej
N (12)
Step 5:Fitness value for chromosomeCiusing the following equation is found out as: Fi= 1 Ei = 1 j=N j=1Ej N (13)
Figure 2 shows the block diagram for Neuro-GA approach, which represent the steps followed to design the model.
Random population of ‘n’ chromosomes is generated Weight set is extracted
Weight for training the network is fed
as input Fitness value is computed using FITGEN() Stopping criterion met ?
Model is used for testing
Yes Min fitness value
chromosome is replaced with Max
fitness value chromosome Two-point cross over is performed
No
Fig. 2: Flow chart representing Neuro-GA execution
5. Result and Analysis
Accuracy of Software maintainability estimation model designed by application of AI techniques is determined by using performance evaluation parameters such as: Mean Relative Error (MRE)24, Mean Absolute Relative Error
(MARE)24, and Standard Error of the Mean (SEM)25. Parameters like True error (e) and Estimate of true error (ˆe) are being used for evaluating models involving cross validation approach26.
5.1. Experimental setup
Following are the numerical values used in execution of Neuro-GA approach for predicting software maintainabil-ity.
i. Initialization of chromosome: Let the population of size N=50 is considered, initially generated by random process.
ii. Extraction of weight: Each chromosome contains the weight of input to hidden node and hidden node to output. Weight is extracted using Equation 10.
iii. Computing fitness value: The fitness of individual chromosomes is found using the proposed algorithm FIT-GEN. This algorithm is executed with an aim of minimizing the mean square error.
iv. Ranking of chromosomes: The chromosomes in the pool are ranked based on their fitness value. Minimum fitness value chromosome is stripped of by Maximum fitness value chromosome.
v. Crossover: Two point cross-over approach is performed.
vi. Stopping criteria: The execution of the proposed algorithm terminates when 95% of the chromosomes in the pool obtain unique fitness value, beyond this level the fitness value of chromosome get almost saturated.
5.2. Neuro-GA Approach
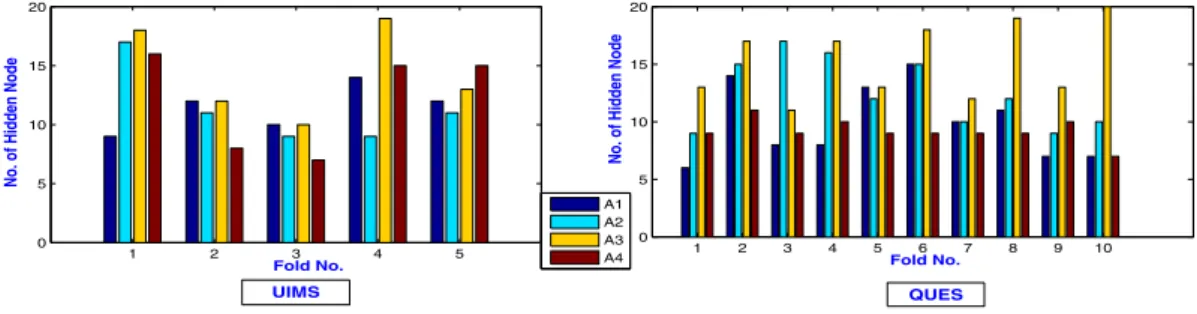
In this paper, 10-fold cross-validation concept has been considered in QUES and 5-fold cross-validation has been considered in UIMS for comparing the models. True error and estimate of true error determine the suitable model to be chosen for effort estimation. Figure 3 depicts the distribution of the hidden nodes of the suitable model in each fold. The final model chosen for effort estimation is based on the median values of the hidden nodes in their respective folds. Table 3, shows the obtained performance metrics for UIMS and QUES software.
1 2 3 4 5 6 7 8 9 10 0 5 10 15 20 Fold No.
No. of Hidden Node
1 2 3 4 5 0 5 10 15 20 Fold No.
No. of Hidden Node
A1 A2 A3 A4 QUES UIMS
Fig. 3: NO of Hidden node in each fold
Table 3: Performance matrix for UIMS data set
UIMS QUES
r Epochs MAE MARE SEM r Epochs MAE MARE SEM A1 0.8108 76 0.1553 0.5331 0.0288 0.8227 74 0.1480 0.4180 0.0200 A2 0.8105 86 0.1364 0.5465 0.0413 0.8643 72 0.1534 0.4744 0.0155 A3 0.8831 76 0.0831 0.3155 0.0525 0.8831 64 0.1296 0.3775 0.0134 A4 0.8872 82 0.1283 0.6134 0.0269 0.8839 68 0.1245 0.4588 0.0192
From Table 3, it can be concluded that the performance in estimating software maintainability was very poor when SIZE metric was considered for QUES and UIMS software products. When the comparison is done for the A1 and A2 analysis, the performance is much similar for QUES and UIMS data sets. And when all the metrics (A3 analysis) are considered, the performance is much better for QUES and UIMS but also the complexity of the model increased due to increase in input nodes. The high value of ‘R’ shows the strong affinity between software metrics and maintainability. Figure 4 shows the variance of number of chromosomes having same fitness value and generation number of UIMS and QUES.
Figure 5 shows the Pearson residual boxplots for all four analysis (A1 to A4) for the normalized data of UIMS and QUES data set, allowing a visual comparison. The line in the middle of each box represents the median of the Pearson residual. In case of UIMS and QUES data set, A1, A2 and A3 analysis have a median residual close to zero but in A4 analysis it is observed that median residual is slightly greater then zero. It interprets that the data is slightly underestimated. Of all the analysis, A3 analysis has the narrowest box and the smallest whiskers, as well as the few number of outliers. Based on these boxplots, it is evident that A3 analysis gave best estimation accuracy as compared to other three analysis i.e, A1, A2 and A4. Hence it is observed that the model designed by combining all the three metrics (CK metrics suite, Li and Henry metrics and SIZE metrics ) yields better maintenance accuracy value in comparison with the result obtained on the basis of analyzing them individually.
0 10 20 30 40 50 60 70 80 90 0 5 10 15 20 25 30 35 40 45 50 Generation No.
No. of chromosome having same fitness value
A1 A2 A3 A4 0 10 20 30 40 50 60 70 80 0 5 10 15 20 25 30 35 40 45 50 Generation No.
No. of chromosome having same fitness value
A1 A2 A3 A4 QUES UIMS
Fig. 4: No. of chromosomes contain same fitness value VS Iteration No. A1 A2 A3 A4 −0.6 −0.4 −0.2 0 0.2 0.4 Pearson Residuals A1 A2 A3 A4 −0.4 −0.3 −0.2 −0.1 0 0.1 0.2 0.3 0.4 Pearson Residuals UIMS QUES
Fig. 5: Residual boxplot for UIMS and QUES
6. Comparison of models
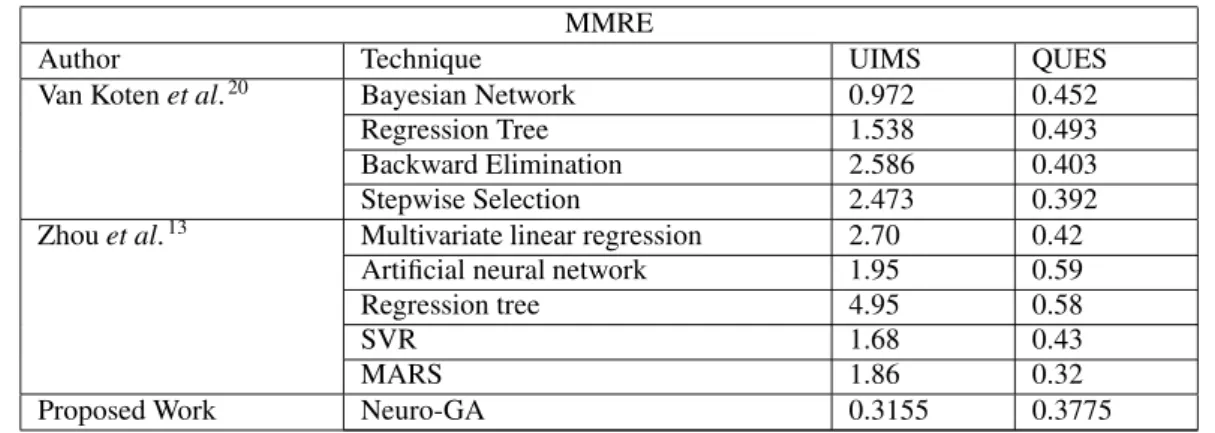
Apart from the comparative analysis done to find the suitable model which can predict the best software maintain-ability, this paper also makes the comparison of the proposed work with the work done by Yuming Zhouet al.13and Van Kotenet al.20. Yuming Zhouet al.13and Van Kotenet al.20have used same dataset i.e., UIMS and QUES for
predicting maintainability based on different regression and neural network models . They have considered ‘MMRE’ as a performance parameter to compare the models designed for predicting maintainability of Object-Oriented soft-ware systems. Table 4 shows the MMRE value of the proposed work and the work done by Yuming Zhouet al.13and
Van Kotenet al.20. From Table 4, it can be observed that, in case of QUES software MMRE value is almost same but in case of UIMS software, the proposed approach obtained better prediction rate for maintainability.
Table 4: Performance based on MMRE for UIMS and QUES
MMRE
Author Technique UIMS QUES
Van Kotenet al.20 Bayesian Network 0.972 0.452
Regression Tree 1.538 0.493
Backward Elimination 2.586 0.403 Stepwise Selection 2.473 0.392
Zhouet al.13 Multivariate linear regression 2.70 0.42
Artificial neural network 1.95 0.59
Regression tree 4.95 0.58
SVR 1.68 0.43
MARS 1.86 0.32
Proposed Work Neuro-GA 0.3155 0.3775
7. Threat to Validity
Several issues affect the results of the experiment are:
• Two Object-Oriented systems, i.e., UIMS and QUES used in this study are design in ADA language. The models design in this study are likely to be valid for other Object-Oriented programing language, i.e., Java or C++. further research can extend to design a model for other development paradigms.
• In this study, only eleven set of software metrics are used to design a models. Some of the metrics which are widely used for Object-Oriented software are further considered for predicting maintainability.
• we only consider AI techniques for designing the prediction models to predict maintainability. Further, we can extend the work to reduce the feature using feature reduction techniques, i.e., PCA, RST, statistical test etc..
8. Conclusion
In this paper, an attempt has been made to use subset of class level object-oriented metrics in order to predicting software maintainability. Neuro-GA approach was used to design a model by employing 10-fold and 5-fold cross-validation technique for QUES and UIMS software. Four analysis approaches of different metrics sets were considered for estimating the software maintainability for QUES and UIMS software. These techniques have the ability to predict the output based on historical data. The software metrics are taken as input data to train the network and estimate the maintainability of the software product. From this analysis it can be concluded that Neuro-GA approach obtained promising results when compared with the work done by Van Kotenet al. and Zhouet al. Also the results reported that the identified of subset metrics demonstrated an improved maintainability prediction with higher accuracy.
Further, work can be replicated in estimating the maintainability of the software products by combining neural network with other techniques such as Particle swarm optimization, Fuzzy logic, Clonal selection algorithm etc.
References
1. F. B. E. Abreu and R. Carapuca. Object-Oriented software engineering: Measuring and controlling the development process. InProceedings of the 4th International Conference on Software Quality, volume 186, 1994.
2. J. Bansiya and C. G. Davis. A hierarchical model for Object-Oriented design quality assessment. ACM Transactions on Programming Languages and Systems., 128(1):4–17, August 2002.
3. L. C. Briand, J. W ¨ust, J. W. Daly, and D. V. Porter. Exploring the relationships between design measures and software quality in Object-Oriented systems.The Journal of Systems and Software, 51(3):245–273, May 2000.
4. L. Etzkorn, J. Bansiya, and C. Davis. Design and code complexity metrics for Object-Oriented classes. Object-Oriented Programming, 12(10):35–40, 1999.
5. M.H. Halstead.Elements of Software Sciencel. Elsevier Science, New York, USA, 1977. 6. B. Henderson-Sellers.Software Metrics. Prentice-Hall, UK, 1996.
7. W. Li and S. Henry. Maintenance metrics for the Object-Oriented paradigm. InProceedings of First International Software Metrics Sympo-sium, pages 52–60, 1993.
8. Thomas J. McCabe. A complexity measure.IEEE Transactions on Software Engineering, 2(4):308–320, December 1976.
9. D. P. Tegarden, S. D. Sheetz, and D. E. Monarchi. A software complexity model of Object-Oriented systems. Decision Support Systems, 13(3):241–262, 1995.
10. M. Lorenz and J. Kidd.Object-Oriented Software Metrics. Prentice-Hall, NJ, Englewood, 1994.
11. S. R. Chidamber and C. F. Kemerer. A metrics suite for Object-Oriented design.IEEE Transactions on Software Engineering, 20(6):476–493, June 1994.
12. Ho-Won Jung, Seung-Gweon Kim, and Chang-Shin Chung. Measuring software product quality: A survey of iso/iec 9126.IEEE software, 21(5):88–92, 2004.
13. Yuming Zhou and Hareton Leung. Predicting object-oriented software maintainability using multivariate adaptive regression splines.Journal of Systems and Software, 80(8):1349–1361, 2007.
14. C.J. Burgess and M.Lefley. Can genetic programming improve software effort estimation.Information and Software Technology, 43:863–873, 2001.
15. Paul Oman and Jack Hagemeister. Construction and testing of polynomials predicting software maintainability. Journal of Systems and Software, 24(3):251–266, 1994.
16. Don Coleman, Dan Ash, Bruce Lowther, and Paul Oman. Using metrics to evaluate software system maintainability. IEEE Computer, 27(8):44–49, 1994.
17. Scott L Schneberger. Distributed computing environments: effects on software maintenance difficulty. Journal of Systems and Software, 37(2):101–116, 1997.
18. Aaron B Binkley and Stephen R Schach. Validation of the coupling dependency metric as a predictor of run-time failures and maintenance measures. InProceedings of the 20th international conference on Software engineering, pages 452–455. IEEE Computer Society, 1998. 19. Rajendra K. Bandi, Vijay K. Vaishnavi, and Daniel E Turk. Predicting maintenance performance using object-oriented design complexity
metrics.IEEE Transactions on Software Engineering, 29(1):77–87, 2003.
20. Chikako Van Koten and AR Gray. An application of bayesian network for predicting object-oriented software maintainability. Information and Software Technology, 48(1):59–67, 2006.
21. Jie-Cherng Chen and Sun-Jen Huang. An empirical analysis of the impact of software development problem factors on software maintain-ability.Journal of Systems and Software, 82(6):981–992, 2009.
22. Shyam R Chidamber and Chris F Kemerer.Towards a metrics suite for Object-Oriented design, volume 26. ACM, 1991.
23. V. R. Basili, L. C. Briand, and W. L. Melo. A validation of Object-Oriented design metrics as quality indicators. IEEE Transactions on Software Engineering, 22(10):751–761, October 1996.
24. Rob J Hyndman and Anne B Koehler. Another look at measures of forecast accuracy. International Journal of Forecasting, 22(4):679–688, 2006.
25. Tim Menzies, Zhihao Chen, Jairus Hihn, and Karen Lum. Selecting best practices for effort estimation. IEEE Transactions on Software Engineering, 32(11):883–895, 2006.
26. Kim and Ji-Hyun. Estimating classification error rate: Repeated cross-validation, repeated hold-out and bootstrap. Computational Statistics and Data Analysis, 53(11):3735–3745, 2009.