EFFECTIVE RISK MANAGEMENT:
RISK ANALYSIS USING AN ENHANCED FMEA
TECHNIQUE
Vijaya Deepti
Nimmagadda Ramanamurthy and K. Uma Balasubramanian Tata Consultancy Services
Bangalore, Karnataka India
Abstract
“Identifying and dealing with risks early in development lessens long-term costs and helps prevent software disasters”
– Barry W. Boehm, 1991
“FMEA is a technique used to identify, prioritize, and eliminate potential failures from the system, design or process before they reach the customer”
– Omdahl, 1988
Risk is the possibility of suffering loss. In a software project, loss denotes negative impact on a project, which could be in the form of diminished quality of end product, increased cost, delayed completion or failure. Analysis and timely control of risk is essential for the success of any programme or project in an organisation.
Risk management is the process of identifying, analysing and quantifying risks and developing plans to mitigate them before they harm a project. Managing risk has been a practice in TCS since the 1980s. In its endeavour to improve project management practices, the organisation has focused more on risk prevention, i.e. identifying risks early and planning for their mitigation.
Failure Mode and Effects Analysis (FMEA) is a structured, proactive technique to identify the ways in which a product or process can fail and to prevent such failure. This technique was enhanced further by incorporating risk categories, a risk threshold matrix and cost-benefit ratios for proactive risk mitigation. The purpose of this paper is to describe the need for enhancement, the approach adopted, the steps taken to establish the model, and implementation results. The paper also describes how TCS used the model to monitor, communicate and control risk with the involvement of stakeholders in risk mitigation.
1. The Risk Management Framework at TCS
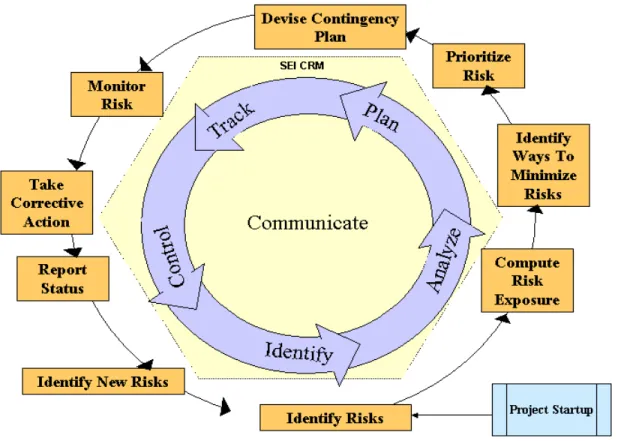
TCS’s risk management framework, presented in Fig. 1, is analogous to SEI’s continuous risk management paradigm.
Fig. 1: TCS’s Risk Management Framework
At a high level, the framework diagram shows the steps taken for risk management at enterprise level:
• Risks are identified using techniques such as Top 10 Top-level Software Risks, checklists or common risk lists from the organisation’s knowledge repository. Past experience, problem analysis, assumption analysis and intuition are used to derive these lists.
• In a programme, during the start-up phase, risks are analysed for what-if
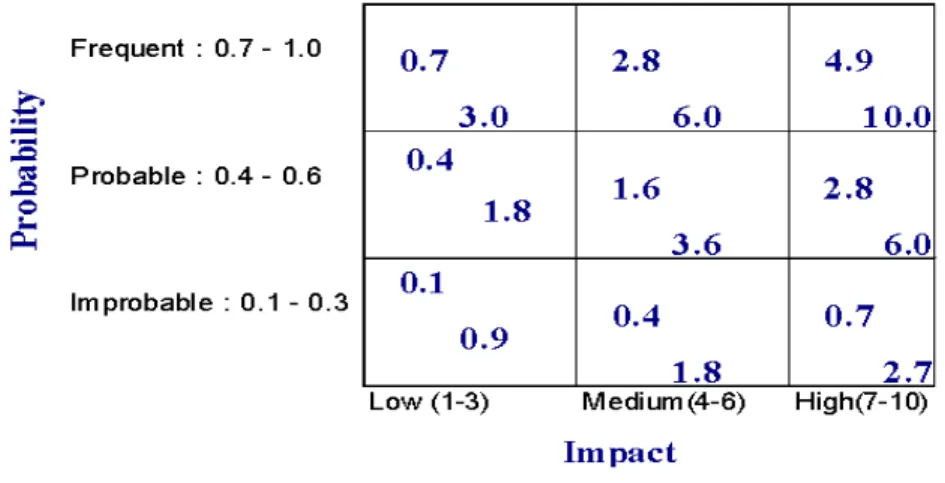
scenarios in schedule, effort and quality of software variable. Their relative probability of occurrence and impact on the project are determined. The probability and impact levels used are as follows in Table 1 [Boehm]:
Value (Interpretation)
Probability
0.1-0.3 (Improbable)
0.4-0.6 (Probable)0.7-1.0 (Frequent)
Impact
1-3 (Low)
4-6 (Medium)
7-10 (High)
• A prioritised list of identified risks is drawn up using risk exposure analysis, risk exposure being calculated by multiplying loss probability and loss impact for each risk. Fig. 2 shows the quick-reference table used for risk exposure. (For instance, risk exposure values for frequent and low-impact risks range from 0.7 to 3.0.)
Fig. 2: The Quick-reference Table for Risk Exposure
• All risks and contingency plans are documented in the risk management plan.
• Uncertainty in requirements, environmental changes, unavailability of tools and technology challenges are events that could trigger risk re-prioritisation and action the contingency plans.
• Risks are reviewed regularly for change, since changes in impact or probability affect risk exposure, irrespective of a trigger event. The risks are then re-prioritised and corrective action taken.
• The status of the top 10 critical risks, i.e. those that have the highest impact on the project’s success, is tracked and reported to management regularly.
2. The Need for Change
At TCS’s Bangalore facility, risk and risk exposure calculations are documented in a risk management plan as shown in Table 2.
Risk Risk Impact Type Contingency Plan Probability (P) Impact Value (I) Risk Exposure (P*I)
This format includes prioritised (re-prioritised) risks. However, it does not address prevention, i.e. early identification and mitigation of risk. Risk management planning remains inadequate unless risk exposure is mapped to a threshold that triggers contingency plan invocation.
Management found it needed five key features in the risk management plan:
• A shift from corrective to preventive mode
• A mechanism that focused on ‘vital few’ risks
• Assigning of clear responsibilities to individuals to track these risks
• Complete audit-trailing of risk status
• Holistic risk management by risk category mapping
This led to developing a systematic, best-in-class risk analysis model that was prevention-oriented and could segregate the ‘vital few’ risks from the ‘trivial many’ ones. TCS thus adopted the Failure Mode and Effects Analysis (FMEA) technique.
3. The FMEA Technique
FMEA is a systematic technique to analyse potential failure modes and assist in mitigating them. It systematically anticipates and studies the cause and effect of failure.
The power of FMEA is four-fold. Firstly, all FMEA artifacts are dynamic, living documents. Continuous improvement and risk level reduction drive FMEA. Next, the technique identifies high-priority, ‘vital few’ risks because, in real life, not all problems are equally important. Thirdly, FMEA is customer-oriented although a customer representative may not be an end-user. Fourthly, FMEA offers audit trails, i.e. a well-documented record of improvements arising out of corrective action implemented. In sum, FMEA gives one a mechanism to document and monitor all data elements required to meet business drivers.
The information format for FMEA is shown in Fig. 3.
Action Taken Ne w S ev er it y New O ccu rr en c e New D e tect io n New RP N 0 0 0 0 0 0 0 0 0 0 Recommended Action
Responsibility And Target Completion Date O ccu rr en ce (P ) Current Controls De te ct ion Sc or e ( D ) RP N= S *P *D
Resulting Risk Priority Number Total Risk Priority Number
Action Results Item/ Process Step Potential Failure/Error Mode Potential Effect(s) Of Failure S e veri ty ( S ) Potential Cause(s) Of Failure
Fig. 3: The FMEA Format
The FMEA process is as follows:
• Brainstorming on process and product failures is carried out and potential failure modes listed, with the susceptible items clearly identified.
• The customer’s perspective on the effect of failure is described and a severity rating attached.
• The possible causes of these failures are identified and documented. These are then granularised to a low level so that corrective action and control is possible. A probability value is assigned to each cause.
• Existing controls to detect or prevent failure are described and a detection score attached.
• Severity, occurrence and detection are rated on a scale (usually from 1 to 10), for each failure. Risk Priority Numbers (RPNs) are calculated as the product of severity, occurrence and detection. Failures with the highest RPNs are identified and action to attenuate each of the three factors is decided and documented.
• Deadlines and responsibilities are assigned, action implemented, severity, occurrence and detection reassessed and RPN re-calculated. This process is repeated until the risks are under control.
• FMEA artifacts are reviewed and updated either weekly or monthly. Drivers for Selecting FMEA
The primary reasons for which TCS elected to go the FMEA way were:
To realise the benefits of the technique and ingrain continuous improvement into TCS’s organisational culture.
TCS used FMEA for programme risk management. Process change and qualitative benefits prompted a discussion with the customer, whose desire for improvement brought in the needed rigour and spurred FMEA use in the projects.
Lastly, FMEA is a technique already being used in the Six Sigma process improvement projects at TCS.
4. The Need for Enhancement
During 1999-2002, 15 of TCS’s delivery centres were assessed as operating at Software CMM Level 5. In 2002, TCS as an enterprise, started its journey to CMMi Level 5. However, although CMMi treats Risk Management (RSKM) as a distinct process area (PA), FMEA does not address some CMMi RSKM PA sub-practices. (Fig. 4 excerpts a comparative-analytical sampling.)
TCS therefore identified the need to enhance FMEA. It discussed this with the customer and shared with them the resulting gap analysis report.
CMMi RSKM PA Goals Key Practice Sub-Practice Gap in FMEA
[SG1] Preparation for risk management is conducted.
[SP 1.2] Define the parameters used to analyze and categorize risks, and the parameters used to control the risk management effort.
[2] Define thresholds for each risk category
Yes. There is no category or threshold. Priority is by RPN value and risks are addressed by priority
[SG3] Risks are handled and mitigated, where appropriate, to reduce adverse impacts on achieving objectives.
[SP 3.1] Develop a risk mitigation plan for the most important risks to the project, as defined by the risk management strategy.
[3] Determine cost-to-benefit ratio of implementing risk mitigation plan for each risk
Yes. The technique does not provide means for this
[SG3] Risks are handled and mitigated, where appropriate, to reduce adverse impacts on achieving objectives.
[SP 3.2] Monitor the status of each risk periodically and implement the risk mitigation plan as appropriate
[2] Provide a method for tracking open risk-handling action items to closure
No. Responsibility and Target Completion Dates are handled in FMEA
Fig. 4: FMEA and RSKM: Sample Gap Analysis
A brainstorming session was conducted among senior group leaders, project leaders and the programme manager to identify the top five features that FMEA should incorporate. The goals set were:
• Develop a risk analysis model compatible with RSKM PA.
• Determine rating and threshold criteria to identify ‘vital few’ risks.
• Devise a standardised methodology to derive cost-benefit ratios for action recommended.
• Garner the appropriate level of stakeholder involvement to mitigate risks.
• Develop a well-defined escalation mechanism for the ‘vital few’ risks that remain unresolved for more than the pre-defined period.
5. Developing and Deploying the Model
The model was developed after analysing the goals and drivers. While the heart of the model is the enhanced FMEA form, other key components are the risk management guidelines, the status tracking and reporting form and the cost-benefit calculation toolkit. The components and enhanced FMEA process are as follows:
New risk management
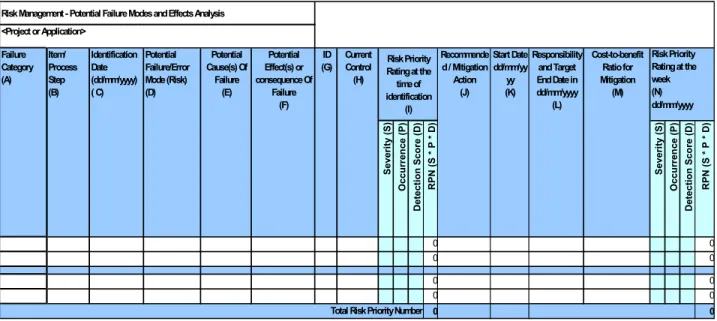
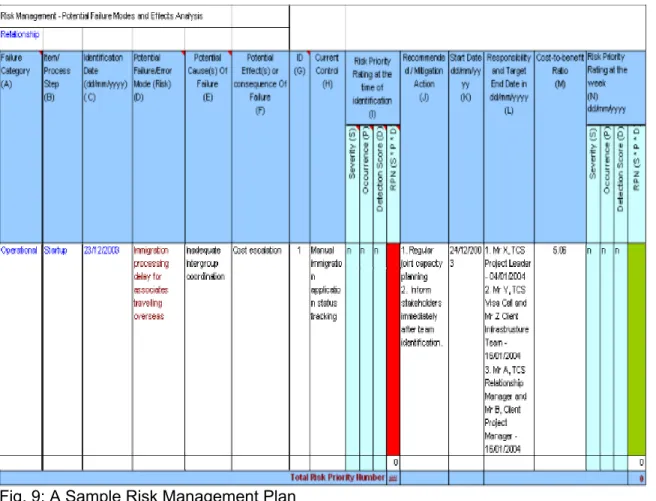
The enhanced form has additional fields such as failure category, risk identification date, mitigation start date, cost-benefit ratio, etc (Fig. 5).
Failure categorisation
To further help identify risks, failure categories, based on customer requirements and the causes of project derailment, are included in categories such as Operational, Strategic, Reputation and Performance.
Continual risk analysis
Risk identification, mitigation and archival happens on a regular basis. Identification dates are attached to the identified risks. This facilitates continual risk review process.
Risk Management - Potential Failure Modes and Effects Analysis <Project or Application> S everi ty (S ) Occurr en ce (P) D etection Scor e (D ) RPN (S * P * D ) S everi ty (S ) Occurr en ce (P) D etection Scor e (D ) RPN (S * P * D ) 0 0 0 0 0 0 0 0 0 0 Failure Category (A) Item/ Process Step (B) Identification Date (dd/mm/yyyy) ( C) Potential Failure/Error Mode (Risk) (D) Potential Cause(s) Of Failure (E) Potential Effect(s) or consequence Of Failure (F) ID (G) Current Control (H) dd/mm/yyyy
Total Risk Priority Number
Cost-to-benefit Ratio for Mitigation (M) Risk Priority Rating at the week (N) Risk Priority Rating at the time of identification (I) Recommende d / Mitigation Action (J) Start Date dd/mm/yy yy (K) Responsibility and Target End Date in dd/mm/yyyy (L)
Fig. 5: The Enhanced FMEA Form Cost-benefit ratio calculation toolkit
The toolkit calculates cost versus benefits for recommended mitigation. The resulting figures are documented in the new risk management plan.
Uniform usage
The risk management guidelines and documentation of the enhanced FMEA ensure uniform usage. The guidelines include a 1-10 scale for rating severity, occurrence and detection, which is based on the impact of a risk on a given objective, e.g. schedule, cost or scope. Fig. 6 shows a sample subset of the severity matrix.
Severity Rank A Failure Could Impact
3 Cause a minor nuisance, but be overcome with no performance loss
Sch. slippage <2% or cost increase <3% or Scope change is barely noticeable
2 Be unnoticed and have only minor effect on performance
Insignificant schedule slippage or Insignificant cost increase or No scope change
1 Be unnoticed and not affect the performance No schedule slippage or Insignificant cost increase or No Scope change
Fig. 6: Sample Risk Severity Matrix Anticipatory dates
Each recommended mitigation action is given a start date, which is the earliest date that a risk is likely to affect the project. This is the date by which the risk must be acted on. Additionally, target completion dates are also set, which are the latest dates for action before the impact is felt.
Risk threshold criteria matrix
Identification of threshold values is challenging and is dependent on the nature of projects. The threshold criteria helps identify ‘vital few’ risks. FMEA was piloted in two projects. Based on resulting RPN values and the analysis of criticality of documented risks, the threshold value matrix was derived. (Fig. 7 shows a sample set.) To ensure that the high-impact and high-severity risks were immediately visible, color coding such as green, amber and red is used. The model calculated RPNs and assigned colours automatically.
# Threshold Status and Recommendation Color
1 If RPN >= nn1, then High Risk. Urgent Action Required 2 If RPN >= nn2 and < nn1, then Medium Risk. Warning. Needs
constant monitoring
3 If RPN >= nn3 and < nn2, then Low Risk. Under control. No action
required
Fig. 7: Quick-reference Table for RPN Thresholds Status tracking and reporting
This was a form that allowed risk monitoring to be done weekly. Active risks were reviewed, new ratings were assigned according to severity, occurrence and detection observed in the risk management plan’s monitoring section. Depending on the recalculated RPN value, status of risk at the end of the week was determined as high (red), medium (amber) or low (green). A unique ID is assigned to each risk item to link it to the risk management plan and status tracking and reporting form. Review of all active risks was carried out as a matter of course and the top-10 risks reported.
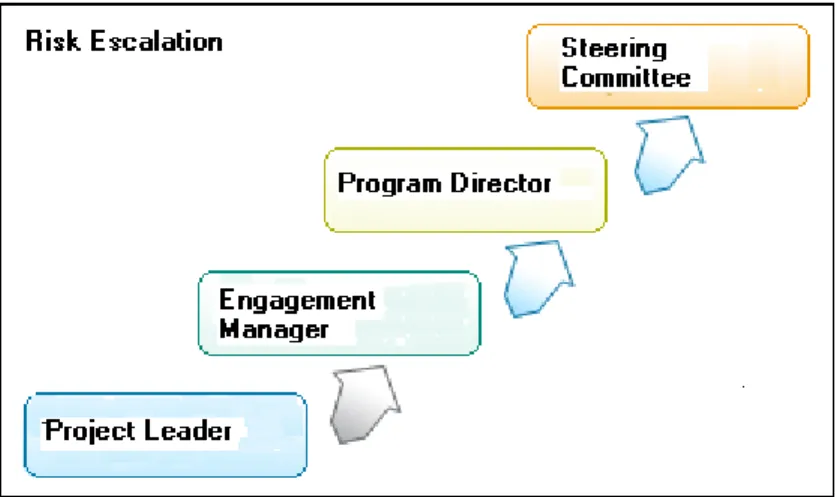
Escalation
High risks that stayed high for more than two weeks were escalated as per the mechanism defined (Fig. 8).
6. Challenges Encountered
Some of the challenges encountered in developing and deploying the model are worth mentioning:
• Defining the categories and criteria to determine threshold values for critical risks
• Calculating cost-benefit ratios for risk mitigation action
• Fostering a culture in the organisations, which motivated appropriate
stakeholders to participate actively in risk mitigation
7. The Result and Benefits of Using the Model
The enhanced FMEA model has been deployed for risk planning, assessing, monitoring and controlling at both programme and project levels. The sample case study below demonstrates how the model is being used to mitigate risks at the programme level. (A single risk is treated across the entire risk management cycle.)
At the programme level, one of the risks identified is related to the delay in immigration processing of associates travelling overseas. Failure in this area would delay project start-ups and, in turn result in cost escalation. The details documented in the new risk management plan (the enhanced FMEA) were as shown in Fig. 9.
This risk was identified on 23 Dec 2003. The start date for action on mitigation was the following day. The risk was to be mitigated before 16 Jan 2004 (the end date), as the project was to start on 19 Jan 2004.
The cause, as envisaged during risk analysis, was inadequate inter-group coordination. Controls for the risk that existed at the time were manual status tracking of applications by visa cell. The risk took high priority (the colour red).
The mitigation action recommended was to keep have a joint capacity planning and keep all the stakeholders informed whenever a team was identified.
Using the toolkit, the cost-benefit ratio was found to be 5.06. It was calculated as savings over investment, where
Savings = Risk Impact Cost – Risk Mitigation Cost
and
Investment = Risk Mitigation Cost.
Risk impact cost was calculated as cost for retaining current resources. Mitigation cost was calculated as a sum of yearly one-time cost to develop a capacity plan and recurring cost for regular conference calls to keep the stakeholders informed.
Within two weeks of identification, the risk was under control and is now a low risk. A snapshot of the status tracking and reporting form of the risk is shown in Fig. 10. This also shows the audit trail from identification to reporting.
Status Before Status Now No. Description dd/mm/yy dd/mm/yy dd/mm/yy
Immediate action
☺
Satisfactorily
Dealt With 1
Immigration processing delay for associates travelling overseas
Fig. 10: Sample Status Reporting and Tracking
The mitigation of this risk involved all the stakeholders, namely, the project leader, the visa cell representative, the project manager at the client end and one team member.
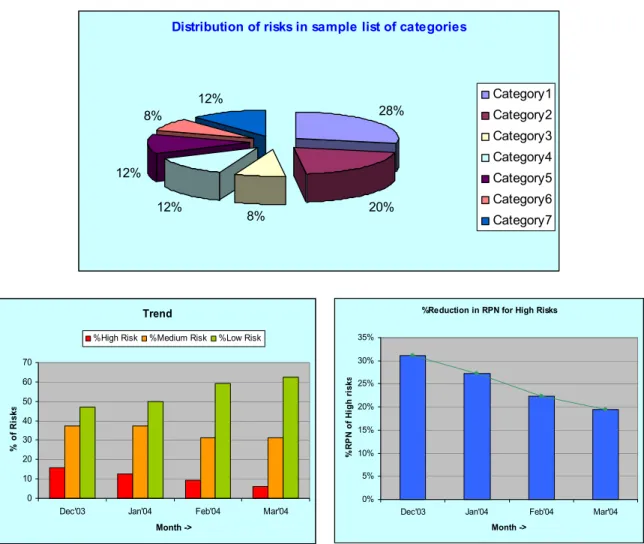
Fig. 11 shows an analysis of the consolidated status of all risks currently active at programme level. Clearly the enhanced FMEA model was effective.
Distribution of risks in sample list of categories 28% 20% 8% 12% 12% 8% 12% Category1 Category2 Category3 Category4 Category5 Category6 Category7 Trend 0 10 20 30 40 50 60 70
Dec'03 Jan'04 Feb'04 Mar'04
Month -> % o f R is ks
%High Risk %Medium Risk %Low Risk
%Reduction in RPN for High Risks
0% 5% 10% 15% 20% 25% 30% 35%
Dec'03 Jan'04 Feb'04 Mar'04
Month -> % R P N of H igh r is ks
Fig. 11: Mitigation Effectiveness Benefits
The benefits may be summarised as follows:
• RPN reduction (from 30% to 19%) for high risks
• Programme risk RPN reduction (from 27% to 23%)
• Systematic risk analysis based on industry standards
• Effective stakeholder involvement and management attention
• Improved risk mitigation process
• Increased synergy between the two organisations
8. Meeting the Drivers and Goal
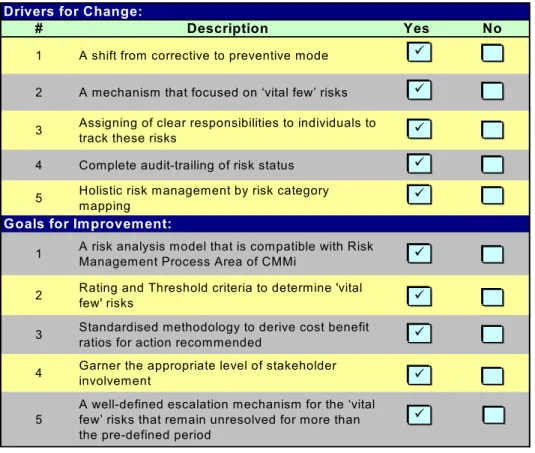
Fig. 12 offers a snapshot of the drivers selected and goals met as a result of the exercise:
Drivers for Change:
# Description Yes No
1 A shift from corrective to preventive mode
2 A mechanism that focused on ‘vital few’ risks
3 Assigning of clear responsibilities to individuals to track these risks
4 Complete audit-trailing of risk status
5 Holistic risk management by risk category
mapping Goals for Improvement:
1 A risk analysis model that is compatible with Risk Management Process Area of CMMi
2 Rating and Threshold criteria to determine 'vital
few' risks
3 Standardised methodology to derive cost benefit
ratios for action recommended
4 Garner the appropriate level of stakeholder involvement 5
A well-defined escalation mechanism for the ‘vital few’ risks that remain unresolved for more than the pre-defined period
Fig 12: Verification of meeting drivers and goals
Going forward, TCS has decided to create a databank on programme risk to help other customers understand the challenges in offshoring, develop assets to manage the risks better and institutionalise the process.
That TCS enjoys the confidence of the client for which it piloted the model is evidenced in the exact words of the customer: “We are happy to [partner with you in adopting the model for managing project risk] . . . . We are trialling this technique in a few IT projects.”
References
[CMMI-SE/SW/IPPD/SS] Capability Maturity Model Integration, Version 1.1.
Project Procedures Manual, Version 8.1. Tata Consultancy Services, October 2003. SEI Risk Management Paradigm. www.sei.cmu.edu/programs/sepm/risk/paradigm. Software Risk Management. Boehm, Barry W., IEEE Computer Society Press, 1989. Software Runaways: Lessons Learned from Massive Software Project Failures. Glass,
Robert L., Prentice-Hall, 1998.
The Six Sigma Way Team Fieldbook. Pande, Pete S., Robert P. Neuman, Roland R. Cavanagh, Tata-McGraw Hill, 2003.