DOES HEALTH CARE SAVE LIVES?
AVOIDABLE MORTALITY REVISITED
Ellen Nolte
Martin McKee
Foreword by John Wyn Owen CB
ISBN 1-902089-94-4 © The Nuffield Trust, 2004
Published by The Nuffield Trust 59 New Cavendish Street London WIG 7LP Telephone: 020 7631 8450 Facsimile: 020 7631 8451 E-mail: [email protected] Website: www.nuffieldtrust.org.uk Charity Number: 209201
Designed by Nicholas Moll Design Telephone: 020 8879 4080 Printed by The Ludo Press Ltd Telephone: 020 8879 1881
in Transition at the London School of Hygiene and Tropical Medicine and Research Fellow at the European Observatory on Health Care Systems.
Professor Martin McKee is Professor of European Public Health in the European Centre on Health of Societies in Transition at the London School of Hygiene and Tropical Medicine and Research Director at the European Observatory on Health Care Systems.
TABLE OF CONTENTS
List of tables . . . .4 List of figures . . . 5 List of boxes . . . 5 Foreword . . . .6 Acknowledgements . . . .7 Executive summary . . . .8 Background . . . .11PART I: THE CONCEPT OF ‘AVOIDABLE’ MORTALITY . . . .15-61 Methods . . . .15
Evolution of the concept of ‘avoidable’ mortality . . . .16
Empirical studies of ‘avoidable’ mortality . . . .33
Scope and nature . . . .33
Variation between places . . . .35
Variation between social groups . . . .36
Variation over time . . . .38
Conceptual problems . . . .42
Relationship to health care inputs . . . .42
Interpreting trends in deaths from amenable mortality over time . . . .44
Selection of ‘avoidable’ conditions and the attribution of health outcomes . . . .47
The changing concept of avoidability . . . .48
Treatment or prevention . . . .51
Contribution of amenable conditions to overall mortality . . . .52
Underlying disease incidence and disease severity at presentation . . . .53
Other limitations . . . .54
Alternative approaches to assess the contribution of medical care to population health . . . .56
Future directions . . . .59
PART II: AVOIDABLE MORTALITY IN THE EUROPEAN UNION . . . .63-99 Introduction . . . .63
Methods . . . .63
Data. . . 63
Selection of causes of death . . . 64
Discussion . . . 91
Trends in temporary life expectancy . . . .91
The contribution of amenable mortality to changing life expectancy . . . .92
Next steps . . . .92
PART III: EMPIRICAL STUDIES OF ‘AVOIDABLE’ MORTALITY . . . .101-123 Glossary . . . .124
References . . . .125
LIST OF TABLES
Table 1 Amenable causes of death: Charlton et al. . . .20Table 2 Amenable causes of death: Poikolainen & Eskola . . . .21-22 Table 3 Amenable causes of death: European Community atlas of ‘avoidable death’ 23-25 Table 4 Amenable causes of death: Mackenbach et al . . . . 27
Table 5 Amenable causes of death: Westerling . . . .28
Table 6 Amenable causes of death: Nolte et al. . . .29
Table 7 Amenable causes of death: Simonato et al. . . .31
Table 8 Amenable causes of death: Tobias & Jackson . . . .32-33 Table 9 Changes in amenable mortality over time: Summary of results from selected studies of ‘avoidable’ mortality . . . .39-41 Table 10 Causes of death considered amenable to health care . . . .66
Table 11 Life expectancy at birth in selected European countries in 1980, 1989, 1990 and 1998 (in years) . . . .69
Table 12 Life expectancy between birth and age 75 in selected European countries in 1980, 1989, 1990 and 1998 (in years) . . . .69
Table 13 Selected measures of population health outcome . . . .93
Table 14 Age-standardised death rates (per 100 000) for selected causes and cause groups in EU countries in 1980, 1990 and 1998: age 0-74 . . . .95 Table 15 Age- and cause specific contributions (in years) to changes
in temporary life expectancy in selected countries
of the European Union between 1980 and 1989 . . . .96-97 Table 16 Age- and cause specific contributions (in years) to changes in
temporary life expectancy in selected countries of the European Union
LIST OF FIGURES
Figure 1 Mortality from respiratory tuberculosis in England and Wales . . . .11 Figure 2 Death rates from tuberculosis in successive years between
1945 and 1955 in England and Wales by age group1 . . . .12 Figure 3 Age- and cause specific contributions to changes in temporary
life expectancy in Austria: 1980-1989 and 1990-1998 . . . .71 Figure 4 Age- and cause specific contributions to changes in temporary
life expectancy in Denmark: 1980-1989 and 1990-1998 . . . .72 Figure 5 Age- and cause specific contributions to changes in temporary
life expectancy in Finland: 1980-1989 and 1990-1998 . . . 74 Figure 6 Age- and cause specific contributions to changes in temporary
life expectancy in France: 1980-1989 and 1990-1998 . . . .75 Figure 7 Age- and cause specific contributions to changes in temporary
life expectancy in west Germany: 1980-1989 and 1990-1998 . . . .77 Figure 8 Age- and cause specific contributions to changes in temporary
life expectancy in Greece: 1980-1989 and 1990-1998 . . . .78 Figure 9 Age- and cause specific contributions to changes in temporary
life expectancy in Italy: 1980-1989 and 1990-1998 . . . .81 Figure 10 Age- and cause specific contributions to changes in temporary
life expectancy in The Netherlands: 1980-1989 and 1990-1998 . . . .82 Figure 11 Age- and cause specific contributions to changes in temporary
life expectancy in Portugal: 1980-1989 and 1990-1998 . . . .84 Figure 12 Age- and cause specific contributions to changes in temporary
life expectancy in Spain: 1980-1989 and 1990-1998 . . . .86 Figure 13 Age- and cause specific contributions to changes in temporary
life expectancy in Sweden: 1980-1989 and 1990-1998 . . . .87 Figure 14 Age- and cause specific contributions to changes in temporary
life expectancy in the United Kingdom: 1980-1989 and 1990-1998 . . . .89 Figure 15 Comparison of rankings based on DALE and amenable mortality rates . . . .93
LIST OF BOXES
Box 1 Health care related factors influencing health outcome . . . .17-18 Box 2 The decline in stroke mortality and its explanations . . . .45-46 Box 3 Confidential enquiries . . . .48 Box 4 The changing meaning of perinatal mortality . . . .49-50
The question of how much health care contributes to the health of populations has been debated for several decades. Writing in the 1970s, Professor Thomas McKeown argued that its contribution had been minor, as much of the decline in mortality in industrialised countries took place before effective health care was available. Instead, he emphasised the role of broader social policies, leading to changes such as better nutrition and cleaner water. However, as several commentators have noted, McKeown was describing a period in which health care still had relatively little to offer. It was only in the 1960s and 1970s that safe and effective drugs for many chronic diseases became widely available.
In the 1980s, several researchers, including Professor Walter Holland, the Nuffield Trust’s 1997 Rock Carling lecturer, began work on what was variously termed avoidable or amenable mortality. This involved looking at deaths that should not occur in the presence of effective and timely health care. This work suggested that health care was indeed having an impact on premature mortality at the population level.
While this work led to much interest at the time, the concept of avoidable mortality has recently received rather less attention. Yet there are now several reasons why we should revisit it. One is the growing international interest in comparing the performance of health systems, exemplified by the World Health Organization’s 2000 World Health Report, with its controversial rankings of health systems. Another is the growing interest in the complex relationship between the health and wealth of nations, exemplified by the report of the Commission on Macro-Economics and Health.
The Nuffield Trust's purpose is to communicate evidence and encourage an exchange around developed or developing knowledge in order to illuminate recognised and emerging issues. As such, it is entirely appropriate that it should contribute to these discussions. One way that it has done this is by publishing this important book, which describes the findings of a study co-funded by the Trust and by Merck & Co., in association with the European Observatory on Health Care Systems.
The authors, Ellen Nolte and Martin McKee, have done an excellent job in assembling the extensive literature that now exists on avoidable mortality, bringing the definitions up to date, and then applying them to patterns of mortality in a range of industrialised countries. They confirm that health care has made an appreciable difference to population health, while showing that the impact varies among countries.
This work bridges two of the Trust’s key themes, public health and quality in health care, and I commend it to health service researchers and health policy makers interested in benchmarking the performance of health systems.
John Wyn Owen C.B. Secretary, Nuffield Trust February 2004
ACKNOWLEDGEMENTS
This report was made possible by an unrestricted educational grant by Merck, Sharp & Dohme (MSD). We are especially grateful to Melinda Hanisch of MSD for her continuing support, encouragement and interest in this work, as well as to Heather Richmond and Jeffrey Sturchio. We are also grateful to the Nuffield Trust for their additional support of our work on health systems, and in particular to John Wyn Owen. Further we would like to thank Professor Walter W. Holland, London School of Economics, Professor Johan P.
Mackenbach, Erasmus University Rotterdam, Professor Reinhard Busse, Technical University Berlin, and Dr Chris Bain, University of Queensland, for their very helpful comments and suggestions on an earlier draft.
Ellen Nolte is a Lecturer in Public Health at the London School of Hygiene and Tropical Medicine, funded by the Nuffield Trust and the European Observatory on Health Care Systems. Martin McKee is Professor of European Public Health at the London School of Hygiene and Tropical Medicine and a research director of the European Observatory on Health Care Systems. The Observatory is a partnership of the World Health Organisation, World Bank, European Investment Bank, Open Society Institute, the governments of Greece, Norway and Spain, the London School of Hygiene and Tropical Medicine and the London School of Economics and Political Science. For further information please see www.observatory.dk
The views expressed in this report are those of the authors alone and should not be taken as representing those of any of the organisations mentioned.
Does health care save lives? Commentators such as McKeown and Illich, writing in the 1960s, argued that it played very little part, and might even be harmful. However they were writing about a period when health care had relatively little to offer compared to today. Since then, several writers have described often quite substantial improvements in death rates from conditions for which effective interventions have been introduced. But the debate continues, with some arguing that health care is making an increasingly important impact on overall levels of health while others contend that it is in the realm of broader policies, such as education, transport and housing, that we should look to for future advances in health. Inevitably this is to a considerable extent a false dichotomy. Both are important. But how much does health care contribute to population health?
One way in which this question has been addressed previously is to look at deaths that should not occur in the presence of effective and timely health care, so-called ‘avoidable’ mortality. However much of this work was undertaken in the 1980s and early 1990s, since when health care has advanced considerably. In addition, ‘avoidable’ deaths were often limited to those before, for example, the age of 65, a figure that seems inappropriately low in the light of life expectancies that are now about 80 in many countries.
In this review we have traced the evolution of the concept of ‘avoidable’ mortality from its inception in the 1970s. We have undertaken a detailed methodological critique of this concept, examining questions of attribution, issues relating to comparisons over time and place, and relationships with other indicators of health service provision. To help future researchers we have produced a comprehensive, annotated review of the work that has been undertaken worldwide so far.
We note that ‘avoidable’ mortality was never intended to be more than an indicator of potential weaknesses in health care that can then be investigated in more depth. We describe examples of where this approach has been successful, drawing attention to problems that might otherwise have been missed.
In contrast, many of the critics of ‘avoidable’ mortality, or more specifically, mortality amenable to health care (amenable mortality), have asked that it do something it was not intended to do, to be a definitive source of evidence of differences in effectiveness of health
E X E C U T I V E S U M M A R Y
care. Thus, it is not unexpected that studies seeking to link amenable mortality with health care resources have failed to do so, especially when undertaken within countries, although it is notable that where gross differences exist, as between western and eastern Europe, the gap in amenable mortality is especially high. For these reasons, it seems justifiable to continue and extend the extensive body of research that has already been undertaken to look at ‘avoidable’ mortality, updating the list of conditions included to reflect the changing scope of health care and extending the age limit to reflect increasing expectation of life. However it must be recognised that the concept of ‘avoidable’ mortality does have
important limitations, relating to comparability of data, attribution of causes, and coverage of the range of health outcomes.
Comparisons of health system performance are now firmly on the international policy agenda, especially since the publication of the 2000 World Health Report. Incorporation of the concept of mortality amenable to health care into the methodology used to generate the rankings of health systems in that report would be an advance on the current situation. We show how, within Europe, this would lead to different rankings from those based on overall disability adjusted life expectancy, which is used in the current rankings.
However, any approach based on aggregate data would not address one of the major
criticisms of such comparisons, that they do not indicate what needs to be done when faced with evidence of sub-optimal performance. This requires a more detailed analysis of the specific issues facing health systems. Here we propose a new method, in which analyses of amenable mortality identify areas of potential concern that are then examined in more detail by studying the processes and outcomes of care for tracer conditions, selected on the basis of their ability to assess a wide range of health system components.
The second part of the review applies the refined method of amenable mortality analysis to patterns of mortality in the countries of the European Union over the past two decades. This shows that deaths that could be prevented by timely and effective care were still relatively common in many countries in 1980. Reductions in these deaths contributed substantially to the overall change in life expectancy between birth and age 75 during the 1980s. The largest contribution was from falling infant mortality but in some countries reductions in deaths among the middle aged was equally or even more important. These countries were Denmark, The Netherlands, the United Kingdom, France (for men) and Sweden (for women).
In contrast, during the 1990s, reductions in amenable mortality made a somewhat smaller contribution to improved life expectancy, especially in the northern European countries. However they remained important in southern Europe, especially in Portugal and Greece, where the initial death rates had been higher.
These findings provide clear evidence that improvements in access to effective health care have had a measurable impact in many countries during the 1980s and 1990s, in particular through reductions in infant mortality and in deaths among the middle aged and elderly, especially women. However the scale of impact has, to a considerable extent, reflected the starting point. Thus, those countries where infant mortality was relatively high at the beginning of the 1980s, and which had the greatest scope for improvement, such as Greece
and Portugal, unsurprisingly saw the greatest reductions in amenable mortality in infancy. In contrast, in countries with infant mortality rates that had already reached very low rates by the beginning of the 1990s, such as Sweden, the scope for further improvement was small.
Similarly, the scope for improvement in amenable deaths in adulthood was greatest in those countries where initial rates were highest. The corollary of this is that as rates fall in all countries, the extent of variation decreases. As a consequence, it seems likely that, in the 21st century, the ability to compare health system performance using mortality data at the aggregate level is likely to be limited, simply because the differences will be relatively small. This does not, however, mean that there is not scope for analyses that use amenable
mortality rates to screen for potential problems that can then be explored in more depth. It also does not exclude the use of amenable mortality to gain new insights into inequalities in access to care within populations.
BACKGROUND
The publication by the World Health Organisation (WHO) of the 2000 World Health Report1, with its rankings of the performance of health care systems, as well as subsequent
methodological work by the OECD, has placed the issue of health system performance on the international health policy agenda.2
As defined by the WHO, health system performance has three dimensions, health attainment, responsiveness, and fairness of financing. Health attainment is defined as healthy life expectancy, or the length of time that someone in the country in question can expect to live in good health. This measure has the advantage that it can be obtained for many countries, although it should also be noted that the adjustment of life expectancy for levels of health in most cases involves a process of estimation and, in a majority of
countries even life expectancy must be estimated because of the absence of comprehensive mortality data. However it also has an important weakness. Overall health attainment will reflect the influence of very many different factors, only some of which lie within the health care system. Thus, for example, in western Europe there is a significant correlation between overall health attainment, as reported in the World Health Report, and national levels of consumption of fruit and vegetables, as an indicator of a healthy diet.
Yet it is apparent from everyday experience that health care has some influence on levels of health. Many conditions that would once have been fatal can now be cured, such as
common childhood infections. The discovery of insulin has transformed juvenile onset diabetes from what was once an acute, rapidly fatal disease of childhood into one that is compatible with a normal lifespan. The crucial question is not whether health care contributes to population health but how much it does? Is its effect only marginal or does it play a more important role? And, in the debate about health system performance, is it possible to build on what is known about this relationship to create a more refined measure of health system performance that can inform international comparisons?
The question of whether health services make a meaningful contribution to population health has long been debated.3Several authors, writing from a historical perspective in the
late 1970s, argued persuasively that health care had contributed little to the decline in mortality that had occurred in industrialised countries from the mid nineteenth to mid twentieth century. They proposed that this improvement was most likely to be due to the
influence of factors outside the health care sector, in particular nutrition, but also improvements in the environment.4,5,6Indeed some, such as Illich, have argued that
developments in health care in the 1950s and 1960s were actually damaging health, introducing the word iatrogenesis.7
The name of Thomas McKeown is perhaps that most closely identified with the argument that health care contributed little to population health.4His study of the decline in
mortality in England and Wales between 1848/54 and 1971 provided some memorable images, in particular how the largest part of the decline in mortality from tuberculosis predated the introduction of immunisation or effective chemotherapy (Figure 1).
Figure 1 Mortality from respiratory tuberculosis in England and Wales (source: McKeown4)
Yet while this representation is accurate, it is also true that the introduction of
chemotherapy had a quite remarkable impact on death rates from tuberculosis among young people, as can be seen in Figure 2, which shows the year on year decline in mortality from tuberculosis in England and Wales at different ages between 1945 and 1955, the period during which chemotherapy was being introduced.
Figure 2 Death rates from tuberculosis in successive years between 1945 and 1955 in England and Wales by age group
McKeown’s arguments have been embraced enthusiastically, in particular by groups seeking to challenge the perceived emphasis given to health care in the debate about the
determinants of health, with arguments implying that, as in the late nineteenth and early twentieth centuries, health care continues to contribute little to population health. However, as the example of tuberculosis shows, the reality is not quite so simple. Thus, Mackenbach has examined changing mortality over a similar period, 1875/79 and 1970, in The
Netherlands, and come to a somewhat different conclusion.8He accepts that antibiotics
were only introduced after mortality from infectious diseases had already fallen substantially but he showed how their use was associated with acceleration in the rate of decline. Thus, between 1921 and 1939, when only some sulphonamides were available in The
Netherlands, the annual decline of mortality from infectious diseases was 4% per annum, whereas subsequently, when antibiotics such as penicillin became widely available, mortality from infectious disease declined by 10% per annum. Setting an (arbitrary) cut-off point at 1946 to mark the general introduction of antibiotics in The Netherlands, he estimated, on the basis of the known effects of antibiotics on specific infectious diseases, that between 1.6 and 4.8% of the total decline in infectious disease mortality between 1875/79 and 1970 could be attributed to medical care. Further analyses also examined the potential impact of the decline in mortality from common surgical conditions, such as appendicitis and
cholecystitis, resulting from improvements in surgery and anaesthesia from around 1930, and from perinatal conditions, reflecting improvements in antenatal and perinatal care since the 1930s. Taking account of all of these factors he estimated that between 5 and 18.5% of the total decline in mortality between 1875/79 and 1970 in The Netherlands could be attributed to health care.
More recently there have been a series of reviews of the contribution of health care to health and there is now consensus that McKeown was correct to the extent that “curative medical measures played little role in mortality decline prior to mid-20th century.”9However the
rapidly changing scope and nature of health care does not mean that this can be assumed still to be the case.
Indeed, the scope of health care has changed enormously in the second half of the twentieth century. The change is not only in the more obvious areas such as new pharmaceuticals and technology but also in new and more effective ways of organising care, such as the
introduction of multi-disciplinary stroke units or integrated screening programmes, and in the development of evidence-based care, enabling traditional but ineffective treatments to be discarded while innovative and effective ones are adopted and diffused more rapidly. Thus, while health care may have made little contribution to population health in the past it may now be playing a rather more important role.
Several approaches have been developed in attempts to quantify this contribution. The most widely used makes use of the ready availability of mortality data at a population level and is based on the concept of deaths from certain causes that should not occur in the presence of timely and effective health care. This has given rise to the development of a variety of terms including “avoidable mortality” and “mortality amenable to medical/health care”.
Although attempts to systematically assess the quality of medical care using routine data of vital statistics go back to the 1950s10and the actual term “avoidable mortality” has been
used since at least the 1960s11, its origins in the form in which it is commonly understood
date from the work of Rutstein and co-workers to develop a measure of the quality of medical care in the mid-1970s. This concept has been commented on and/or reviewed by several authors, most notably Holland, Mackenbach and Westerling.12,13,14 However much
of this work dates from the late 1980s and early 1990s and it has received relatively little recent attention. Indeed, as the 2000 World Health report shows, the concept has been overlooked in some influential recent studies. In addition, the rapid increase in the pace of change in health care, as well as increasing expectation of a healthy life, make it important to revisit this concept. Does ‘avoidable’ mortality still offer a means of assessing health system performance and is the list of causes of death previously deemed to be avoidable still valid?
This publication is in three parts. Part I reviews the existing literature on ‘avoidable’ mortality to create a framework for analysis that takes account of contemporary
circumstances and part II applies this framework to routinely available mortality data in European countries. Part III provides a comprehensive, annotated review of empirical studies of ‘avoidable’ mortality that have been undertaken worldwide so far.
PART I:
THE CONCEPT OF ‘AVOIDABLE’ MORTALITY
A LITERATURE REVIEW
Methods
Literature on “avoidable mortality” was identified from a variety of sources. The main ones were MEDLINE and HMIC. These were searched for the years 1966 (Medline) or 1979 (HMIC) to the present, using the search terms “amenable mortality”, “avoidable mortality”, “amenable causes”, “avoidable causes”, “unnecessary deaths”, “untimely deaths”, “quality of health care”, “health care and (health) outcome”. References cited in papers identified by this search were followed up. The review concentrates on literature published in peer-reviewed journals and includes empirical studies as well as conceptual papers. In addition, the series of European Community (EC) publications on avoidable deaths were included as they have made a major contribution to the conceptual development of ‘avoidable’ mortality. Therefore, related literature, although not necessarily peer-reviewed, was also included whereas national statistical reports, some of which touched on the concept of avoidable mortality, were not included. The only exceptions were one study published by the Centers for Disease Control (CDC), which formed the basis for subsequent studies on ‘avoidable’ mortality in the USA. In addition, a conference paper presented by Mackenbach that updated his earlier work was used as was a report commissioned by the UK Department of Health that reviewed and extended further the list of ‘avoidable’ causes of death that had formed the basis for the EC studies of avoidable deaths. Studies looking at selected causes of ‘avoidable’ death such as tuberculosis or cervical cancer only were excluded as were those using the term avoidable death or mortality in a broader sense without referring particularly to the underlying concept of “avoidable mortality”. Finally, the review is limited to work published in English, French or German.
The first section looks specifically at the evolution of the concept of ‘avoidable’ mortality and how it has changed over time. This is followed by an overview of the findings of studies applying this concept at the population level. The third section will examine the conceptual problems that arise when using “avoidable mortality” as an indicator of quality of care, and is followed by a concluding section that will explore alternative approaches.
Evolution of the concept of ‘avoidable’ mortality
The concept of “avoidable mortality” as it has been used over the last 25 years, stems from the Working Group on Preventable and Manageable Diseases led by David Rustein of Harvard Medical School in the USA in the 1970s.15They introduced the notion of
‘unnecessary untimely deaths’ by proposing a list of conditions from which death should not occur in the presence of timely and effective medical care. Medical care was defined in its broadest sense as prevention, cure and care, and including “the application of all relevant medical knowledge [...], the services of all medical and allied health personnel, institutions and laboratories, the resources of governmental, voluntary, and social agencies, and the co-operative responsibility of the individual himself”. Using this broad definition, the Working Group selected over 90 conditions as ‘sentinel health events’ since cases of disease, disability or death from these conditions were considered to be preventable and/or treatable by
appropriate and timely medical care.
Whilst acknowledging that the chain of responsibility to prevent the occurrence of such a disease or death may be complex (Box 1), and that the physician cannot be solely
responsible for failures that result in a sentinel health event, the authors argue that the physician nevertheless has a crucial role as being the “one competent to provide the leadership and the professional guidance” to inform (community) action to prevent such events. Information on sentinel health events may therefore serve as an index of the quality of care delivered by particular providers, agencies, and institutions or by particular health care sectors. Following this line of reasoning, the list includes not only conditions where the role of medical care appears to be obvious, as for example in the case of appendicitis, but also conditions where the contribution of medical care is usually believed to be small, such as lung cancer.
The conditions thus identified were separated into those where even a single case of disease or disability or untimely death justifies an immediate enquiry into the question ‘Why did it happen?’ as, for example in cases of botulism or death from cervical cancer (‘clear-cut’ indicators or ‘single case index’) and conditions where not every single case is considered preventable or manageable but in which appropriate medical care should be associated with a lower incidence of that condition, such as the vascular consequences of treated or
untreated hypertension (‘index based on rates’). In addition, each condition was categorised as to whether the unnecessary disease or disability or untimely death is treatable and/or preventable. Thus, diphtheria is considered a disease preventable by immunisation whereas unnecessary untimely death from this condition may be both preventable, again by
immunisation, and treatable, by administering antitoxin and antibiotics. However, lung cancer is considered preventable only, by means of actions such as reducing or eliminating exposure to cigarette smoking, asbestos and some other occupational factors, as treatment is rarely successful once the disease has arisen. In addition, some conditions were considered sentinel only at certain ages, for example deaths from acute respiratory infections under age 50.
Box 1 Health care related factors influencing health outcome
“The unnecessary case of diphtheria, measles, or poliomyelitis may be the responsibility of the state legislature that neglected to appropriate the needed funds, the health officer who did not implement the program, the medical society that opposed community clinics, the physician who did not immunize his patient, the religious views of the family, or the mother who didn’t bother to take her baby for immunization [...] Death from cancer of the lung may be due to the patient’s unwillingness or inability to give up cigarette smoking, the reassuring statements put out by the advertiser or manufacturer, the absence of an effective health-information program in the public schools and in the community, or, more rarely, from an error in diagnosis or from poor surgical care.”15
In 1996 Westerling reviewed published evidence of avoidable factors influencing death.16 He
showed that of the studies included 45% identified inadequate diagnosis and 51% inadequate treatment as avoidable factors. Other important factors identified were delay in diagnosis (22%) or treatment (31%), failure in preventing, recognising or treating
complications (34%), deficiencies in management of care, such as coordination of different levels of care (17%) as well as some patient characteristics, especially psychosocial factors and health care seeking behaviour (20%). These factors varied according to outcome, however, with, for example, avoidable factors for trauma death being related, mainly, to hospital care, e.g. delay in diagnosis of injury, failure to recognise injury severity, lack or delay of surgical treatment and failures in the management of complications. The overall proportion of trauma deaths potentially avoidable was estimated at 27%. In contrast, about half of deaths from asthma were identified as having avoidable factors, largely delays in seeking professional help, attributable to lack of information and education but also to poor access to care in remote areas and inadequate assessment or treatment of asthma episodes.
The flowchart shown overleaf illustrates some main factors related to health care that have a potential impact on the health outcome.
Box 1 Health care related factors influencing health outcome - continued Disease/risk presentation Diagnosis Treatment Outcome Access to care: - GP density - Travel time - Opening hours - Waiting/contact time Management of complications: - recognition - availability of treatment - adequacy of treatment - timeliness Treatment: - facility availability - adequacy - timeliness - follow-up Medical misconduct Prevention of complications Recognition of condition Diagnosis: - availability - accuracy - sensitivity - timeliness Coverage / co-payment Cooperation / integration of services
Access to care: eligibility Public health programme Community programme
Coverage / co-payment Cooperation / integration of services
Individual and social characteristics determining likelihood of contracting
disease and/or health seeking behaviour: education/social class; health beliefs, level of concern, costs
of diagnosis/ screening/treatment
Organisation of health care: care level Organisation of
Rutstein et al.’s original work was undertaken in the mid 1970s, when the 8th revision of the International Classification of Diseases (ICD), used to classify causes of death, was in use. Consequently, in 1977 and 1980 revisions of the lists of unnecessary untimely disease, disability and death were undertaken to take account of the recently introduced 9th revision, as well as to consider certain advances in health care.17,18These lists have formed
the basis for practically all subsequent studies on ‘avoidable mortality’.
A first empirical application of this concept was undertaken by Adler in 1978 who used conditions that were considered single case markers by Rutstein et al. to “demonstrate the usefulness of this approach” to measure the quality of medical care by evaluating
preventable mortality in the USA in 1968-1971.19However Charlton et al. were the first to
apply this concept at the population level to analyse regional variation in mortality in England and Wales in 1974-78, also introducing the terms “avoidable deaths” and
“[conditions] amenable to medical intervention”.20Based on Rutstein’s list they selected 14
disease groups chosen to reflect different aspects of health care including primary care, general practice referrals to hospitals and hospital care.21However conditions whose
avoidance was considered to be outside the scope of medical care, such as lung cancer and causes of death that were very rare, were excluded (Table 1). Age limits were set within which each cause was deemed potentially avoidable, most often 5-64 years. Table 1 also lists, for each condition, those health care providers and related interventions that were considered relevant to prevent untimely death.
Using various modifications of their original list of avoidable conditions that, following the findings of the Hypertension Detection and Follow-up Program Co-operative Group subsequently also included cerebrovascular disease, Charlton et al. extended their work to examine trends in mortality amenable to medical intervention at the national22,23and
international level, for example in England & Wales, USA, France, Japan, Italy and Sweden between 1956 and 1978.24
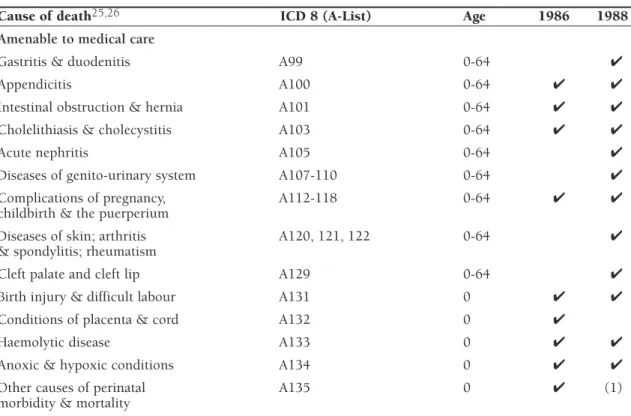
A subsequent study to assess the impact of health care or health services using the concept of ‘avoidable mortality’ was undertaken by Poikolainen and Eskola who looked at trends in Finland between 1969 and 1981.25 Their list of conditions considered amenable to health
services was also based on the work by Rutstein and co-workers and covered a total of 22 conditions or groups of conditions, including five causes of perinatal death (Table 2). Similar to Charlton et al.20their list included conditions such as tuberculosis, cervical
cancer, hypertensive disease and asthma and excluded conditions such as lung cancer whose prevention, they argued, depended mainly on efforts outside the health services. Again, as with Charlton et al., they defined an upper age limit, which was usually 65 years, although for some conditions such as diabetes or asthma this limit was set lower, at age 50. However acknowledging that there had been innovations in health care, they also analysed a separate set of seven “partly amenable” conditions that had become amenable during the study period. These included ischaemic heart disease, non-melanoma skin cancer and meningitis.
In a further study that compared 25 developed countries, Poikolainen and Eskola extended their original list, covering in total more than 70 amenable conditions and another 20 partly-amenable conditions (Table 2), thus expanding the concept of “avoidable mortality”
TH CARE SA VE LIVES? A V OID ABLE MOR T ALITY REVISITED
Hypertensive disease † 400-404 401-405 5-64 primary care, hospital Case detection, anti-hypertensive
medication
Cancer of cervix uteri 180 180 5-64 primary care, hospital, Screening, surgery, radiation therapy community health services,
pathological services
Pneumonia & bronchitis 480-486, 490 480-486, 490 5-49 primary care, hospitals Antibiotics, early detection of complications Tuberculosis (excl. silico) ‡ 011-019 010-018 5-64 public health programme, Immunisation, contacts tracing, antibiotics
primary care, hospital
Asthma 493 493 5-49 primary care,hospital Therapy, casualty department care
Chronic rheumatic 393-398 393-398 5-44 primary care,hospital Case detection of streptococci, antibiotics,
heart disease prophylaxis
Acute respiratory disease 460-466, 470-474 400-466, 470-474 5-49 primary care,hospital Early detection of complications, antibiotics Bacterial infections* 004, 034, 320, 004, 037, 320-322, 5-64 primary care,public health Early detection of complications, antibiotics
381-383, 390-392, 382-384, 390-392, programmes, hospital 680-686, 710, 720 680-686, 711, 730
Hodgkin’s disease 201 201 5-34 primary care,hospital, Case detection, chemotherapy
pathological services and radiation therapy
Abdominal hernias 550-553 550-553 5-64 primary care, hospital Case detection, surgery prior to complications Acute & chronic cholecystitis 574-575 574-575.1 5-64 primary care, hospital Case detection, surgery prior to complications Appendicitis 540-543 540-543 5-64 primary care, hospital Case detection, surgery prior to complications
Maternal deaths 630-678 630-676 10-44
Deficiency anaemias 280-281 280-281 5-64 primary care,hospital, Case detection, laboratory services pathological services
Perinatal mortality -
-† subsequently combined with cerebrovasuclar disease (ICD8,9: 430-438; age 35-64); ‡Silico tuberculosis excluded in ICD8; not separately identified in ICD9
considerably.26They also drew up an explicit list of “not amenable” conditions. Importantly,
this list of not amenable conditions included cerebrovascular disease, a condition that had just been added to the list of conditions considered amenable to health care by Charlton et al.24Also in contrast to other work, chronic rheumatic heart disease was considered only
partly amenable to medical care. Reasons for this selection were not, however, given. At the same time, building on the work by Charlton et al.20, the EC Concerted Action
Project on Health Services and ‘Avoidable Deaths’, established in the early 1980s, adopted and modified the concept of avoidable mortality, resulting in the publication of the
European Community Atlas of ‘Avoidable Death’ in 1988, a major work that has since been updated twice.27,28,29,30,31The first edition and the first volume of the 2nd edition each
cover 17 disease groups, which were considered to be effectively treatable or preventable by health care services (Table 3). Health care services were interpreted as to include primary care, hospital care, and collective health services such as screening and public health programmes, e.g. immunisation. The conditions were chosen on the basis of having “identifiable effective interventions and health care providers”. Named ‘avoidable death indicators’ these causes intended to “provide warning signals of potential shortcomings in health care delivery”.27
T H E C O N C E P T O F ‘ A V O I D A B L E ’ M O R T A L I T Y — A L I T E R A T U R E R E V I E W
Cause of death25,26 ICD 8 (A-List) Age 1986 1988
Amenable to medical care
Infectious diseases (1986) A1-12, 16-17, 20, 22-26, 0-64 ✔ 34-38, 42, 78, 119, 123
Infectious diseases (1988) A1-20, 22-26, 28, 31, 0-64 ✔
33-43, 119, 123
Malignant neoplasm of cervix uteri A55 0-64 ✔ ✔
Diabetes mellitus A64 0-49 ✔ ✔
Goitre, thyrotoxicosis, avitaminoses A62, 63, 65 0-64 ✔ ✔
& nutritional defiencies
Epilepsy A74 0-64 ✔ ✔
Inflammatory diseases of eye, A75-78 0-64 ✔
cataract, glaucoma
Active rheumatic fever A80 0-64 ✔ ✔
Hypertensive disease A82 0-64 ✔ ✔
Venous thrombosis and embolism A87 0-64 ✔
Acute respiratory infections; A89-92 0-49 ✔ ✔
influenza; pneumonia
Bronchitis, emphysema & asthma A93 0-49 ✔ ✔
Hypertrophy of tonsils; A94-95 0-49/64 ✔
empyema & abcess of lung
Diseases of teeth and supporting structures A97 0-49 ✔
Peptic ulcer A98 0-64 ✔ ✔
Cause of death25,26 ICD 8 (A-List) Age 1986 1988
Amenable to medical care
Gastritis & duodenitis A99 0-64 ✔
Appendicitis A100 0-64 ✔ ✔
Intestinal obstruction & hernia A101 0-64 ✔ ✔
Cholelithiasis & cholecystitis A103 0-64 ✔ ✔
Acute nephritis A105 0-64 ✔
Diseases of genito-urinary system A107-110 0-64 ✔
Complications of pregnancy, A112-118 0-64 ✔ ✔
childbirth & the puerperium
Diseases of skin; arthritis A120, 121, 122 0-64 ✔
& spondylitis; rheumatism
Cleft palate and cleft lip A129 0-64 ✔
Birth injury & difficult labour A131 0 ✔ ✔
Conditions of placenta & cord A132 0 ✔
Haemolytic disease A133 0 ✔ ✔
Anoxic & hypoxic conditions A134 0 ✔ ✔
Other causes of perinatal A135 0 ✔ (1)
morbidity & mortality
Partly amenable to medical care
Meningococcal infection A19 0-64 ✔ (2)
Other bacterial/viral disease, A21, 29, 44 0-64 ✔
all other infective/parasitic disease
Malignant neoplasm of buccal A45 0-64 ✔ ✔
cavity and pharynx
Malignant neoplasm of larynx A50 0-64 ✔
Malignant neoplasm of skin A53 0-64 ✔ ✔
Benign neoplasm & unspec. A61 0-64 ✔
Other endocrine and metabolic disease A66 0-64 ✔
Other diseases of blood A68 0-64 ✔
& blood-forming organs
Meningitis A72 0-64 ✔ ✔
Other diseases of nervous system A79 0-64 ✔
& sense organs
Chronic rheumatic heart disease A81 0-64 ✔ ✔
Ischaemic heart disease; other heart disease A83-84 0-64 (3) ✔
Other diseases of circulatory system A88 0-64 ✔
Other diseases of respiratory system A96 0-64 ✔
Other diseases of digestive system A104 0-64 ✔
Other diseases of genito-urinary system A111 0-64 ✔
Other diseases of musculoskeletal system A125 0-64 ✔
Symptoms and other ill-defined conditions A137 0-64 ✔
Table 2 Amenable causes of death: Poikolainen & Eskola (continued)
THE CONCEPT OF ‘A V O ID ABLE’ MOR T ALITY — A LITERA TURE REVIEW 23 Volume
Cause of death 27-31 ICD 9 Age 1988/91 1993 1997 Health care providers Intervention Infectious diseases
Typhoid 001 5-64 ✔ Public health programme, Case detection,
Whooping cough 033 0-14 ✔ primary care, hospital immunisation,
Tetanus 037 0-64 ✔ treatment of complications
Measles 055 1-14 ✔
Osteomyelitis 720 1-64 ✔
Intestinal infections 001-009 0-14 ✔ Public health programme, Case detection, immunisation
primary care, hospital treatment of complications
Tuberculosis 010-018, 5-64 ✔ ✔ Public health programme, Screening, early detection
137 primary care, hospital of cases, immunisation
contact tracing, antibiotics
Malignant neoplasm of breast 174 25-64 ✔ Public health programme: Case finding, screening,
screening in ages 50-64, surgery, radiotherapy, primary care, hospital chemotherapy
Malignant neoplasm of skin 173 35-64 ✔ Public health programme, Primary prevention,
primary care, hospital case finding, surgery, radio therapy
Malignant neoplasm 180 15-64 ✔ ✔ Community health services, Screening, cytology,
of cervix uteri* primary care, hospital surgery, radiotherapy
Malignant neoplasm of cervix 179, 180, 15-54 ✔ ✔ Community health services, Screening, cytology, surgery,
uteri and body of the uterus* 182 primary care, hospital radiotherapy
Malignant neoplasm of testis 186 0-64 ✔ Public health programme, Case finding, surgery,
primary care, hospital chemotherapy, radiotherapy
Hodgkin’s disease 201 5-64 ✔ ✔ Primary care, hospital, Case detection, chemotherapy,
pathological services radiotherapy
Leukaemia 204-208 0-44 ✔ Hospital Chemotherapy, radiotherapy,
bone marrow transplant Table 3 Amenable causes of death: European Community atlas of ‘avoidable death’
TH CARE SA VE LIVES? A V OID ABLE MOR T ALITY REVISITED
Cause of death ICD 9 Age 1988/91 1993 1997 Health care providers Intervention
Chronic rheumatic heart disease 393-398 5-44 ✔ ✔ Primary care, hospital Case detection of streptococci, antibiotics, prophylaxis, valve replacement surgery Ischaemic heart disease 410-414, 429.2 35-64 ✔ ✔ Primary care,hospital, Primary prevention
health education
Hypertensive & cerebrovascular 401-405 35-64 ✔ ✔ Primary care, hospital Case detection,
antihyperten-disease 430-438 sive medication, treatment of
complications of hypertensive disease
All respiratory diseases 460-519 1-14 ✔ ✔ Primary care, hospital Early detection of
complications, antibiotics
Asthma 493 5-44 ✔ ✔ Primary care, hospital Casualty department care,
treatment, early referral of status asthmaticus
Peptic ulcer 531-534 25-64 ✔ ✔ Primary care, hospital Anti-ulcer drugs, surgery for
complications
Appendicitis 540-543 5-64 ✔ ✔ Primary care, hospital Case detection, surgery
Abdominal hernia 550-553 5-64 ✔ ✔ Primary care, hospital Case detection, surgery prior
to complications
Cholelithiasis & cholecystitis 574-575.1, 576.1 5-64 ✔ ✔ Primary care, hospital Case detection, surgery prior to complications
Congenital cardiovascular anomalies 745-747 1-14 ✔ Hospital Drugs, surgery
Maternal deaths (all causes) 630-676 All ages ✔ ✔ Primary care, hospital Antenatal care, obstetric care Perinatal mortality All causes < 1wk + ✔ ✔ Primary care, hospital Antenatal care, obstetric care,
The indicators were designed to illustrate different components of health care provision: primary, secondary and preventive, and to assess the outcome of health services for the residents of defined geographical areas. Three disease groups included in the list were considered “primary prevention indicators”, as their avoidability was believed to be more dependent on actions outside the direct control of health services. For the remaining 14
conditions/groups of conditions it was believed that it was “reasonably certain” that effective treatment or secondary prevention is available. The 2nd edition, published in 1991 was supplemented by a second volume in 1993, covering a further eight conditions, reflecting advances in medical knowledge and “extensions of the abilities of the health services and their technical infrastructures.”30However, compared
with the 14 causes covered earlier, the role of health services in the reduction of mortality from these eight conditions was less certain. The authors believed it “reasonably certain that effective treatment or primary or secondary prevention could be provided by health services, although there is considerable controversy over the avoidability of death from, for example, congenital anomaly.” Consequently it was assumed that while not all deaths from these causes would be avoidable, health services could contribute substantially to minimising mortality. As with the concept of ‘partly amenable’
conditions developed by Poikolainen and Eskola25, the supplemented list included
ischaemic heart disease and skin cancer. Finally, the 3rd edition of the EC Atlas of ‘Avoidable Death’ used a combination of causes from the 17 plus eight conditions included in earlier editions, resulting in a total of 16 conditions (Table 3).
Similar to Charlton et al.20 age limits were set
for each condition to improve the “validity of mortality as an indicator of health service
T H E C O N C E P T O F ‘ A V O I D A B L E ’ M O R T A L I T Y — A L I T E R A T U R E R E V I E W
T
able 3
Amenable causes of death: Eur
opean Community atlas of ‘avoidable death’ (
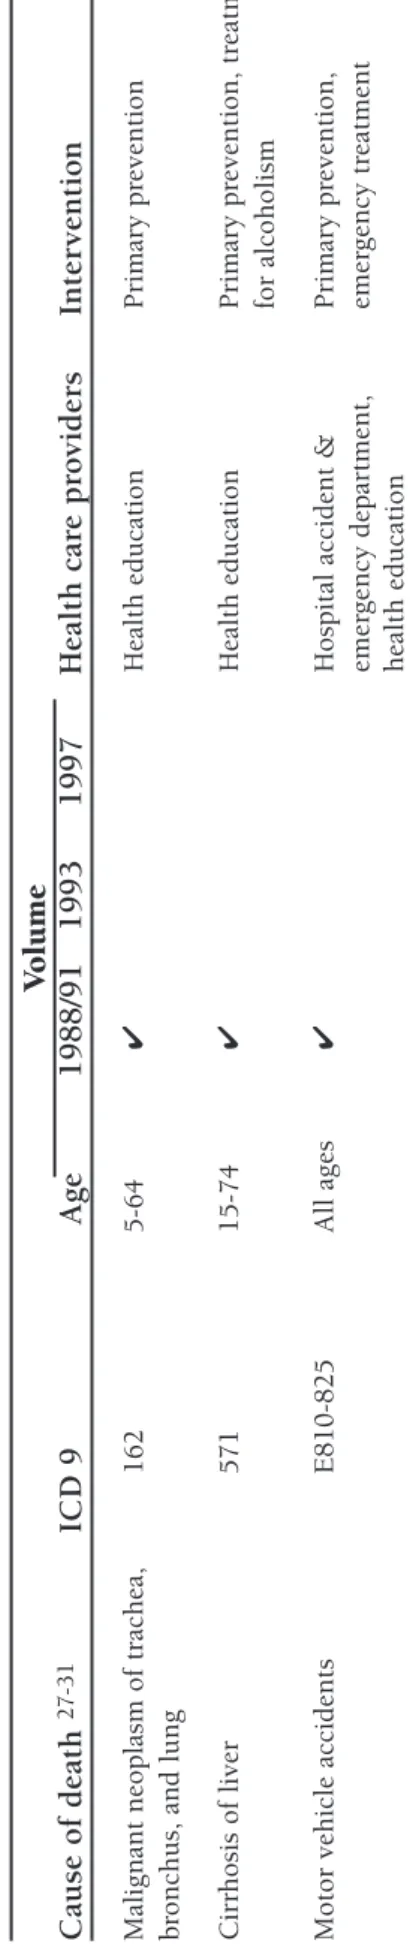
continued ) V olume Cause of death 27-31 ICD 9 Age 1988/91 1993 1997 Health car e pr oviders Inter vention
Malignant neoplasm of trachea,
162 5-64 ✔ Health education Primary pr evention br
onchus, and lung
Cirr hosis of liver 571 15-74 ✔ Health education Primary pr evention, tr eatment for alcoholism
Motor vehicle accidents
E810-825
All ages
✔
Hospital accident &
Primar y pr evention, emer gency depar tment, emer gency tr eatment health education
* overlap due to possible variation in coding practice: in some countries cancer of cer
vix uteri may be included in codes 179 a
outcome”, set at under 65 for most causes.27As noted above, the conditions selected were
intended to cover a range of different health services. The authors did, however, emphasise that they did not include all conditions for which death is avoidable by medical intervention or that every death from some of the selected causes would be avoidable but they expected that a proportion could be prevented. Finally, and unlike Charlton et al.20, the EC group
also included conditions whose control mainly depends on policies of primary prevention (health policies) as noted earlier, namely lung cancer, liver cirrhosis, and motor vehicle accidents.27,29These conditions were, however, no longer included in the most recent
edition.31
Work on the EC Atlas of ‘Avoidable Death’ has stimulated a number of country-specific analyses by participating research groups in Europe, such as in Belgium32, France33, The
Netherlands34, Ireland35and Scotland36and beyond in Sweden37, Spain38, the former
German Democratic Republic39,40,Greenland41, New Zealand42, Canada43, the USA44 and
Singapore.45 The list of causes of death considered avoidable has, however, varied between
studies with even those originating from the work on the EC Atlas using a more or less modified selection of amenable conditions and varying age ranges. For example, in their case study in France, Jougla et al., based on the work by the EC, extended this list to include cancer of the oral cavity, nephritis and a larger list of infectious diseases. They also extended the age range of infectious diseases to cover ages 5-64.33
In an early review of work on avoidable mortality, looking at 11 papers that had been published until the late 1980s, Mackenbach and co-workers noted that this variation in what is included is likely to reflect different views on the avoidability of death from certain conditions as well as the availability of mortality data and variation in the frequency of death of certain conditions in certain countries.13Thus some authors include conditions
that are considered particularly relevant in the respective study region, for example meningitis and diabetes mellitus in New Zealand46while others explicitly exclude certain
conditions because of their low frequency as for example with hypertension and asthma in Greenland.41Adopting Rutstein’s broad definition of medical care15this last study did,
however, include causes such as boat injuries, suicide and alcohol-related injuries as they were considered important causes of death in Greenland. This example illustrates the point made earlier on the variation in opinions as to whether a particular condition is to be classified as avoidable or not. However, the reasons used are often not made explicit as noted by Mackenbach et al.13who reported that a sound discussion of reasons for the
inclusion or exclusion of specific causes of ‘avoidable’ death is almost always lacking. In an attempt to quantify more specifically the contribution of medical care to changing mortality in The Netherlands, Mackenbach and colleagues linked trends in mortality to specific innovations in medical care.47Based on Rutstein’s list15 they selected a range of
conditions that were considered to reflect all medical care innovations for which the positive impact on disease incidence or case fatality was relatively undisputed (Table 4). In contrast to Rutstein, however, they used a more restricted definition of medical care as “the application of biomedical knowledge through a personal service system”, adapted from McDermott.48As with Charlton et al.20their list thus excluded conditions for which
Cause of death47 ICD 9* Medical care Innovation Diseases of the thyroid 240-246 Specific medical therapies, e.g.
Diabetes mellitus 250 introduction of insulin [1922]
Pernicious anaemia 281.0
Other anaemia Remainder of 281
Peptic ulcer 531-534 Improvements in surgery/anaesthetics,
Appendicitis 540-543 e.g. introduction of intravenous fluid Cholelithiasis & cholecystitis 574-575.1, 576.1 therapy [around 1930]
Abdominal hernia 550-553
Ileus without hernia 560
Benign prostatic hyperplasia 600 (222.2)
Maternal causes (630-676) Improvements in antenatal and perinatal Complications mainly related to pregnancy 640-648 care [since ca. 1930]
Complications occurring mainly 660-669 in the course of labour and delivery
Complications of the puerperium 670-676 Perinatal causes
Diseases of the mother 760
Birth injury 761-763, 767
Haemolytic disease 773
Other Remainder of
760-779
Tuberculosis 010-018, 137 Chemotherapeutics, e.g. sulphonamides Pneumonia/influenza 480-487 [1936], and antibiotics, e.g. penicillin
Septicaemia 038 [1947]
Infections of the urinary system Other infectious diseases
Congenital digestive anomalies (749), 750, 751 Surgical repair of congenital anomalies Congenital cardiovascular anomalies 745-747 [since ca. 1950]
Rheumatic heart disease 393-398 Prophylaxis [since ca. 1950]; heart valve surgery [ca. 1965]
Diphtheria/whooping cough/ 032, 033, Mass immunisation [since 1953]
tetanus/poliomyelitis 037, 045
Nephritis and nephrosis 580-589 Haemodialysis [since ca. 1960] Hypertensive disease 401-405 Hypertension detection and treatment Cerebrovascular disease 430-438 [since ca. 1960]
Cancer of lip 140 Improvements in cancer treatment,
Cancer of skin 173 esp. combination chemotherapy
Cancer of kidney 189 [since ca. 1970]
Hodgkin’s disease 201
Cancer of testis 186
Leukaemia 204-208
Cancer of cervix uteri 180 Mass screening [since 1976]
Table 4 Amenable causes of death: Mackenbach et al.
system, including many forms of primary prevention. However mass immunisation and screening were considered integral part of the medical care system. In addition, whilst many studies of avoidable mortality published thus far had analysed data within only a designated age range, Mackenbach et al. could not identify clear evidence as to whether effects of
T H E C O N C E P T O F ‘ A V O I D A B L E ’ M O R T A L I T Y — A L I T E R A T U R E R E V I E W
medical care were limited to certain age groups only and thus did not apply age limits. The only exceptions were diabetes mellitus (<25 years) because improved survival had been shown to be limited to young ages only, as well as renal cancer (<15 years) and leukaemia (<15 years) because these diseases involve different pathological process in children and in adults, with markedly different responses to treatment.
In a recent update of their work Mackenbach extended their original list of amenable conditions to account for advances in medical care, with substantial innovations in, for example, treatment of ischaemic heart disease, such as thrombolytic therapy, as well as rectal cancer and hip fracture.49
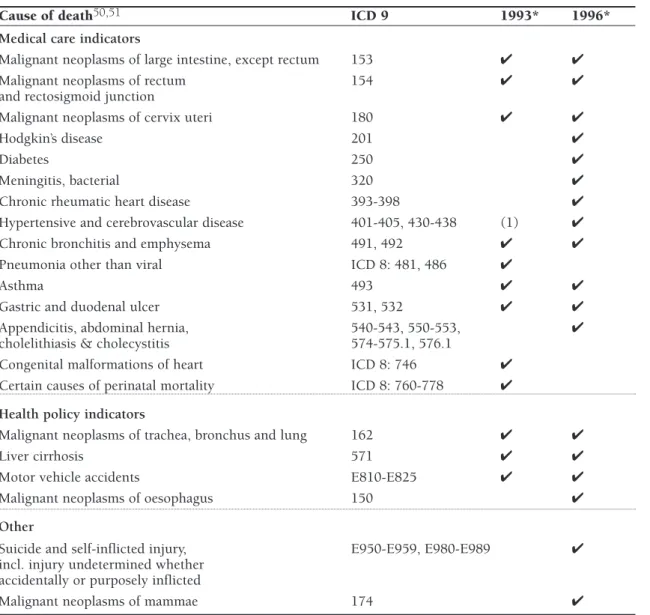
More recent work on avoidable mortality has increasingly focused on differentiating more clearly between causes that are amenable to medical intervention, through secondary prevention and treatment (‘treatable’ conditions) and those amenable to interventions that
Cause of death50,51 ICD 9 1993* 1996*
Medical care indicators
Malignant neoplasms of large intestine, except rectum 153 ✔ ✔
Malignant neoplasms of rectum 154 ✔ ✔
and rectosigmoid junction
Malignant neoplasms of cervix uteri 180 ✔ ✔
Hodgkin’s disease 201 ✔
Diabetes 250 ✔
Meningitis, bacterial 320 ✔
Chronic rheumatic heart disease 393-398 ✔
Hypertensive and cerebrovascular disease 401-405, 430-438 (1) ✔
Chronic bronchitis and emphysema 491, 492 ✔ ✔
Pneumonia other than viral ICD 8: 481, 486 ✔
Asthma 493 ✔ ✔
Gastric and duodenal ulcer 531, 532 ✔ ✔
Appendicitis, abdominal hernia, 540-543, 550-553, ✔
cholelithiasis & cholecystitis 574-575.1, 576.1
Congenital malformations of heart ICD 8: 746 ✔
Certain causes of perinatal mortality ICD 8: 760-778 ✔
Health policy indicators
Malignant neoplasms of trachea, bronchus and lung 162 ✔ ✔
Liver cirrhosis 571 ✔ ✔
Motor vehicle accidents E810-E825 ✔ ✔
Malignant neoplasms of oesophagus 150 ✔
Other
Suicide and self-inflicted injury, E950-E959, E980-E989 ✔ incl. injury undetermined whether
accidentally or purposely inflicted
Malignant neoplasms of mammae 174 ✔
Table 5 Amenable causes of death: Westerling
are usually outside the direct control of the health services, through healthy public policies (‘preventable’ conditions). This distinction was made by both Rutstein and colleagues15and
the EC working group on avoidable deaths.27However Westerling was the first to explicitly
compare ‘treatable’ conditions and ‘preventable’ conditions and to apply this approach empirically and systematically to data from Sweden, using various selections of causes of death, based on the work of both Rutstein and the EC group (Table 5).14,50,51
T H E C O N C E P T O F ‘ A V O I D A B L E ’ M O R T A L I T Y — A L I T E R A T U R E R E V I E W
Cause of death57 ICD 9 Age group
Medical care indicators
Infectious diseases
Intestinal infections 001-009 0-14
(other than typhoid, diphtheria)
Typhoid, diphtheria, tetanus, septicaemia, 001, 002, 032, 037, 0-74
poliomyelitis, osteomyelitis 038, 045, 730
Whooping cough 033 0-14
Measles 055 1-14
Tuberculosis 010-018, 137 0-74
Malignant neoplasm of skin 173 0-74
Malignant neoplasm of breast 174 0-74
Malignant neoplasm of cervix uteri 180 0-74
Malignant neoplasm of testis 186 0-74
Hodgkin’s disease 201 0-74
Leukaemia 204-208 < 15
Diseases of the thyroid 240-246 0-74
Diabetes mellitus 250 0-49
Rheumatic heart disease 393-398 0-44
Hypertensive disease 401-405 0-74
Cerebrovascular disease 430-438 0-74
All respiratory diseases (excluding pneumonia /influenza) 460-479, 488-519 1-14
Pneumonia/influenza 480-487 0-74
Peptic ulcer 531-533 0-74
Appendicitis 540-543 0-74
Abdominal hernia 550-553 0-74
Cholelithiasis (& cholecystitis) 574-575.1 0-74
Nephritis and nephrosis 580-589 0-74
Benign prostatic hyperplasia 600 0-74
Maternal deaths 630-676 all ages
Perinatal deaths all causes excluding stillbirths 760-779 all ages
Congenital cardiovascular anomalies 745-747 1-14
Ischaemic heart disease* 410-414 0-74
Primary prevention (national health policy) indicators
Malignant neoplasm of trachea, bronchus, and lung 162 0-74
Cirrhosis of liver 571 0-74
Motor vehicle accidents E810-825 all ages
Table 6 Amenable causes of death: Nolte et al.
A similar approach was adopted by Benavides and co-workers to analyse avoidable mortality in Valencia, Spain, using indicators proposed by the EC working group and divided into ‘primary prevention indicators’, i.e. lung cancer, liver cirrhosis, motor vehicle injuries, and ‘secondary prevention indicators’, consisting of the remaining 14 causes (Table 3).52
Using various selections of conditions, mostly based on the EC list of avoidable deaths, this approach was subsequently adopted in studies of avoidable mortality in Lithuania53,
Valencia, Spain54,Belgium55, Korea56and, with some modification that also took account of
Mackenbach’s work47, in Germany and Poland (Table 6).57
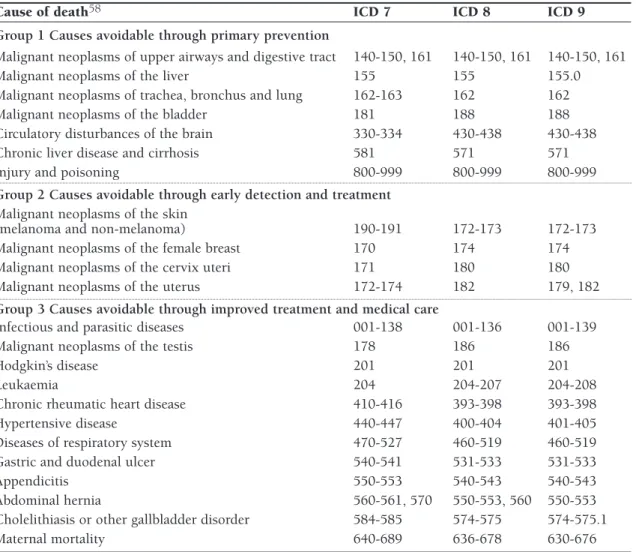
A slightly different approach was chosen by Simonato et al. who undertook a further differentiation of ‘avoidable’ causes into (1) those amenable to primary prevention, i.e. health and wider societal policies, (2) those amenable to early detection and treatment and (3) those amenable to improved treatment and medical care (Table 7).58These groups were
defined as:
1. Causes avoidable through primary prevention,i.e. by reducing the incidence of the disease. This category includes causes whose aetiology is in part attributable to lifestyle factors (such as alcohol and/or tobacco consumption) and/or to occupational risk factors. It also includes deaths from injury and poisoning, which are influenced in part by legal and societal measures such as traffic safety and crime reduction policies.
2. Causes amenable to secondary prevention through early detection and treatment.This group includes causes of death for which “screening modalities have been established” such as cancer of breast and cervix, as well as causes for which death is avoidable through early detection combined with adequate treatment, such as skin cancer.
3. Causes amenable to improved treatment and medical care.This group includes infectious diseases, deaths from which are ‘avoidable’ largely through antibiotic treatment and
immunisation as well as causes that require medical and/or surgical intervention such as hypertension, appendicitis, deaths of which are related to “complex interactions within the health care system, such as accurate diagnosis, transport to hospital, adequate medical and surgical care.”
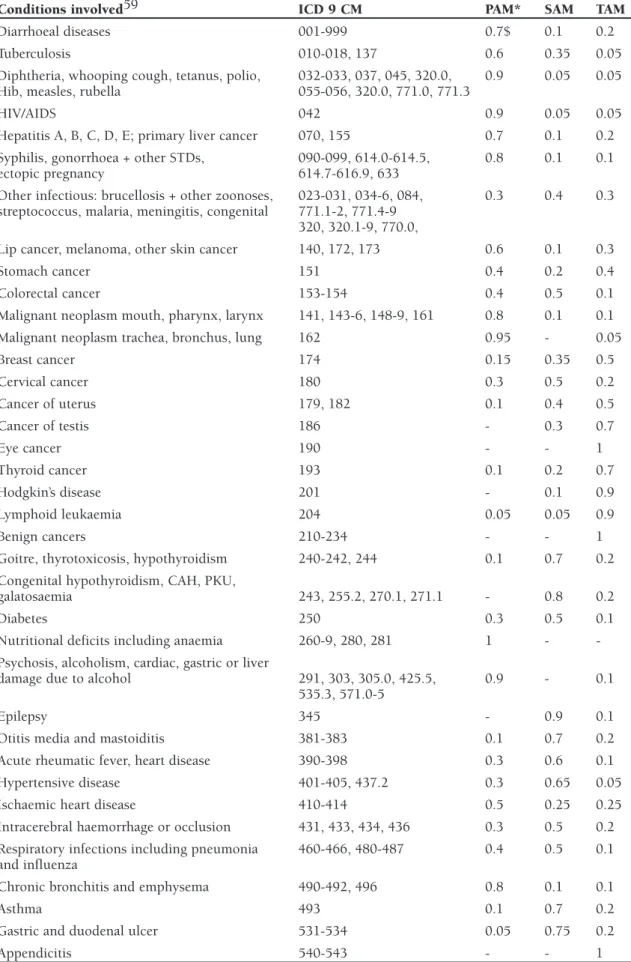
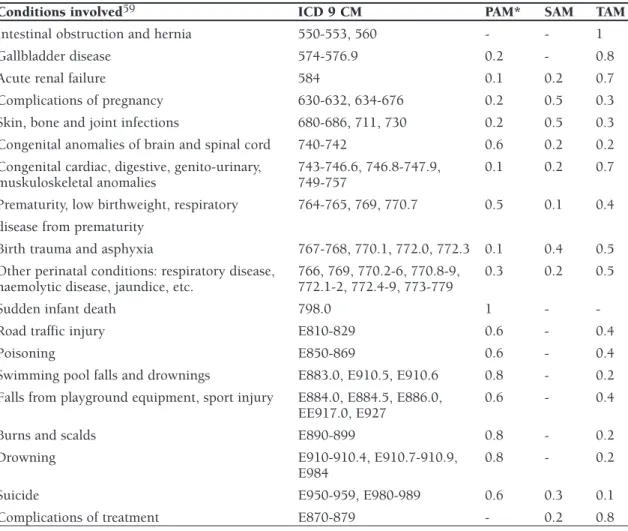
Tobias and Jackson refined this approach further by not classifying each condition as entirely ‘avoidable’ by either primary or secondary or tertiary prevention but by partitioning causes among these three categories, using an ‘expert consensus’ method.59Thus each
condition considered ‘avoidable’ was assigned relative weights reflecting the scale of its potential preventability within each category. For example, the relative proportions of preventability by measures of primary, secondary or tertiary prevention assigned to hypertensive disease were determined to be 0.3, 0.65 and 0.05, respectively. According to this definition hypertension is thus considered to be largely amenable to secondary prevention measures. Tobias and Jackson also substantially broadened the number of conditions potentially ‘avoidable’ by reviewing the literature in the light of advances in health care since the early 1980s. Their final list thus included 56 conditions or groups of conditions, 24 of which were considered largely being ‘avoidable’ by primary prevention (preventing condition to develop), 16 mainly by secondary prevention (early detection and intervention intended to delay progression of disease or recurrence of events) and 16 mainly
T H E C O N C E P T O F ‘ A V O I D A B L E ’ M O R T A L I T Y — A L I T E R A T U R E R E V I E W
Cause of death58 ICD 7 ICD 8 ICD 9
Group 1 Causes avoidable through primary prevention
Malignant neoplasms of upper airways and digestive tract 140-150, 161 140-150, 161 140-150, 161
Malignant neoplasms of the liver 155 155 155.0
Malignant neoplasms of trachea, bronchus and lung 162-163 162 162
Malignant neoplasms of the bladder 181 188 188
Circulatory disturbances of the brain 330-334 430-438 430-438
Chronic liver disease and cirrhosis 581 571 571
Injury and poisoning 800-999 800-999 800-999
Group 2 Causes avoidable through early detection and treatment
Malignant neoplasms of the skin
(melanoma and non-melanoma) 190-191 172-173 172-173
Malignant neoplasms of the female breast 170 174 174
Malignant neoplasms of the cervix uteri 171 180 180
Malignant neoplasms of the uterus 172-174 182 179, 182
Group 3 Causes avoidable through improved treatment and medical care
Infectious and parasitic diseases 001-138 001-136 001-139
Malignant neoplasms of the testis 178 186 186
Hodgkin’s disease 201 201 201
Leukaemia 204 204-207 204-208
Chronic rheumatic heart disease 410-416 393-398 393-398
Hypertensive disease 440-447 400-404 401-405
Diseases of respiratory system 470-527 460-519 460-519
Gastric and duodenal ulcer 540-541 531-533 531-533
Appendicitis 550-553 540-543 540-543
Abdominal hernia 560-561, 570 550-553, 560 550-553
Cholelithiasis or other gallbladder disorder 584-585 574-575 574-575.1
Maternal mortality 640-689 636-678 630-676
Table 7 Amenable causes of death: Simonato et al.
by tertiary prevention (reducing case-fatality by medical or surgical treatment) (Table 8). They also increased the age limit from 65 to 75 to reflect improvements in life expectancy as well as improved cause of death coding for the elderly.
However, in contrast to the ‘traditional’ concept of avoidable mortality the broader conception used by Tobias and Jackson was intended mainly to “measure the theoretical scope for further population health gain, not what may be considered feasible given current technology, available resources and competing values.” Thus the usefulness of this more comprehensive indicator as a measure of the quality of contemporary health care is somewhat limited.
Conditions involved59 ICD 9 CM PAM* SAM TAM
Diarrhoeal diseases 001-999 0.7$ 0.1 0.2
Tuberculosis 010-018, 137 0.6 0.35 0.05
Diphtheria, whooping cough, tetanus, polio, 032-033, 037, 045, 320.0, 0.9 0.05 0.05 Hib, measles, rubella 055-056, 320.0, 771.0, 771.3
HIV/AIDS 042 0.9 0.05 0.05
Hepatitis A, B, C, D, E; primary liver cancer 070, 155 0.7 0.1 0.2 Syphilis, gonorrhoea + other STDs, 090-099, 614.0-614.5, 0.8 0.1 0.1
ectopic pregnancy 614.7-616.9, 633
Other infectious: brucellosis + other zoonoses, 023-031, 034-6, 084, 0.3 0.4 0.3 streptococcus, malaria, meningitis, congenital 771.1-2, 771.4-9
320, 320.1-9, 770.0,
Lip cancer, melanoma, other skin cancer 140, 172, 173 0.6 0.1 0.3
Stomach cancer 151 0.4 0.2 0.4
Colorectal cancer 153-154 0.4 0.5 0.1
Malignant neoplasm mouth, pharynx, larynx 141, 143-6, 148-9, 161 0.8 0.1 0.1
Malignant neoplasm trachea, bronchus, lung 162 0.95 - 0.05
Breast cancer 174 0.15 0.35 0.5 Cervical cancer 180 0.3 0.5 0.2 Cancer of uterus 179, 182 0.1 0.4 0.5 Cancer of testis 186 - 0.3 0.7 Eye cancer 190 - - 1 Thyroid cancer 193 0.1 0.2 0.7 Hodgkin’s disease 201 - 0.1 0.9 Lymphoid leukaemia 204 0.05 0.05 0.9 Benign cancers 210-234 - - 1
Goitre, thyrotoxicosis, hypothyroidism 240-242, 244 0.1 0.7 0.2 Congenital hypothyroidism, CAH, PKU,
galatosaemia 243, 255.2, 270.1, 271.1 - 0.8 0.2
Diabetes 250 0.3 0.5 0.1
Nutritional deficits including anaemia 260-9, 280, 281 1 - -Psychosis, alcoholism, cardiac, gastric or liver
damage due to alcohol 291, 303, 305.0, 425.5, 0.9 - 0.1
535.3, 571.0-5
Epilepsy 345 - 0.9 0.1
Otitis media and mastoiditis 381-383 0.1 0.7 0.2
Acute rheumatic fever, heart disease 390-398 0.3 0.6 0.1
Hypertensive disease 401-405, 437.2 0.3 0.65 0.05
Ischaemic heart disease 410-414 0.5 0.25 0.25
Intracerebral haemorrhage or occlusion 431, 433, 434, 436 0.3 0.5 0.2 Respiratory infections including pneumonia 460-466, 480-487 0.4 0.5 0.1 and influenza
Chronic bronchitis and emphysema 490-492, 496 0.8 0.1 0.1
Asthma 493 0.1 0.7 0.2
Gastric and duodenal ulcer 531-534 0.05 0.75 0.2
Appendicitis 540-543 - - 1