Computer Science and Engineering: Theses,
Dissertations, and Student Research Computer Science and Engineering, Department of
Fall 12-2015
Routing Optimization in Interplanetary Networks
Sara El Alaoui
University of Nebraska-Lincoln, [email protected]
Follow this and additional works at:http://digitalcommons.unl.edu/computerscidiss
Part of theComputer Sciences Commons
This Article is brought to you for free and open access by the Computer Science and Engineering, Department of at DigitalCommons@University of Nebraska - Lincoln. It has been accepted for inclusion in Computer Science and Engineering: Theses, Dissertations, and Student Research by an authorized administrator of DigitalCommons@University of Nebraska - Lincoln.
El Alaoui, Sara, "Routing Optimization in Interplanetary Networks" (2015).Computer Science and Engineering: Theses, Dissertations, and Student Research. 94.
by
Sara El Alaoui
A THESIS
Presented to the Faculty of
The Graduate College at the University of Nebraska In Partial Fulfilment of Requirements
For the Degree of Master of Science
Major: Computer Science
Under the Supervision of Professor Byrav Ramamurthy
Lincoln, Nebraska December, 2015
Sara El Alaoui, M.S. University of Nebraska, 2015
Adviser: Byrav Ramamurthy
Interplanetary Internet or Interplanetary Networking (IPN) is envisaged as a space network which interconnects spacecrafts, satellites, rovers and orbiters of different planets and comets for efficient exchange of scientific data such as telemetry and im-ages. IPNs are classified among challenged networks because of the unpredictable changes in the network and the large varying delays in communication. These net-works are hard to model using static graphs and do not behave optimally when operated using the static networks’ standards and techniques. Delay Tolerant Net-working (DTN), in its different implementations, is one of the suggested solutions to overcome these networks’ challenges. DTN has different routing techniques, among which Contact Graph Routing (CGR) is the more widely used in IPNs.
In this thesis, we identify the shortcoming of CGR that results from overlook-ing the future contacts, and we propose the Earliest Arrival Optimal Delivery Ratio (EAODR) Routing that examines all the paths both with the desired earliest depar-ture time and in the fudepar-ture in order to choose the earliest arrival path from a given node. EAODR finds the route that delivers the exchanged message (a. k. a. bundle) at most at the same time as CGR’s route. In order to do that, we propose a Modified Temporal Graph (MTG) model that provides a near-real-time representation of the deterministic dynamic networks. We base EAODR routing algorithm on the MTG model. Our results show that we can reduce the delay by 12.9% compared to CGR when we apply our algorithm to over 50 combinations of bundle sizes and transmission
ACKNOWLEDGMENTS
I would like to express my gratitude and sincere thanks to my advisor Dr. Byrav Ramamurthy for his support and help. His patience and kindness have taught me how to aspire for success while enjoying every step on the path leading to it. His guidance has been essential in the completion of this work.
I would also like to acknowledge Mr. Saichand Palusa (UNL) and Mr. Philip Tsao (NASA Jet Propulsion Lab, in Pasadena California) for their contributions and thank them for the inspirational discussions and their feedback about our work. This work was supported in part by NSF CNS-1345277 and by a research mini-grant from NASA Nebraska EPSCOR.
I want to thank the committee members, Dr. Massimiliano Pierobon and Dr. Qiben Yan, for their time and comments that helped enhance the quality of this work.
I would also like to thank Mr. Adrian Lara for being such a great friend. He has always been there to cheer me up and give me his useless advice. I also thank him for reviewing my thesis and making jokes about the missing vowels in my text.
I extend my thanks to Mr. Naeem Sheikh for him precious help and to all my friends and family; namely, Ms. Salma, Ms. Hind, Ms. Mariana Hernandez, Mr. Ab-dellah Ben Hammou, Ms. Soumaya and Mr. Deepak Nadig. I would like to also thank Red Mango for allowing me to thank (some of) them with a healthy, sweet and fresh treat.
Last but not least, I would like to thank my beloved parents Ms. Saida Boureddaya and Mr. Abdelaziz El Alaoui along with my brother Mr. Yogo, my sister Ms. Migui and my brother-in-law Mr. Zaki without whom I would not have achieved any of this. I am grateful for their love, pride and support that reach me through the transatlantic telecommunication cables. I dedicate this work and my successes to them.
Contents
List of Figures vii
List of Tables viii
1 Introduction 1 1.1 Motivation . . . 2 1.2 Contributions . . . 3 1.3 Outline . . . 4 2 Background 5 2.1 DTN-Based IPN . . . 5 2.2 DTN Routing . . . 7
2.3 Contact Graph Routing . . . 8
2.3.1 CGR Description . . . 8
2.3.2 CGR experimental Assessment . . . 9
2.4 Temporal Graphs . . . 11
3 The Modified Temporal Graph Model 13 3.1 MTG Model Notations . . . 14
4 Earliest Arrival Optimal Delivery Ratio Routing Algorithm 19
4.1 Construct Path-Set . . . 21
4.2 EAODR Algorithm Details . . . 22
4.2.1 The Time Complexity of EAODR . . . 25
4.3 Earliest Arrival Time and Optimal Delivery Proof . . . 26
4.3.1 Path Set Construction . . . 27
4.3.2 EAODR Routing Algorithm . . . 28
5 Algorithm Implementation for Deep Space Network Scenario 31 5.1 Experimental Setup . . . 31
5.1.1 Earth-Mars Deep Space Network Network Topology . . . 31
5.1.2 Network’s Contact Plan and Data Rates . . . 33
5.1.3 CGR Experiment and EAODR Algorithm Implementation . . 35
5.2 EAODR Algorithm Illustration . . . 35
5.3 Experimental Results . . . 38
6 Conclusion and Future Work 42 6.1 Conclusion . . . 42
6.2 Future Work . . . 44
List of Figures
2.1 Interplanetary Network (source: [1] - Modified) . . . 6 2.2 Temporal graph representations . . . 12 3.1 Illustration of the MTG model compared to a conventional temporal graph
model . . . 15 5.1 Earth-Mars experimental network topology (source: [1] - Modified) . . . 32 5.2 Contact plan chart for the Earth-Mars network . . . 35 5.3 The graph layout at different times - 1=Ody, 2=MEX and 3=MRO . . . 37 5.4 Average delivery time comparison between CGR and EAODR for different
bundle sizes . . . 39 5.5 Delivery time difference between CGR and EAODR for 10 random network
topologies and different bundle sizes . . . 40 5.6 CGR delivery time penalty for three bundle sizes in randomly generated
networks . . . 40 5.7 Comparison between the delivery time of CGR and EAODR in a 100-node
List of Tables
2.1 Data transfer by delaying the bundles . . . 11
5.1 Contact plan for all nodes in the network (Source: [2]) . . . 34
5.2 Uplink and downlink data rates in bytes/sec (Source: [2]) . . . 34
Chapter 1
Introduction
In the past few years, the number of space missions has been increasing with more and more different purposes being accomplished by these missions. They range from the typical scientific research space mission to more ambitious and thought-provoking missions aimed at colonizing Mars and establishing multi-planetary communities [3]. Communication plays a significant role in the success of these missions. Spacecrafts, satellites and any other objects propulsed to the outer space have to be equipped with antennas powerful enough to reach out to the surface of Earth and implement routing mechanisms that can deal with the rough communication conditions. That being said, routing, stream control, data delivery and security require protocols that are different than the ones used for Earth’s networks; i.e. mainly TCP/IP. Taking into consideration all the challenges in space environments, Delay Tolerant Networking (DTN) was proposed, among other solutions, to provide efficient store-and-forward communication mechanisms to make the delays and the intermittent connections seamless to the communicating parties.
In this thesis, we study one of the widely used DTN routing algorithms and identify one of its shortcomings. Then we propose the Earliest Arrival Optimal Delivery
Ratio (EAODR) Routing Algorithm, a routing optimization algorithm in DTN-based Interplanetary Networks (IPN) using the temporal graph model, and focus on the Earth-Mars Deep-Space Network (DSN) as a prominent example. We incorporate all the variables of the network (i.e. queuing delay, One Way Light Time (OWLT) and data rate of the links) in the construction of the Earlier Arrival Optimal Delivery Ratio Algorithm that finds the best path to carry a bundle from source to destination taking into consideration the queuing delay, the One Way Light Time and the data rate of each link. It uses the earliest departure route if there is no other choice or it guarantees the earliest arrival time compared to other routes with future contacts (i. e. the time intervals where two nodes are in line of sight). We assume that the bundles will not be fragmented by any node in the network; furthermore, we only take into consideration the queuing delay and the OWLT without using actual values which is beyond the scope of this work.
1.1
Motivation
The Contact Graph Routing (CGR) implementation of the greedy Dijkstra’s algo-rithm, in some cases, does not result in the most optimal delivery ratio. This is due to the fact that it overlooks future contacts that may be better for a bundle. We showed this in the research work in [2] as we will describe in Section 2.3.2, and it was listed by Araniti et al. in their survey on CGR routing in DTN-based deep space networks [4]. To address this problem we propose an algorithm that finds all possible paths and chooses the best option. The EAODR algorithm is based on the Modified Temporal Graph model that we propose as part of this work.
The Modified Temporal Graph model is used to efficiently represent the IPN in a near-real-time precision enabling the EAODR algorithm to find all the possible paths
between source and destination within a time interval equal to the Time-To-Live (TTL) of a bundle. These paths are constructed based on the data rates of each edge and account for the possible transmission delays. The final path to be used is then chosen according the delivery time unlike CGR which chooses the earliest departure route. The detailed description of both the MTG model and EAODR algorithm is presented in Chapters 3 and 4 respectively.
1.2
Contributions
Our work has three main contributions as described below:
• We identify a drawback of using the greedy approach in routing: After testing
CGR, we point out that it overlooks future connections in the network which leads to delays in delivering the bundle to the final destination. This problem was validated in the work published in [2].
• We propose a model to represent an IPN in near-real-time accuracy: Our
Modi-fied Temporal Graph (MTG) model described in Chapter 3 leverages two aspects of related research works, one pertaining to the existing temporal graphs and the other related to the nature of the networks studied in this thesis. That is, we add different structures to accommodate the characteristics of our network be-sides the temporality of the edges, and we use the deterministic dynamic aspect of IPNs to represent the edges according to their cyclic repetitive pattern.
• We propose a new routing algorithm for DTN-based IPNs - the Earliest Arrival
Optimal Delivery Ratio (EAODR): We propose a routing algorithm [5] that uses
the proposed MTG model to overcome the shortcoming of CGR. The major enhancements that we obtain through this algorithm are: (1) it uses the MTG
model as a representation of the Contact Plan that is more efficient than the enumeration of contacts used in CGR, (2) it computes the availability of the connections based on their data rate, the bundles size and also the queuing delay and the OWLT, and finally (3) it constructs multiple paths using all the available future contacts and chooses the route that guarantees the earliest arrival time for the bundle.
Each one of these contributions will be discussed in detail in the subsequent chapters following the outline provided below.
1.3
Outline
This document is organized as follows. Chapter 2 provides the background and in-troduces the DTN-based IPN, Contact Graph Routing and temporal graphs. The proposed model is then described in detail in Chapter 3 which provides the model notation and manipulation algorithms. Chapter 4 provides the details of the EAODR routing algorithm in the first two sections and outlines a correctness proof for this al-gorithm. The implementation of the algorithm is detailed in Chapter 5 by describing the Earth-Mars network topology, contact plan and data rates and by analyzing the results. Chapter 6 presents our conclusions and future works.
Chapter 2
Background
This chapter is composed of four sections each of which provides background informa-tion on the different aspects of this thesis. the first secinforma-tion provides a brief descripinforma-tion of the DTN-based IPNs, and the second section describes DTN routing. The thirds section is about CGR and its drawback and the last section introduces temporal graphs.
2.1
DTN-Based IPN
An Interplanetary Network, a.k.a. Interplanetary Internet, depicted in Fig. 2.1 is a network that insures communication across different planets and comets either lo-cally or in their communication back to the Earth. It is composed of rovers, satellites, orbiters, spacecrafts and Deep Space Stations (DSS) on the surface of Earth transfer-ring scientific data such as images or control commands in rare instances. Unlike the usual communication networks used on the Earth, Interplanetary Networks are set up in a challenged environment containing a great number of objects that hinder the communication, which causes relatively large delays ranging from several minutes to
a few hours, and makes disruptions the norm rather than the exception. In 2002, the
Figure 2.1: Interplanetary Network (source: [1] - Modified)
term Delay Tolerant networking was coined by Kevin Fall who described it in [6] and specified the characteristics of the “challenged Internets” that it was designed for. In 2008, NASA JPL ran the first on-board successful test of DTN by transmitting dozens of images to and from the NASA spacecraft Epoxi [7].
Following this successful test, DTN has gained even more interest and is already used by several operators and researchers for their communications with the space objects both in deep space missions and Low Earth Orbiting (LEO) satellites [8][9]. The store-and-forward mechanism that it implements makes it very convenient for these networks. Evancic et al. have used DTN onboard the UK-DMC satellite as a replacement of the IP as the protocol used to transfer images from LEO satellites to the ground station [10]. They have been able to successfully operate DTN and transfer bundles. Mukherjee et al. [11] have implemented a DTN network on a terrestrial testbed providing an environment for testing and experimentation. This
work was extended by Mukherjee in [12]. She studied bundle transmission delay highlighting the effect of bundle size and number of bundles.
The TCP/ IP protocol stack has been replaced by DTN protocols. Wood et al. have demonstrated in [13] that Multipurpose Internet Mail Extensions (MIME) and The Hypertext Transfer protocol (HTTP) can be used in a DTN network; however, the Bundle Protocol (BP) [14] and the Licklider Transport Protocol (LTP) [15] are more commonly used because they are optimized and designed specifically for DTN. LTP has been approved by the Consultative Committee for Space Data Systems (CCSDS) in May 2015 and published in their Blue book (i.e. recommended protocols) while the BP is undergoing its third review by a member agency. DTN technology is implemented based on the store and forward technique where each node stores the data units, known as bundles, when the link is unavailable and forwards them when the link is restored.
2.2
DTN Routing
DTN was first introduced in 2000 and successfully tested by NASA JPL in 2008. This success is mainly due to the store-and-forward mechanism that enables the nodes to relay the communication even when no immediate outgoing communication link is available. This design pattern was used to mitigate the unavoidable delays and the intermittent connections between network nodes. Many routing algorithms have been proposed for different DTN implementations, and they fall within two main categories. The first type of networks are labeled “opportunistic” networks and refer to networks where routing is done based on minimal knowledge of the network state. The second type is called “deterministic” and assumes good to complete knowledge of the network state when constructing routes. Algorithms in the former category
use heuristics whereas those in the latter category use predefined contact plans. Networks such as the one used in this work are categorized among the “deter-ministic” DTN networks. The reason behind such classification is that the nodes of the network follow predefined orbits, hence their contacts can be predicted ahead of time. This means that full knowledge of the network state can be assumed using the orbital information of the nodes. Nevertheless, it should be mentioned that this contact plan may change after a certain period of time for different reasons such as deliberately changing the position of a satellite according to changes in the mission. The two main routing algorithms that have been proposed for the DTN-based IPNs are the Movement-Aware Routing oVer Interplanetary Networks (MARVIN) [16] and Contact Graph Routing [17]. The main difference between MARVIN and CGR is that the former uses planetary ephemeris data to deduce the communication links, while CGR uses a predefined listing of all the communication windows between nodes in what is called a Contact Plan (CP). The more widely used of the two algorithms is CGR which we describe in more detail in the next section.
2.3
Contact Graph Routing
2.3.1
CGR Description
In the Interplanetary Overlay Network [18] implementation of DTN, which is one of the more widely used, routing is performed using the Bundle Protocol which in turn uses Contact Graph Routing. This routing system is used to deal with the dynamic aspect of the space network. As the nodes are constantly moving following a predetermined path and timing, the contacts changes are easy to track. The CGR algorithm follows Dijkstra’s greedy approach of routing in the sense that it is run
multiple times over the network to find the “earliest best-case delivery time.” This path is also characterized by submitting the bundle at the earliest time in the contact window. CGR is fed the Contact Plan that outlines the start and end contact times between every two adjacent nodes, and it generates a Contact Graph (CG) data structure at every node in the network. It contains the more important information about the links in the network such as start time, end time and transmission rate of the communication link.
This routing system comes with the caveat that the greedy approach does not always generate the best solution. Several researchers have proposed enhancements to the routing mechanism used by the CGR. Bezirgiannidis et al. have proposed a framework to be incorporated with the existing CGR and, as described in their paper [19], it consists of two main components: a mechanism that takes into considera-tion queuing and other disrupconsidera-tions delay (Earliest Transmission Opportunity) and an update protocol that they call Contact Plan Update Protocol (CPUP). As they mention, this is the first proposed work that considers the queuing delay, which af-fects the performance of the network considerably. This framework, however, does not deal with the problems that the greedy approach of finding a path may cause. That is, using the earliest opportunity to transmit the bundle does not lead to the best usage of the network.
2.3.2
CGR experimental Assessment
To assess the performance of CGR in DTN-based IPNs, we use ION to run CGR on the network topology described in Section 5.1.1. The Interplanetary Overlay Network (ION) is a software distribution that was developed by NASA’s JPL in collaboration with researchers at Ohio University and other universities [20], and
that implements Delay Tolerant Networking as described in RFC 4838. We run ION on 8 different Virtual Machines (VMs) set up on the Global Environment for Network Innovations (GENI). GENI is a research infrastructure testbed sponsored by the National Science Foundation [21] which provides resources for networking and distributed systems research. We configure all the VMs with the CP of the network and set each one as a node in the network. Then, we send bundles from MSL to Earth at different times in the 24-hour period.
We set up a realistic network scenario with 8 nodes as described in details in Section 5.1.1 and use a 24-hour realistic CP. For convenience in experiment execution, we run all the experiments by scaling down the duration from 24 hours to 24 minutes. We send a total of 14 bundles with low priority from the Mars Science Laboratory (MSL) rover to the Mission Operations Center (MOC) for the duration of 24 minutes, we send a bundle every two minutes, with the first bundle sent at the 0th minute and the 12th bundle sent in 22nd minute. In addition, we send two bundles with higher priority at 6:10 min and 16:10 min respectively. A default TTL of 5 minutes is set for every bundle with a size of approximately 10Mb.
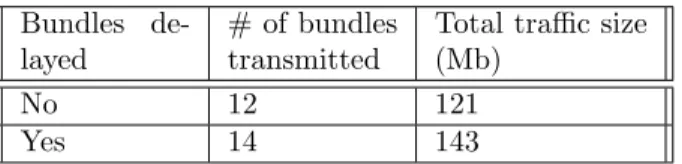
In the first experiment, out of the 14 bundles, bundles 5 and 6 are silently discarded by the contact graph routing (CGR). This resulted from the fact that the CGR predicted that these bundles could not be transmitted because there was no future contact before the expiry of their TTL. Then we modify this experiment by delaying and queuing the bundles 5 and 6 at minute 12 instead of minutes 8 and 10 respectively. With this setup, the CGR decides that these bundles can be transmitted because they have a future MSL-MRO contact at minute 16:30. Hence, the experiment resulted in the successful transmission of bundles 5 and 6 enhancing the performance as shown in Table 2.1. This shows that the greedy way of transmitting bundles as soon as they are ready, does not always result in the best performance.
Table 2.1: Data transfer by delaying the bundles Bundles
de-layed
# of bundles transmitted
Total traffic size (Mb)
No 12 121
Yes 14 143
This assessment of CGR, published in [2], raises the need for an algorithm that considers not only the earliest available contact for transmission, but also future contacts that may result in better performance. Our proposed algorithm is designed to solve these problems using a Modified Temporal Graph model.
2.4
Temporal Graphs
DTN constitutes an example of networks that are hard to represent using static graphs because they are not capable of representing changes in the network topology as its edges are intermittently established. The alternative is to use temporal graphs. A temporal graph [22], also called time-varying graph or dynamic graph, is a graph that captures changes in the network topology in every time instance by adding time as another dimension of the graph definition.
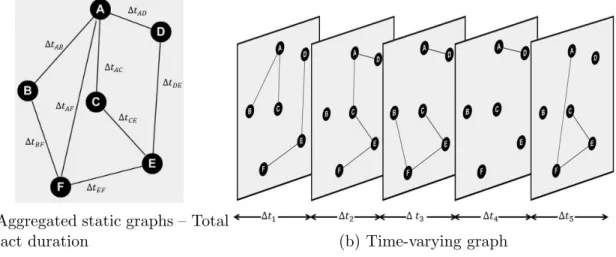
Earlier, researchers used aggregated static graphs [23] in which the changes over time between two adjacent nodes are aggregated into a single edge between them. Therefore, the edge is, for example, labeled either by the number of contacts between the nodes or the total duration of all the contacts. This representation, depicted in Fig. 2.2a, is not powerful in that it does not provide enough details about the nature of changes in the network and hence might lead to confusions as shown by J. Tang et al. in [24] and [25]. Time-varying graphs, hence, overcame the limitations of the time-aggregated graphs by representing the network as a sequence of subgraphs each of which captures the state of the network in a specific time span. This graph
structure is better suited for our work because it allows to operate a network with near-real-time precision.
(a) Aggregated static graphs – Total
contact duration (b) Time-varying graph
Figure 2.2: Temporal graph representations
Having said that, we derive our Modified Temporal Graph model from this rep-resentation by adding changes that pertain to the DTN-based IPNs. In a usual representation of the temporal graphs, an edge has a source node, a destination node, a start time and a duration; however, we need to store more characteristics of the contacts. We define a new structure for the edges since they occur following a cyclic pattern, and we add structures that support the proposed algorithm such as the set of all outgoing edges of nodes. The proposed MTG model is described in detail in the next Chapter.
Chapter 3
The Modified Temporal Graph
Model
A temporal graph is known by its set of graphs that comprise the same nodes but different edges depending on their availability at a particular time. Therefore if the graph change in a cyclic fashion, it is relatively easy to the represent it. The set of graphs will be limited to a specific number depending on the time period during which it changes. For example, if the network has a cycle of one one with hourly changes, then the set will be composed of at most 24 graphs that will be reused during the lifetime of the network. This chapter is composed of two sections. Section 3.1 provides a description of our Modified Temporal Graph model outlining different components along with their notations. In Section 3.2, we propose an algorithm that is used to reconstruct the network topology and manipulate the proposed MTG model.
Temporal graphs are intuitively represented as an ascending time-ordered set of subgraphs. This ordered sequence can be written as {G1, G2, ..., GM} where M is
the number of time spans through which the graph changes consecutively and that are not overlapping [26]. These time spans are written as {[t1, t1 + ∆t1],[t2, t2 +
∆t2], ...,[tM, tM + ∆tM]}. Querying these graphs and storing them might be time
and space consuming especially if the network contains a large number of nodes with interactions that change at a high frequency. There are several representations of temporal graphs [27][28] most of which leverage compression techniques over tree structures. The representation provided in the next section overcomes this problem by representing the graph as a set of edges each of which may belong to one or more of these subgraphs limiting the querying time and space complexity.
3.1
MTG Model Notations
As mentioned in Section 2.4, the temporal graph is a set of sub-graphs that share the same set of vertices V yet different sets of temporal edges that are valid for a specific period of time ∆t. It is not uncommon that a temporal edge spans two or more consecutive subgraphs. In addition to this, each pair of vertices has its own set of temporal edges that in general do not have similar time spans (i.e. start time and validity duration ∆t) as all the temporal edges associated with the other pairs of vertices of the network. These two characteristics of the temporal graphs, among others, make their representation memory consuming and harder to manage and use. In such a representation, the same edge will be part of different subgraphs creating redundancy. To overcome this problem, we propose a Modified Temporal Graph model that defines the graph as a set of vertices and a set of temporal edges. This representation is described as follows.
Let GN = (V, E) denote a temporal graph. E(GN) is defined as:
E ={e(vi, vj, tsk, ∆tk)| ∀vi, vj ∈V(GN), i6=j, k >0}
Each of these edges is established at time tsk written in format HH:MM relative to a
I: [0, 4) II: [4, 9) III: [9, 11) I: [11, 17) II: [17, 19) III: [19, 24)
(a) A conventional temporal graph representation of the network
(1)ts= 0, ∆t = 4h (2)ts = 11, ∆t= 6h (1) ts = 4, ∆t= 5h (2)ts= 17, ∆t= 2h (1)ts= 9, ∆t= 2h (2) ts = 19, ∆t = 5h
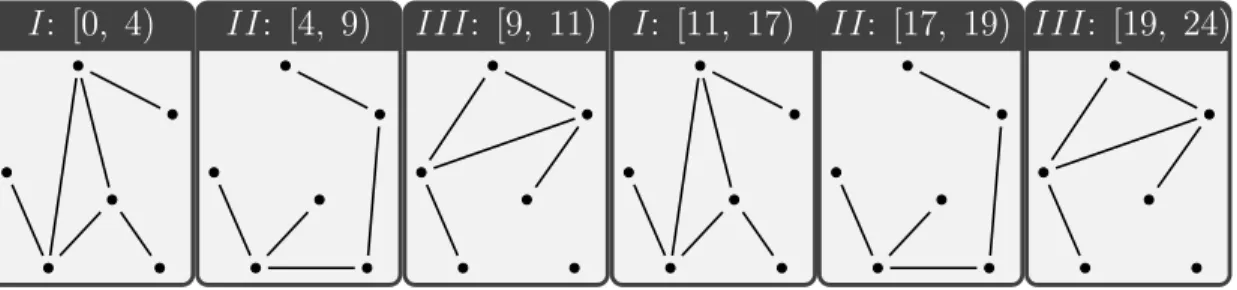
(b) The Modified Temporal Graph model of the network withτ = 24hours
Figure 3.1: Illustration of the MTG model compared to a conventional temporal graph model
and for each pair of nodes, there can be one or more edges that start at different times and have different durations. Furthermore, since all the nodes in an IPN follow an orbit, their interactions are characterized by a cyclic pattern. We define ξ(vi,vj)
as the ordered triple (r, τ, Π(vi, vj)); r is the data rate of the link, τ is the cycle
length of the communication pattern from vi to vj in minutes and Π(vi, vj) is the
set of the temporal edges between vi and vj as defined in [29]. The elements of the
set Π are ordered by increasing ts. In addition, we use Γ(GN) to symbolize the set
{ξ(vi,vj) | ∀vi, vj ∈V(GN), i6=j}.
To illustrate the difference between a conventional temporal graph model described in the introduction of this chapter and our Modified Temporal Graph model, we use the network composed of 6 nodes as depicted in Figure 3.1. The network used for this example has a one day cycle, and within one day, there are three subgraphs layouts
that appear twice in one day. That is, the three leftmost subgraphs in Figure 3.1a appear again in the last 13 hours of the day. The minimum number of subgraphs that should be used the temporal graph using a conventional model is 6 as shown in Figure 3.1a because each layout is established for a different duration in different times of the day. However, when we use our MTG model, we reduce the number of subgraphs to only three and encapsulate the information about the time in the edges. Figure 3.1b depicts the three subgraphs. For simplicity, we assume that the edges are all established at the same time and change at the same time.
3.2
MTG Model Manipulation Algorithms
With this representation of the network, we need to bridge the gap between our MTG model and the temporal graph’s representation as subgraphs. To do that, we propose the two algorithms delineated in this section. We propose Algorithm 1, which can find the network layout for a time period [t, t+T T L] where TTL depends on the bundle to be transmitted. The loop in line 4 iterates over the temporal edges structureξ(vi,vj)
of each pair of nodes in the network. The algorithm then finds the starting time of the desired period relatively to the cycle of the edges using the assignment in line 5. The next loop in line 6 iterates over the list of temporal edges extracted form ξ structure and checks in line 8 whether any edge is available within the desired period [t, t+T T L].
This algorithm iterates over the set of all the temporal edges and returns the edges that are active at the given time. We define m = max{|Π(vi, vj)| : ∀vi, vj ∈
V(GN), i6=j}. The worst case time complexity of Algorithm 1 is O(m×n2), where
n=|VGN|. We argue, though, that the time complexity will be much less because of
sparse and the connections are not frequent between the edges, hence the algorithm will run optimally for these networks compared to the worst case time complexity. Algorithm 1 Construct Network Layout
1: Input: A temporal graph G = (V, E) in its edge stream representation, time t and the size of the bundleBus
2: Output: The network topology at timet as a set of active edges 3: Initialize Ψ ={} the set of active edges;
4: for all ξ∈Γ(GN) do
5: θ ←t (mod τ(γ))
6: for all e∈Π(γ)where θ ≤ts(e)do
7: Mark e as visited;
8: if ts(e) + (∆t(e)± 12)≤t+T T L then
9: Ψ←Ψ∪ {e} ;
10: break;
11: return Ψ
We then propose Algorithm 2 that finds the next available communication edge between two vertices given a timet, which is assumed to be given in minutes and rel-ative to the reference time t∅. This algorithm considers the temporal edges structure
specific to the desired pair of nodesξ(vi,vj). For every edge in this structure, the loop
in line 6 iterates over the temporal edges and compares the edges start time to the desired start time. There are two cases. Either the start time of the edge is greater than the desired start time as in line 7, or the desired start time is between the start time of the edge and its end timets(e)+(∆t(e)±12). In the first case, the next contact
edge occurs at ts and in the second case the time to the next contact is 0 minutes. If
no contacts are found in this cycle, then line 8 finds the first contact in the cycle and specifies that the next contact happens then.
This algorithm has a worst case time complexity of O(n) withn=|VGN| because
the number of iterations of the loops is equal to the degree of the edge, which equals the |VGN| −1 in the worst case scenario. These two algorithms are important in
represen-tation. This reduces the complexity of the compact edge structure into a graph that is easier to illustrate. In addition to the present algorithms, we propose our main routing algorithm in Chapter 4 along with its complementary algorithm.
Algorithm 2 Next Active Edge
1: Input: A pair of vertices (vi, vj), time t
2: Output: δtN extContact, time remaining before the next available communication
edge 3: Initialize δtN extContact ← ∞; 4: Initialize m←t (mod τ(ξ(vi,vj))) 5: θ←t (mod τ(γ)) 6: for all e∈Π(vi, vj) do 7: if θ ≤ts(e) then 8: δtN extContact ←ts(e)−θ ; 9: break; 10: else if θ ≤ts(e) + (∆t(e)± 12 ) then 11: δtN extContact ←0 ; 12: break; 13: if δtN extContact ==∞ then 14: e∅ ←F irst element of Π(vi, vj) ; 15: δtN extContact ←(τ(e)−θ) +ts(e∅) ; 16: return δtN extContact
Chapter 4
Earliest Arrival Optimal Delivery
Ratio Routing Algorithm
Routing in a temporal graph is very different compared to routing in static graphs. The temporal dimension of the graphs determines the plausibility of a path since it is a critical variable in the graph definition. The usual shortest path problem is, hence, taken to a higher complexity where each path is only valid within a certain time limit. For temporal graphs to use the conventional shortest path algorithms, it has to be reduced to one compact graph that loses all the temporal data. This does not benefit our application of temporal graphs because precision in the contact windows is critical. The proposed algorithm emphasizes the temporal dimension of the graph without neglecting the importance of the other network variables such as data rates, One Way Light Time delay and queuing constraints. We start by designing Algorithm 3 as described in Section 4.1 that finds a set of potential paths starting at an outgoing edge from the source within the TTL of the bundles to be sent. Then, we use this set of paths to run EAODR that finds the earliest arrival path as delineated in Section 4.2.
For our routing algorithms we define a path p as a triplet in terms of its starting time: ts, the total time it takes it to take a bundle from source to destination: T, and
the set of edges in the path: Ep. Also, to extract the value of a variable associated
with a path, edge or any component of the graph, we use a function with the same name of the variable. For example, to refer to the start time of an edge e we use ts(e) and to refer to the total time of a path p we use the function T(p). Since the
edge is defined as a quadruplet that has the source vertex and the destination vertex, we use Src(e) and Dst(e) to refer to the source and destination vertex of the edge e respectively. Furthermore, we refer to the parent of a node n byparent(n) and to the cost function of a node n by time(n) because the cost is the time that is takes the bundle to traverse the edge. The parent function refers to the pair (v, t) where v refers tot he parent node and t refers to the start time ts of the edge since there are
multiple edges that start at v and go to n at different times. We finally denote the list of visited nodes as beenT o and the time at which a node n receives a bundle as tRcv(n).
The proposed algorithm starts by constructing a set of paths each of which has one edge starting at the source, and that is initiated within the TTL of the bundle. We use this set to ensure that all the temporal paths are traversed by EAODR routing algorithm. The next step in finding the earliest arrival path is to start from an edge of these paths and construct the earliest arrival time path for that outgoing edge. EAODR routing algorithm does that by following a Dijkstra’s algorithm like method, but by adding more constraints to the choice of next edge and cost of traversing it. In Section 4.1, we describe the algorithm that constructs the path set and then in Section 4.2, we provide a detailed description of EAODR.
4.1
Construct Path-Set
Algorithm 3 takes as input the temporal graph as well as the source (s) and destination (d) nodes. It also takes as input the intermission starting time (ts) along with the
TTL and total size of the bundle Bus. This algorithm iterates over the list of all the
outgoing edges (e) of the source and find the ones that have the start time ts(e) and
are valid for time Bus
R(e) +ε. The fraction
Bus
R(e) represents the time it takes the bundle
with size Bus to traverse this edge with data rate R(e), and the additional time ε is
the processing time. Once an edge that satisfies these two conditions is found, a path starting at this edge is created and inserted in the set of potential pathsP, which is returned at the termination of the algorithm. The time complexity of this algorithm depends onN, where N =deg(s). We further assume that all these edges satisfy the conditions. Hence the worst case time complexity of the algorithm is O(N). Next, we describe the algorithm that finalizes these paths.
Algorithm 3 Construct Path Set
1: Input: Temporal graph G = (V, E) in its edge stream representation, source s, transmission start time ts,T T L, data total size of the bundleBus
2: Output: The set of paths P from source to destination within time interval [ts, ts+T T L]
3: LetEs be the set of edgese(s, vi, ts, ∆t),∀vi ∈V;
4: Order Es byts;
5: LetP be the set of paths starting at vertexs; 6: δt=ts+T T L ;
7: Foreach e∈Es do
8: if (Overlap(ts(e) + ∆t(e), δt) &&RBu(es)+ε≤δt )then
9: Create new Path: p(ts(e),RBu(es) +ε,{e}) ;
10: P =P ∪ {p} ; 11: return P
4.2
EAODR Algorithm Details
Finding the shortest path in a network is not a new problem, but the adding the time aspect makes different than the classical problem of finding the shortest path in a static graph. Dijkstra’s algorithm has been widely used as an optimal solution for the routing problem; however, it cannot be used as it is for this problem because it does not take into account the temporal aspect of the network. Zhao et al. have proposed in their paper [30] an algorithm that is as time efficient as Dijkstra’s algorithm, but that also takes into account the temporal aspect of the edges as an enhancement of Dijkstra’s algorithm. In addition to the cost function used in the Dijkstra algorithm, they have used a heuristic function that is based on time. Their algorithm, however, is not suitable for our problem because this algorithm overlooks the other aspects of the network such as the TTL constraint and the temporality of the edges themselves. Our method, described in Algorithm 4, borrows two basic ideas from Dijkstra’s algorithm; namely keeping the cost to each vertex in a separate list and each time choosing the next best edge. The proposed algorithm, then adds major changes as to the relaxation of the nodes and to the way the cost is computed. And more importantly, it keeps track of the temporal availability of the edges. It also adds some conditions to enhance the performance of the algorithm as explained underneath. EAODR algorithm starts by finding the set of potential paths P using Algorithm 3; then for each pathpinP, it follows a set of steps to either finalize the path or drop it as follows. For a pathp with starting edgeel, we set the cost of all the vertices other
than s to∞. We also initialize a setEs as all the edges that are available within the
time [ts, ts+T T L].
For all the edges in Es, we find the next edge with least arrival time; i.e. the
Algorithm 4 Earliest Arrival Optimal Delivery Ratio Routing Algorithm
1: Input: Temporal graph G = (V, E) in its edge stream representation, source s, destination d, transmission start time ts, T T L, data total size of the bundleBus
2: Output: The final path pf
3: Call Algorithm 3 with input: G, s, ts, T T L, Bus;
4: Initialize P ← Output of line3;
5: Let the final path bepf(ts, ts+T T L, N U LL);
6: LetEs be the list of edges sorted byts(e)
7: Foreach e∈Es do 8: if !Overlap(ts(e) + ∆t(e), ts+T T L)then 9: remove e fromEs; 10: Foreach p∈P do 11: beenT o ←N U LL 12: time(v)← ∞, ∀v ∈V \ {s} 13: time(s)←ts(p)−ts 14: tRcv(s)←ts(p) 15: while Es 6=∅ do
16: Letel be the min(time(Src(e))), ∀e∈Es;
17: u←Dst(el);
18: LetEl be the set of edgese(u, vi, ts, ∆t), ∀vi ∈V;
19: beenT o←beenT o∪ {u};
20: if u==d then
21: break loop in line 15 and go to line 35; 22: Foreache∈El do
23: vi ←Dst(e);
24: if ts(e)> ts+T T L then
25: break loop in line 22 and go to line 15; 26: if beenT o(vi) ==F alse then
27: tRcv(vi) = max(ts(e), tRcv(u)) + RBu(esi) +ε; 28: time(vi) = tRcv(vi) +time(u); 29: parent(vi) = (u, ts(e)); 30: else if time(vi)> RBu(es i) +time(u) +ε then 31: tRcv(vi) = max(ts(e), tRcv(u)) + RBu(es i) +ε; 32: time(vi) = tRcv(vi) +time(u); 33: parent(vi) = (u, ts(e)); 34: if u==d then 35: T(p)←time(d);
36: Ep ←Ep∪ {parent(d), parent(parent(d))...};
37: if (ts(p)−ts) +T(p)≤(ts(pf)−ts) +T(pf) then
38: pf ←p;
edge el. Similar to Dijkstra’s algorithm, we iterate over these edges to find the next
best choice. However, before we compute the cost of any edge, we first check (line 24) if the edge starts before the bundle expires (i. e. ts+T T L). This is one of the
enhancements for the performance of the algorithm since we cut the number of the edges to be traversed. We then mark the edge as visited by adding it to the beenT o set and update the cost to reach its destination node. As mentioned earlier, the cost is the time it takes the bundle to traverse the edge going from the source u to the destinationDst(e). This time is the sum of three variables: (1) the time to reach the source u, time(u), (2) the time it takes the bundle with sizeBus to travel at a data
rate of r(e), Bus
R(ei) and (3) a constant ε that is set to the queuing time in addition
to the OWLT relative to the edge. Computing these values can be carried out by methods such as the one in [31]. This cost computation is done in lines 26 through 33. This part of the algorithm is also where we change the cost of a vertex if it is not set or is less than the current cost.
The loop in line 15, and described above, is terminated either when the destination node is reached, when the edge set is empty or when the remaining edges are all available beyond the time interval. When one of these conditions is satisfied, the algorithm checks whether the last node was the destination, which means that a path was found. The latter is then constructed by traversing the path backwards using the parent method. Finally, if the path’s arrival time is earlier than the arrival time of the finalpf, it is used as the new final path. The pathpf is initiated to the maximum
acceptable duration which starts at ts and ends at ts+T T L. The total time it takes
a bundle to reach its destination through the pathpis computed as (ts(p)−ts) +T(p)
where the first part of the addition is the total time between the initiation of the bundle and the actual transmission of the bundle. The second part represents the total time to traverse all the edges of the path. The algorithm is terminated after each
path in P is either completed and compared to pf or dropped. When pf is returned,
either its set of edges Ep is empty in which case we conclude that there is no path
for the bundle within its TTL, orEp contains the path that should be used to deliver
the bundle.
4.2.1
The Time Complexity of EAODR
The algorithm is composed of two main parts: the path set construction algorithm and the actual path completion algorithm. In the first algorithm, we iterate over the list of outgoing temporal edges of the source node; therefore, the worst case performance of the algorithm is O(∆(G)). That is, the time complexity of the algorithm depends on the maximum degree of the MTG model of the graph G being used, which, in worst case scenario, equals O(V) assuming a complete graph. In contrast, when we use a contact plan, the actual number of edges that the algorithm would have to consider is the sum of all the outgoing temporal edges and not the maximum degree. Indeed, as the temporal graph captures the temporality of the edge, each degree of a node means one or more temporal edges; for example, in a period of 24 hours, there are approximately 25 temporal edges between MRO and Mars Odyssey while this is considered only one degree of the each node. However, because of the compact representation of our MTG model, the number of edges is reduced to one data structure: the ordered triple (r, τ, Π(vi, vj)).
The remainder of the algorithm is composed of three nested loops. The first loop iterates over all the potential paths in the path set P. The cardinality of this set depends on the number of outgoing temporal edges form the source that we denote by O(∆t(G)). The two numbers ∆t(G) and ∆(G) are equal when the of number
node there is exactly one outgoing temporal edge. However, in time-varying networks, ∆t(G) is much larger than ∆(G). The second loop iterates over all the ordered triples
representing the network, which is equal to |Γ(G)|. This is another optimization that we obtain using the MTG model, since the cardinality of the set Γ(G) is significantly smaller that the number of all temporal edges of the network over a period of time that the algorithm would have to go through if we were using the contact plan. The last loop is very similar to the relaxation section of Dijkstra’s algorithm; hence if a min heap is used, the time complexity to find and update a vertex O(log(V)), where V is the number of vertices.
Finally we conclude that the time complexity of EAODR is O(∆(G) + (∆t(G)×
|Γ(G)| ×log(V))), and that is, in the worst case scenarioO(V + (Et×log(V))) where
Et represents the number of temporal edges. The proof of correctness for the two
algorithms proposed above is shown in the subsequent section. We start by proving the correctness of the path construction algorithm followed by that of the EAODR algorithm.
4.3
Earliest Arrival Time and Optimal Delivery
Proof
In this section, we build the proof of completeness for our proposed routing algorithm. We start by proving the completeness of the path construction algorithm since it represents an important building block in EAODR. We then conclude this section with the proof of completeness of EAODR.
4.3.1
Path Set Construction
We first start by proving that the path set construction algorithm is correct.
For that purpose, we define the following rules in routing a bundle in a temporal graph at time ts and with Time-to Live duration of T T L
1. The bundle cannot be sent if the transmission time ttr is ttr > ts+T T L.
2. The bundle cannot be sent before ts because it is not ready.
3. The bundle can only be sent within the time frame ts, ts+T T L], but does not
have to be sent necessarily atts
It follows that a temporal edge cannot be used if its availability does not overlap with the tine window [ts, ts+T T L].
Lemma 1 The path set constructed by Algorithm 3 does not exclude any valid path.
Proof For some source s, s ∈ V(G) and Es the set of all e’s adjacent nodes, we
suppose:
∃e∈Es such that e /∈
S
p∈P
Ep
Then there are three cases:
1. [ts(e), ts(e) + ∆t] does not overlap with [ts, ts+T T L] and RBu(es)+ε≤ts+T T L:
Edge availability does not overlap with bundle TTL and edge has enough data rate for transmission
In this case, even thought the data rate of the links allows the bundle to traverse the temporal edge while it is still available, the temporal edge is either available before the bundle is ready to be submitted or after the bundle expires.
This edge cannot be used in a valid path based on the previously stated condi-tions.
2. [ts(e), ts(e) + ∆t] overlaps with [ts, ts+T T L] but RBu(es) +ε ≥ ts +T T L: Edge
availability overlaps with bundle TTL but edge does not have enough data rate for transmission
Since the edge is available within the valid time interval, it can be used. How-ever, the date rate is not sufficient to transmit the whole bundle to the source’s first destination before the latter expires.
This edge cannot be used in a valid path based on the previously stated condi-tions.
3. [ts(e), ts(e) + ∆t] does not overlap with [ts, ts+T T L] and RBu(es)+ε≥ts+T T L:
Edge availability does not overlap with bundle TTL and edge does not have enough data rate for transmission
The edge will not be valid because of the two reasons stated in the two previous
cases.
4.3.2
EAODR Routing Algorithm
The proof of correctness of this algorithm is similar to the proof of correctness of Dijkstra’s algorithm; however, since we change the relaxation function and add some constraints on the choice of the edges, we need to proof the correctness of our choices. We also need to prove that the pf if the shortest among all the temporal graphs in
the specified time window.
Lemma 2 The relaxation function for the node n and edge e: time(n) = (ts(e)−
tRcv(parent(n))) +Bus
r(e) +time(parent(n)) +ε used for the algorithm, correctly finds the best temporal edge available for the next hop.
Proof For a transmission that starts at ts:
and destination nodes of edge e.
The cost of the node de is: time(ds) = time(es) +Cost(se, de). The first part is the
time that takes the bundle to reach es, and the second is the time to transmit the
bundle from se tode. This time depends on two components:
1. The earliest transmission time max(ts(e), tRcv(se)): Either se can send the
bundle before the edge is available (i.e. ts(e)≥tRcv(se)) or the edge availability
precedes the reception of the bundle (i.e. ts(e)≤tRcv(se))
2. Edge traversal time + delay: The traversal time depends on the edge data rate
and the bundle’s size (i.e. Bus
r(e)). The delay is beyond the scope of the paper,
but the main sources of delay are (i) the queuing delay at the node and (ii) OWLT of the edge.
From Dijkstra’s Algorithm’s correctness and line 16 in Algorithm 4 the time(es) is
minimal.
It follows that cost difference between two edges depends on (1) their respective data rates plusεand (2) their starting time relatively to when the source node receives the bundle and is ready to send it. Because the algorithm uses both for the relaxation function, the latter is guaranteed to assign the correct cost to the nodes. It results in choosing best temporal edge available for the next hop.
Theorem 1 EAODR routing algorithm finds the earliest arrival path.
Proof Let pEA be the earliest arrival path from a source node nsrc to a destination
node ndst within the time interval [ts, ts+T T L]. And we recall that pf is the path
EAODR algorithm finds path; i.e. pEA ∈P. This also means that:
(ts(pEA)−ts) +T(pEA)≤(ts(p)−ts) +T(p), ∀p∈P, p6=pEA (4.1)
Line 37 in EAODR algorithm 4 is a conditional that comparespf to all paths p∈P;
consequently, EAODR algorithm finds the earliest arrival path; i.e. pf =pEA
To further test our algorithm, we apply it to a realistic network linking a Mission Operations Center on Earth to the the rover Curiosity on the surface of Mars. We design a network topology with three satellites orbiting Mars and three Deep Space Station on the surface of Earth to intercept their signals. We also use realistic contact plans and data rates. Using this set up, we run both CGR and EAODR routing algorithm and compare their performance in terms of bundles’ delivery time. Chapter 5 starts with a description of the network topology, its data rates and contact plans; it then illustrates the EAODR algorithm’s operation. Finally, the chapter ends with a summary of the experimental results.
Chapter 5
Algorithm Implementation for
Deep Space Network Scenario
The validation of EAODR is done through running experiments on a realistic IPN topology. In this chapter, we describe the experimental setup which enumerates the components of the network, specifies its data rates and contact plans and finally describes the specifics of CGR and EAODR testing respectively. The chapter then provides an illustration of the way EAODR routes a bundle as compared to CGR. We end this chapter by presenting the results that obtained from the experiments and that show that EAODR leads to 12.9% less delay on average.
5.1
Experimental Setup
5.1.1
Earth-Mars Deep Space Network Network Topology
We use an IPN layout consisting of 8 nodes that are used to ensure the communication between the Earth and a rover on Mars as depicted in Fig. 5.1. Four nodes are all placed on the surface of Earth: (1) a Mission Operations Center that is in charge of
Figure 5.1: Earth-Mars experimental network topology (source: [1] - Modified)
collecting all data transmitted from Mars for analysis and study and (2) three Deep Space Network stations, referred to as DSS, placed in three different continents to ensure a continuous Earth visibility to Mars orbiters despite the rotation of Earth about the imaginary polar axis. DSS-25 is located in Goldstone, CA-USA, DSS-65 is located in Madrid, Spain, while DSS-34 is located in Canberra, Australia. On the other end, we use three satellites: (1) Mars Reconnaissance Orbiter (MRO), (2) Mars Odyssey (Ody) and (3) Mars Express (MEX). These three orbiters collect data from the rover, Mars Science Laboratory (MSL, also called Curiosity) serving as relay nodes between MSL and earth. The antennas used by the MSL are not very sophisticated because it is more optimized for scientific data collection; therefore, the three orbiters are used as relay nodes transmitting data back to the CC on Earth. Beside the low bandwidth and the huge delay, the line of sight links between the orbiters and MSL can be blocked by Mars itself if the communicating ends are on different sides of the planet. The link between the orbiters and the Earth stations are blocked by the Earth, Mars and other objects that are floating in the space. In order to find the communication windows between every two nodes, NASA’s Navigation and Ancillary
Information Facility (NAIF) has provided the tool called WebGeocalc (WGC) ) [32] [33]. This tool is an information system (SPICE) that outputs the Contact Plans (CP) of planets and spacecarfts provided their navigation and ancillary information usually stored in data files called Kernels.
5.1.2
Network’s Contact Plan and Data Rates
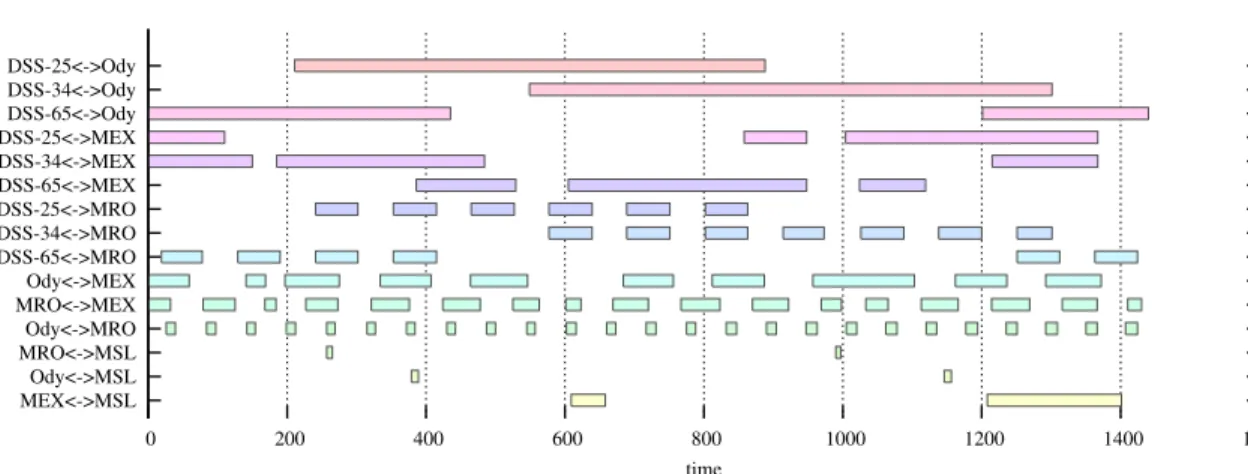
As mentioned earlier, WGC was used to generate the contact Plan of the each of the nodes with regards to the other adjacent nodes in the network for 24 hours starting in 2014-03-25T00:00:00 and ending in 2014-03-26T00:00:00. Table 5.1 is a compact representation of all the contact windows and their duration between the adjacent nodes. For example, there are 7 communication windows between MRO and Mars Odyssey for a total duration of 61788 minutes. A real-life scenario such as this one does not allow for the cross link communication between Mars orbiters; nevertheless, it has been shown in [2] that the network utilization is much higher when intersatellite links are enabled. We also use realistic data rates for each link as specified in Table 5.2. The detailed CP of the network is depicted in the chart in Fig. 5.2. This chart shows the different time windows where the links are available between every two nodes that need to communicate in the network. For example, Mars Odyssey and the MRO have 25 contact windows distributed almost evenly on the 24-hour period of time and lasting for a few minutes each. It does not show the connection between the DSS stations and the CC because we assume connection exists all the time. The four vertical black empty bars show the time spans where a full path from MSL to the Earth is available. Even though there are only four of them, two via the MRO and the two others via Mars Odyssey, the bundles (i.e. DTN data units) have more chances to be transmitted thanks to DTN’s store-and-forward mechanism. It then
Table 5.1: Contact plan for all nodes in the network (Source: [2]) Node1 Node2 # of Con-tact Win-dows Total dura-tion (min) MSL MRO Mars Odyssey Mars Express 2 2 2 11381 13939 18789
MRO Mars Express
Mars Odyssey 17 25 112560 165047 Mars
Odyssey Mars Express 10 62137
DSS25 MRO Mars Odyssey Mars Express 6 1 3 31855 8676 22412 DSS34 MRO Mars Odyssey Mars Express 7 1 3 61788 12468 18634 DSS65 MRO Mars Odyssey Mars Express 6 2 3 33890 17563 23969 CC DSS[25, 34, 65] All the
time All the time
Table 5.2: Uplink and downlink data rates in bytes/sec (Source: [2])
Node1 Node2 Uplink data rate Downlink data rate MSL all satellites 32000 32000 [34]
MRO all DSN
sta-tion 250 500000 [35] Mars Odyssey all DSN sta-tion 15.63 13830 [36] Mars Express all DSN sta-tion 250 28750[37] Any satl-lite Any other satellite 128000 128000[34] Mission Operations Center all DSN sta-tion 1000000 1000000 [as-sumed]
depends on the TTL of the bundles and the connectivity of the relay nodes in the absence of links directly to the MSL.
35 MEX<->MSL Ody<->MSL MRO<->MSL Ody<->MRO MRO<->MEX Ody<->MEX DSS-65<->MRO DSS-34<->MRO DSS-25<->MRO DSS-65<->MEX DSS-34<->MEX DSS-25<->MEX DSS-65<->Ody DSS-34<->Ody DSS-25<->Ody 0 200 400 600 800 1000 1200 1400 1600 time 5 6 7 8 9 10 11 12 13 14 15 16 17 18 19 20 21 22 23 24 25
Figure 5.2: Contact plan chart for the Earth-Mars network
5.1.3
CGR Experiment and EAODR Algorithm
Implementation
In order to compare the performance of the two methods, we implement a simulator and run the experiments that use CGR and EAODR to route bundles at similar trans-mission times in the same newtwork topology. An illustration of how this program works is provided in the subsequent section, and the results are discussed in Section 5.3.
5.2
EAODR Algorithm Illustration
We use the network described in Section 5.1.1 to illustrate the proposed algorithm and use a simple Contact Plan to reduce the complexity of the MTG model and illustration. For simplicity, we will represent the graph edges by omitting the cyclic pattern of the edges, a special case where τ =∞. We use 24-hour clock time repre-sentation and provide ∆t of each edge in minutes. We also combine all the nodes on earth in one without losing accuracy since all the DSN stations play the same role. We then define the temporal graph G:
V ={M SL, M RO, Ody, M EX, Earth}
E ={(M SL, Ody,10: 32, 90), (M SL, M EX,9: 04, 120),
(M SL, Ody,17: 30, 90), (Ody, Earth,11: 15, 330),
(M EX, M RO,12: 32, 90), (M RO, Ody,12: 00, 50),
(M RO, Earth,12: 24, 267)} Initialize Π(u, v)
Π(M SL, Ody) ={(M SL, Ody,10: 32,90), (M SL, Ody,17: 30,90)}
Π(M SL, M EX) ={(M SL, M EX,9: 04,120)}
...
Initialize ξ(u,v)
ξ(M SL,Ody) = (32KB/s,∞, Π(M SL, Ody)) ξ(M SL,M EX) = (32KB/s,∞, Π(M SL, M EX))
ξ(M EX,M RO) = (128KB/s,∞, Π(M EX, M RO)) ξ(M RO,Ody) = (128KB/s,∞, Π(M RO, Ody)) ξ(Ody,Earth)= (13.83KB/s,∞, Π(Ody, Earth)) ξ(M RO,Earth)= (500KB/s,∞, Π(M RO, Earth))
Γ(GN) ={ξ(M SL,Ody), ξ(M SL,M EX), ξ(M EX,M RO), ξ(M RO,Ody), ξ(Ody,Earth), ξ(M RO,Earth)} G= (V, E)
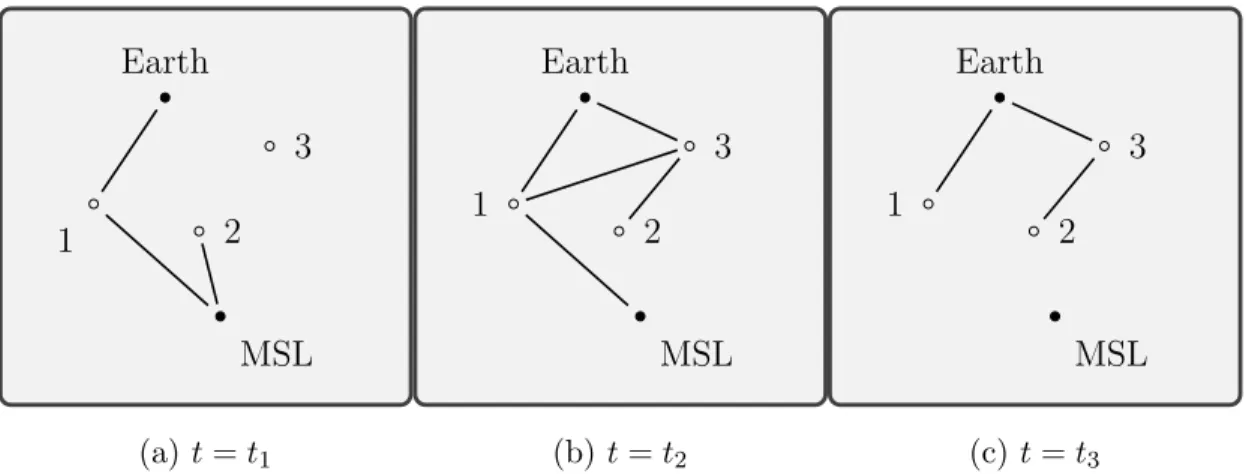
The temporal graph described above is depicted in Fig. 5.3. The left most graph in Fig. 5.3a shows the network in the time window [9: 04, 11: 29], Fig. 5.3b shows the layout of the same network in [11: 30, 13: 59] and the right most figure, Fig. 5.3c, depicts the layout in the time interval [14: 00, 16: 29]. Since the time intervals chosen for this example are relatively large, the number of subgraphs constructed is low and does not represent all the changes of the network. We also point out that these are not the only graph layouts that the algorithm will consider. For the illustration, we assume that M SL wants to send a bundle to the Mission Op-erations Center on the surface of Earth. The bundle is ready for transmission at
Earth 1 MSL 2 3 (a)t=t1 Earth 1 3 MSL 2 (b)t=t2 Earth 1 3 MSL 2 (c) t=t3
Figure 5.3: The graph layout at different times - 1=Ody, 2=MEX and 3=MRO Table 5.3: Path search steps
Step Node(n) time(n) parent(n) tRcv(n) Next Cheapest
0 MSL 0 null 8:00 Ody
1 Ody 237 MSL 11:57 –
2 Earth 434 Ody 15:14 –
3 MRO 261 Ody 12:21 MRO
4 Earth 270 MRO 12:30 Earth
5 Earth – – – [Destination]
8:00, and its TTL is set to 8 hours. While a usual TTL for data transmitted from Mars to the surface of Earth is of several weeks, this TTL was selected for the study to model low priority high rate engineering data. We use the a bundle of size 160MB similar to the size used by Ivancic et al. in [10]. We run the al-gorithm on the MTG model described earlier and list the most important steps in Table 5.3. We first run Algorithm 3 on the graph, which outputs the set paths P:
P ={(9: 04, 21min, {(M SL, M EX,9: 04,90)}), (10: 32, 21min, {(M SL, Ody,10: 32,120)})}
Notice that there could have been a path from MSL to Earth starting at time 17: 30, but it will be past the TTL of the bundle. Using the setP we run Algorithm 4, which gives the results shown in Table 5.3. For space constraints, we only show the steps to find the earliest arrival time.
pf = (10: 32,270,{(M SL, Ody,10: 32, 90),(M RO, Ody,12: 00, 50),
(M RO, Earth,12: 24, 267)})
The algorithm finds four paths, one of which does not arrive at destination. The path that the CGR chooses for this bundle transmission is the earliest departure path which is pCGR = (9: 04,299,{(M SL, M EX,9: 04, 120),(M EX, M RO,12: 32,
90),(M RO, Earth,12: 24, 267)}). This shows that even though MSL would have delayed the transmission by 88 minutes, the bundle was delivered to Earth 29 minutes earlier. For this illustration, we omit the queuing and OWLT delays for the sake of simplicity. Following the same logic, we run EAODR routing algorithm at different points in time and using different bundle sizes and discuss the outcomes in the next section.
5.3
Experimental Results
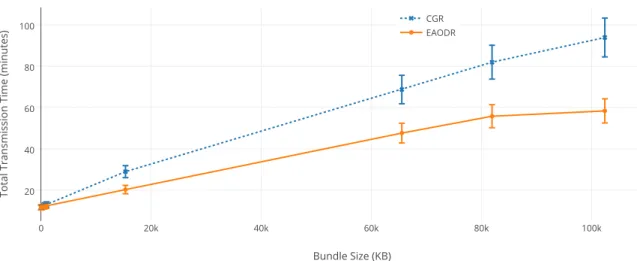
We implement a stand-alone simulator using Java that runs CGR and EAODR on the same network and displays the route and the delivery time. We run the algorithm on different combinations of bundle sizes ranging from 20KB to 100MB and 136 times of transmission chosen across a 24-hour period. Using the network described in Section 5.1.1, we obtain the results shown in Fig. 5.4. We average the total transmission times across the 136 trials grouped by bundle size. The graph shows that the larger the size of the bundle, the higher the delay generated by the CGR, which leads to an average of 12.9% decrease in delay when using our method. MSL usually sends scientific measurements, pictures and videos to the MOC on the surface of Earth resulting in large bundles; hence, any improvement in the delay means better usage of the sparse connection links. We also note that because of the nature of the network, in some time intervals, there is only one path that can be taken. This leads to similar path choices by both CGR and the proposed EAODR algorithm.
Figure 5.4: Average delivery time comparison between CGR and EAODR for different bundle sizes
We run the experiment again on randomly generated networks composed of 10 to 100 nodes and a randomly assigned Contact Plans. We run the same experiment at 136 times in one day with 12 different bundle sizes ranging from 20KB to 160MB. We compute the extra delay that CGR path takes to deliver the bundle to the destination and depict the results in Figure 5.5. This shows that as the number of nodes increases in a network, the difference in the performance of EAODR compared to CGR (i. e. T(pfCGR)−T(pfEAODR)) becomes more significant. It also shows that as the size of
the bundle increases the penalty of using CGR increases.
We choose three different bundle sizes: 750KB, 15MB and 64MB, and run the experiment again with the same setup. The result presented in Figure 5.6 shows that for the same bundle size, the difference between CGR and EAODR (i. e. T(pfCGR)−
T(pfEAODR)) becomes larger as the number of nodes in the network increases. This
shows that EAODR guarantees the earliest delivery of the bundle. To show this difference, we choose the bundle size of 64MB and compute the time it takes both algorithms to deliver the bundle. The network used is composed of 100 nodes and a
Figure 5.5: Delivery time difference between CGR and EAODR for 10 random net-work topologies and different bundle sizes
Figure 5.6: CGR delivery time penalty for three bundle sizes in randomly generated networks
randomly generated contact plan. Figure 5.7 shows the difference between the time it took CGR to deliver the bundle compared to EAODR in each time slot. The time slots where no bars are displayed are time slots where no path is available for the transmission. Also, we note that there are some time slots where the two algorithms have the same total delivery time. This is due to the following reasons: (1) there is only one path from source to destination or (2) the path with earliest departure time guarantees the earliest delivery time.
Figure 5.7: Comparison between the delivery time of CGR and EAODR in a 100-node network and a 64MB bundle
Chapter 6
Conclusion and Future Work
6.1
Conclusion
In this work, we proposed an enhancement to the Contact Graph Routing algorithm used in an implementation of DTN for the IPNs. We showed through experimental assessment of CGR that the latter does not perform optimally because it overlooks future connections in the network. CGR implements the greedy Dijkstra’s algorithm; therefore, the path that it uses has the earliest transmission time, which does not always result in the earliest delivery time. Our results proved that it leads to the loss of bundles in some cases.
Our proposed EAODR algorithm finds the path that takes the bundles from source to destination in the least amount of time with the highest delivery ratio relative to the available data rates. This algorithm was based on the Modified Temporal Graph model proposed in this work. The proposed model allowed us to represent an IPN in near-real-time accuracy and store all the data pertaining to the links between nodes that are crucial for routing. In fact, the MTG model contains data about the edge data rate and its start and end time. It also reduces the number of edges to be
handled by grouping then using the cyclic pattern of communication between every two nodes in the network.
Finally, we used the Modified Temporal Graph model to implement the proposed EAODR routing algorithm. The major enhancements obtained from this algorithm were related to three main aspects. Frist, it allowed us to use a representation of the Contact Plan that is more efficient than the enumeration of contacts used in CGR thanks to the MTG model. Second, it computes the availability of the connections based on their data rate, the bundles size and also the queuing delay and the OWLT. And finally, it constructs multiple paths using all the available future contacts and chooses the route that guarantees the earliest arrival time for the bundle regardless of the transmission start time.
To validate our work, we ran the algorithm on a realistic layout of the Earth-Mars network. We used WGC to generate the contact plan of the network composed of 8 nodes: 4 of them on the surface of Earth, one rover on the surface of Mars and the three others are Mars orbiters. We also ran the two algorithms on randomly generated networks with up to 100 nodes. In each experiment, we used 20 different bundle sizes to study their effect on the performance. We showed that for the same network layout, and the same bundle size, using our EAODR algorithm we can obtain up to 12.9% less delay on average. Our algorithm and CGR have similar performance when there are no routes or when the best path coincides with the first available path. But as we show, in most cases it is better to delay the transmission at the source or any relay node.
6.2
Future Work
We propose to integrate our proposed EAODR algorithm in the implementation of ION as an extension of this work. This will lead to a comprehensive testing of EAODR Algorithm implementation its interaction with the other components of the DTN protocol stack. As mentioned previously, we take into consideration the TTL of the bundle and queuing delay but do not use realistic values. Therefore, this algorithm could be integrated with a method that finds the expected queuing delay at each node and the variance in TTL and use them for higher accuracy in choosing the route.
The proposed algorithm does not take into consideration the fragmentation of the bundles, so an extension of the work would be to use this algorithm and compute the path by using fragmentation in nodes where the bandwidth is not enough to transmit the full bundle. This will require more coordination between the nodes and handling more information for reassembly. In addition, by fragmenting the bundle, different portions can be routed across different routes to enhance the performance. In order to integrate fragmentation, the interaction between BP and LTP should be studied.
Last but not least, since security is an important aspect in communication, the current work can be extended by incorporating confidentiality, integrity and other aspects related to security. The Bundle Security Protocol Specification [38] provides guidelines and specification for establishing a secure communication channel between communicating entities that use BP. In addition, the Licklider Transmission Protocol - Security Extensions [39] provides various techniques that can be implemented in the LTP layer to ensure comprehensive security measures.
Bibliography
[1] H. El-Damhougy and K. Jerelt, “Interplanetary communications network, in-terplanetary communications network backbone and method of managing inter-planetary communications network ,”
![Figure 2.1: Interplanetary Network (source: [1] - Modified)](https://thumb-us.123doks.com/thumbv2/123dok_us/524234.2561720/15.918.163.809.205.541/figure-interplanetary-network-source-modified.webp)
![Figure 5.1: Earth-Mars experimental network topology (source: [1] - Modified)](https://thumb-us.123doks.com/thumbv2/123dok_us/524234.2561720/41.918.162.808.151.434/figure-earth-mars-experimental-network-topology-source-modified.webp)
![Table 5.1: Contact plan for all nodes in the network (Source: [2]) Node1 Node2 # of Con-tact Win-dows Total dura-tion (min) MSL MRO Mars Odyssey Mars Express 222 113811393918789](https://thumb-us.123doks.com/thumbv2/123dok_us/524234.2561720/43.918.259.709.193.556/table-contact-nodes-network-source-total-odyssey-express.webp)