Visual Exploration of Malicious Network Objects Using Semantic Zoom,
Interactive Encoding and Dynamic Queries
Gregory Conti, Julian Grizzard, Mustaque Ahamad and Henry Owen Georgia Institute of Technology
ABSTRACT
This paper explores the application of visualization techniques to aid in the analysis of malicious and non-malicious binary objects. These objects may include any logically distinct chunks of binary data such as image files, word processing documents and network packets. To facilitate this analysis, we present a novel visualization technique for comparing and navigating among 600-1000+ such objects at one time. While the visualization technique alone has powerful application for both directed and undirected exploration of many classes of binary objects, we chose to study network pack-ets. To increase effectiveness, we strengthened the visualization technique with novel, domain-specific semantic zooming, interac-tive encoding and dynamic querying capabilities. We present re-sults and lessons learned from implementing these techniques and from studying both malicious and non-malicious network packets. Our results indicate that the information visualization system we present is an efficient and effective way to compare large numbers of network packets, visually examine their payloads and navigate to areas of interest within large network datasets.
CR Categories: C.2.3 [Computer Communication Networks]: Network Operations—Network Monitoring C.2.0 [Computer Com-munication Networks]: General—Security and Protection H.5.2 [Information Systems]: Information Interfaces and Presentation— User Interfaces
Keywords: binary object visualization, payload visualization, binary navigation, packet visualization, network visualization, re-verse engineering
1 INTRODUCTION
Visualization of security data has recently emerged as a powerful technique to provide insight and support analysis that is difficult with traditional text and charting techniques as well as signature and anomaly based machine processing. Current best practices in the network visualization domain employ scatterplots [1,2,3], parallel coordinate plots and line segments [4,5,6], glyphs [7], geographic layout [8,9,10], text representation [11], graphs [12,13] and sim-ilar high-level techniques to support security analysts. While cur-rent techniques have been proven useful through anecdotal evidence and evaluations [14,15,16,17], we believe that they should be com-bined with low-level representations of network packets, including payloads, to create domain-specific highly interactive systems. To this end, we present both a novel low-level visualization technique which we call abinary rainfalland a visualization system which al-lows users to semantically zoom [18] through eight representations of network traffic. We also explore the use of dynamic queries [19] and interactive encoding to enhance the performance of the system. Some of the most promising network security visualization sys-tems to date make excellent use of packet header data, particularly
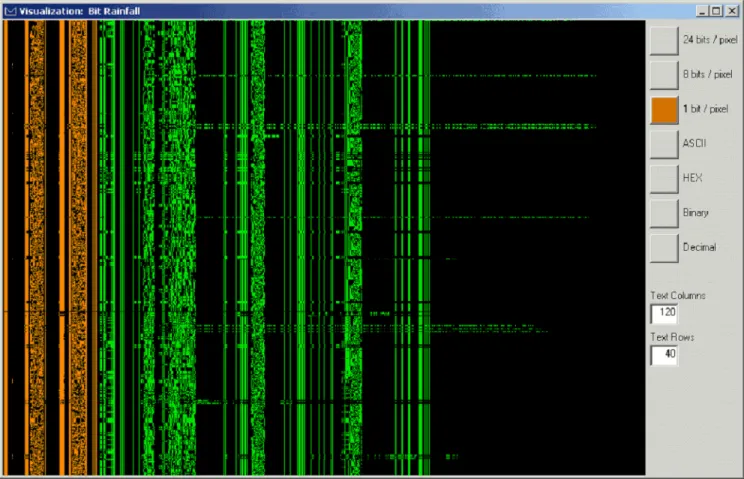
at the network and transport layers. While very useful in certain instances, these systems do not adequately visualize data at the ap-plication level and subsequently miss payload based malicious ac-tivity. To address this issue, our binary rainfall technique allows users to compare payloads of 600-1000+ packets at one time. The system, shown in Figure 1, plots pixels in direct correspondence to the bits in network packets, one packet per horizontal row. Our results indicate that it presents, in a usable and effective manner, 45-360 times more information than with traditional hexadecimal representations.
While text has been the most common way to examine packet payloads, some research has been completed that uses visualiza-tion and other techniques. Axellson combined a Bayesian classi-fier with visualization to support analysis of HTTP payloads [20]. Signature based intrusion detection systems, such as Snort [21], ex-cel at the pattern matching of packet payloads. Ethereal [22] is an exceptionally comprehensive protocol analyzer, which dissects packets and displays payloads in textual format. In the area of intru-sion detection, Wang and Stolfo demonstrate a statistical approach based on the byte frequency of packet contents and return results in the form of byte frequency histograms [23]. In the area of file visualization, Yoo constructed self-organizing maps based on the executable content [24], abstracting away the underlying low-level binary structure. In the related field of binary analysis, the IDA Pro disassembler [25] and, to the best of our knowledge, all other reverse engineering tools, rely solely on the textual representation of binary objects. The common characteristic of these approaches is that they display the payload solely in textual format or abstract away the payload altogether and produce only higher-level informa-tion. Our graphical approach attempts to break the paradigm of the canonical hex and ASCII format used by these approaches, while at the same time, allowing the analyst to view low level details of packet headers and payloads.
To test the efficacy of the rainfall visualization, semantic zoom, dynamic queries and interactive encoding we implemented a sys-tem that performs both live packet capture and forensic analysis using libpcap formatted files. We examined a variety of malicious and non-malicious network traffic including DEFCON Capture the Flag [26], United States Military Academy CyberDefense Exercise [27] and Honeynet Project datasets [28] as well as datasets collected from a Botnet sinkhole created at Georgia Tech. These datasets in-cluded worm traffic, buffer overflows, network scans, trojans and other malicious activity. In addition, we examined several classes of typically non-malicious activity including SMTP, HTTP, Telnet, SSH, VoIP, FTP and SSL. From this experience, we present results and lessons learned.
To summarize, the primary contributions of this paper are a novel visualization technique that allows comparison of hundreds of bi-nary objects, experimental results from using the technique on ma-licious and non-mama-licious network traffic datasets, an application of the semantic zoom paradigm in the security visualization do-main and lessons learned from the design and implementation of the underlying system.
Section 2 describes the model and examines the design of the system including the visualization technique, implementation de-tails and interaction paradigm. Section 3 describes the results from
Figure 1: Binary Rainfall Visualization of Defcon 11 “Capture the Flag” Network Traffic. One packet is plotted per horizontal line. In this level of zoom, each pixel represents one bit of network traffic. Network layer protocol headers are encoded in orange and the encapsulated IP payload is encoded in green. This visualization allows analysts to readily compare approximately 600-1000+ packets per screen.
a series of controlled laboratory experiments. Section 4 provides analysis of these results. Section 5 proposes directions for future research and Section 6 presents our conclusions.
2 SYSTEMDESIGN
2.1 Design Overview
The primary design goal of the system was to provide users the ability to view a large number of network packets in a way that supports rapid comparison, deep and broad semantic understand-ing, and highly efficient analysis capabilities. At the same time, we wish to allow intuitive interaction in order to remove noise and highlight packets of interest. To support this interaction, we pro-vided the user with controls for dynamic queries, semantic zoom-ing and interactive encodzoom-ing. Section 2.2 explains the design of the visualization and Section 2.3 presents the interaction paradigm. In section 2.4 we describe the implementation of the system for use in network monitoring, forensic analysis and intrusion detection.
2.2 Visualization Design
The binary rainfall visualization (Figures 1 & 2) was inspired by the classic waterfall display used for spectrum analysis but instead plots binary objects, one per horizontal line, in time sequence order. The user interacts with the display using the semantic zoom menu on the right portion of the window (Figure 1). While conceptually this menu will allow a wide variety of views of the data objects, we implemented eight, four graphical and four textual. The graphical
views plot pixels in direct correspondence to the structure of the bi-nary data. These four views include plotting each bit of bibi-nary data as a monochrome pixel (Figure 1), each byte of binary data as a grayscale pixel, each three bytes of binary data as 24-bit RGB pixel as well as a rainfall representation of byte frequency (Figure 3). The byte frequency view plots one packet per horizontal line. Pixels along the horizontal axis, scaled from 0-255, are illuminated based upon the frequency with which the corresponding byte appears rel-ative to each packet. The pixel may be illuminated as a single color if one or more of a given byte is present (byte presence) or encoded with color based upon the frequency (byte frequency). The textual views allowed the user to view the same objects as ASCII, hex-adecimal, decimal or binary representations. We provide each of these views to allow the user to visualize network traffic as needed by their current tasks. As we described in Section 1, current tech-niques for analyzing network payload data rely almost exclusively on textual representations. By combining textual header and pay-load visualization with graphical techniques, we gain a significant increase in the amount of data that can be displayed on the screen at one time. Table 1 shows the increase, in various graphical modes, when compared to ASCII and Hex representations.
While generally applicable to many types of binary objects, we applied the visualization technique to network packets in order to test its effectiveness. A key criterion is that network packets are highly structured and small enough, typically less than 1518 bytes, to be effectively displayed and compared using our graphical modes.
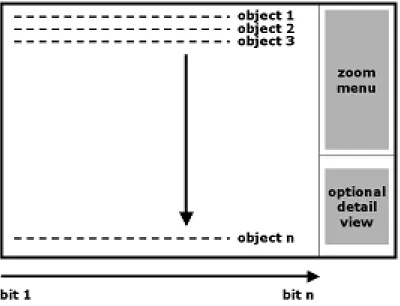
Figure 2: Binary Rainfall Visualization Design. The bits of each packet are plotted horizontally. Each new packet is plotted on a horizontal line below the previous packet. The semantic zoom menu is present on the top right. An optional detail view pane, in the lower right, allows viewing of a single packet.
Table 1: Comparison of graphical gains over textual representations of binary data in terms of information density.
Graphical ASCII Hex 1 bit per pixel 15x 45x 8 bits per pixel 120x 360x 16 bits per pixel 240x 720x 24 bits per pixel 360x 1080x 32 bits per pixel 480x 1440x
2.3 Interaction Paradigm
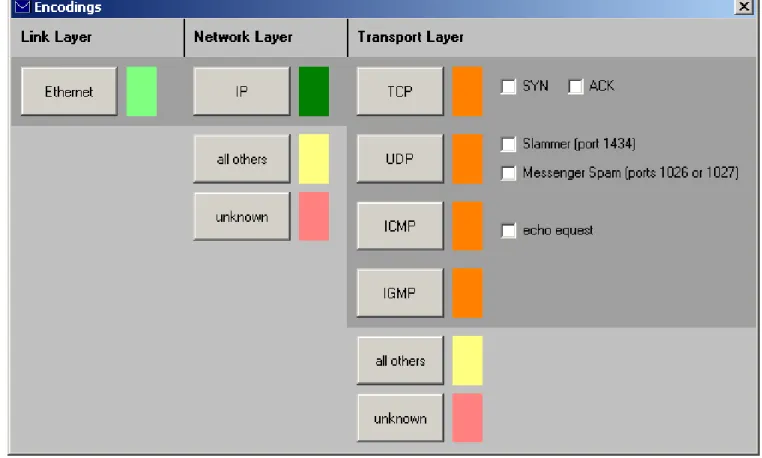
The interaction paradigm for the system was designed to support analysis of network traffic and includes three key components: se-mantic zoom, dynamic queries and interactive encoding. By ma-nipulating these three aspects of the system, we wish to support the user in identifying both malicious and non-malicious network traf-fic. The semantic zoom menu, inspired by MapQuests [29] street to country zoom paradigm, is shown in Figure 1. This menu al-lows the user to easily view any of the eight representations with the exception of the byte frequency view, which we chose to im-plement in a separate window to facilitate side-by-side comparison. The dynamic queries menu, not shown, uses double-ended sliders to constrain sequential packet ranges, source and destination IP ad-dress ranges as well as source and destination UDP and TCP ports. The screen is automatically refreshed after each change. The in-teractive filtering and encoding menu, shown in Figure 4, exploits the logical relationship between filtering and encoding at the pro-tocol level. By depressing combinations of the buttons (or check-ing boxes) users can dynamically filter the packets visible on the display. Additional, custom designed, filters such as the Slammer and Messenger Spam filters, shown above, provide additional func-tionality. The user may also experiment with various encodings by clicking on the colored squares. By doing so, the user can choose a different color with which to encode the protocol headers of the packet. This can be seen in Figure 1 where network layer headers
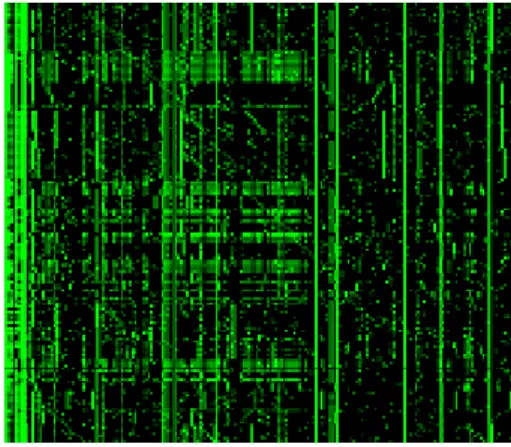
Figure 3: Detail of Byte Frequency View: The byte frequency view is one of the semantic levels available to the user. Bytes (0-255) are plotted along the horizontal axis. As each packet is plotted, pixels are illuminated according to the frequency of that byte relative to each packet. The left figure shows the generic design and the right figure shows the byte frequency of network traffic from a Honeynet Project Scan of the Month Dataset.
are encoded in orange. Note that link layer headers would typically be visible as well, but the DEFCON dataset was stripped of these headers, presumably to anonymize MAC address information.
2.4 System Architecture and Implementation
The system (Figure 5) was developed using Microsoft Visual Stu-dio, primarily for its strength in rapid GUI development. Our plan is to exploit the strength of GUI development under Windows and port the software to a more robust Open GL / QT application in the Linux/Unix environment after the user interface and visualiza-tion design has been finalized. The primary test bed system was an AMD 2500+ with 1GB of RAM, 64MB of Video RAM, 10/100 network card and 160GB hard drive running Windows XP.
The application entitled RUMINT, short for rumor intelligence, captures packets live from the network using the winpcap library for kernel level capture and the PacketX [30] ActiveX component for easy access to network data from Visual Studio applications. While
Figure 4: Interactive Filtering and Encoding Control Panel. This panel exploits the fact that filtering and encoding are logically intertwined. It allows the user to perform dynamic queries on the network dataset as well as customize color and other encoding techniques.
this proved straightforward for live capture, PacketX unfortunately does not support pcap file access. This proved problematic and we ultimately resorted to creating a simple file format and building a pcap to RUMINT conversion utility using C under Linux. The util-ity uses the Linux pcap library to load and extract the packet capture file. It then generates a unique end of packet marker and saves the packets in a binary file using the packet marker as a separator. We used this utility to convert all of our forensic capture files to the RUMINT format. We leave integrated pcap file access for future work.
When the packet data is loaded from a file or captured from the network interface it is parsed and stored in a RAM buffer. We chose a fixed limit of 100,000 packets. The user interacts with the encod-ing, filtering and zoom menus to select the parameters of interest. The system then queries the RAM buffer for the appropriate packets and submits the data to the graphics engine. The graphics engine updates any number of visualization windows. While we have sev-eral other visualizations included in the system, they have already been described [31]. We focus instead on the novel visualization and interaction components.
3 RESULTS
To test the efficacy of the system we used it in a wide variety of scenarios, both operational and experimental, with real-time packet capture and with forensic packet capture files. We interviewed 25 computer security specialists in individual and group settings and used their feedback to guide iterations of the systems design. When implementation of their ideas was not possible, we have included them, when appropriate in our future work plans listed in Sections
4 and 5.
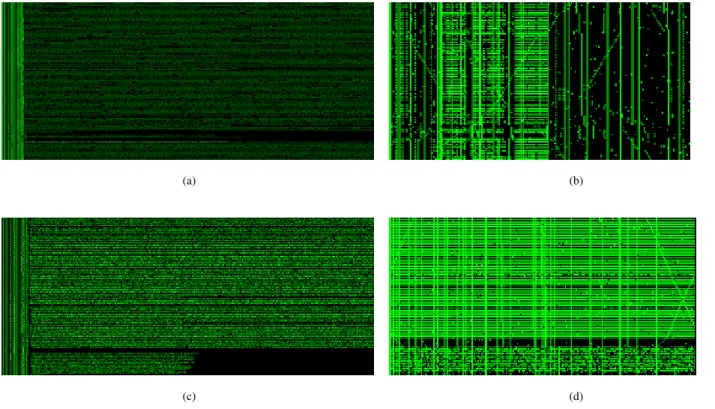
Our initial experiments consisted of testing the system with legit-imate SMTP, HTTP, Telnet, SSH, VoIP, FTP and SSL traffic. These tests allowed us to characterize what normal traffic looks like. We then used the system to visualize a variety of common attack tools in order to create additional visual fingerprints using the approach described in [31]. We used representative images from these re-sults to create a smart book for use by analysts. Sample images are shown in Figure 7. After conducting this background work, we examined a variety of malicious and non-malicious network traffic from forensic datasets including those from the DEFCON Capture the Flag [26], the United States Military Academy CyberDefense Exercise [27] and the Honeynet Project [28] as well as datasets col-lected from a Botnet sinkhole created at Georgia Tech.
Operationally, we used the system to monitor Georgia Tech Hon-eynet traffic for ten months, from July 2004 to April 2005. In a typ-ical usage scenario, users loaded datasets of interest and iteratively adjusted the menu parameters to focus on areas of interest. For ex-ample, a user examining a honeynet dataset wished to filter as much Internet background radiation [32] as possible. Being familiar with Pangs observation that a portion of UDP traffic is caused by mes-senger spam, the user wished to constrain the visualization to dis-play only UDP traffic from common messenger ports then confirm that the traffic was indeed messenger spam and finally to filter those packets. The user first viewed the entire data set and noted that a portion of the traffic contained groups of nearly identical packets (Figure 7a) with a high percentage of bytes in the printable ASCII range (Figure 7b). The user examined the payloads of these pack-ets and verified their similarity (Figure 7c). Using semantic zoom, the user confirmed the traffic as messenger spam (Figure 7d) and
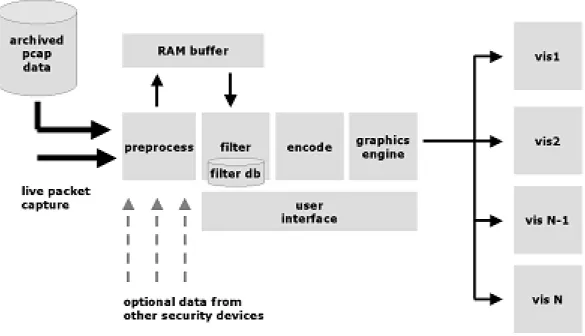
Figure 5: System Architecture. Network traffic is collected through packet capture or replayed from forensic pcap files. The system stores complete packets, both headers and payloads, in a RAM buffer. The user interacts with the user interface and the resulting data is pulled from the buffer and sent to the graphics engine for display using a number of visualizations. Additional information may be provided by devices such as firewalls and intrusion detection systems and used to assist encoding, filtering and semantic zooming.
created a filter for use with future datasets (the filter can be seen in Figure 5). We found that our test subjects liked the notion of working through slices of the traffic and then removing them from the dataset. By iteratively removing noise from the display, this approach takes maximum advantage of the high-bandwidth visual recognition capability of human analysts and allows them to in-crementally remove known traffic and focus on the unknown, but interesting remainder.
4 ANALYSIS
4.1 Visualization Design
We were pleased with the overall design of the visualization. Its primary strength is the lack of abstraction, making it ideal for low-level analysis of network packets and other binary objects. The byte frequency display augments the bit and byte level graphical views and provides insight into the nature of the traffic. We found it most useful to rapidly classify traffic as human readable, machine read-able or encrypted. Both techniques effectively allowed over 1,000 network packets to be viewed at a very detailed level and easily compared. The exact number of objects that can be displayed ap-proaches the vertical resolution of the users monitor. This upper limit proved to be sufficient when combined with zooming and fil-tering, but we envision the need to allow the user to page, or scroll, through multiple screens of content rather than the confine them to the single view window that our current system provides. While the system succeeded in visualizing a large number of objects, the rain-fall visualization is limited to displaying approximately 1000 bits (1 bit / pixel mode), 1000 bytes (8 bits / pixel mode) and 3000 bytes (24 bits / pixel mode) of each packet at any given time. In some instances this might prove to be an obstacle, but in the case of net-work packets it was successful, particularly when compared with a pure ASCII/Hex text display. Ethernet frames are limited to 1518
bytes,1which is well within the display parameters of the system.
In future implementations we will also consider the addition of a traditional, i.e. non-semantic, zoom capability to allow far more of the data to be displayed. It is important to note that test users found the 1 bit and 8 bits per pixel modes most effective. The 24 bit mode proved useful for comparing packet length, but little else. In future work we plan to test combined modes that use a higher resolution (1 bit and 8 bits per pixel mode) display for header data and lower resolution (8 and 24 bits per pixel) display for payload data.
While the visualization provides high information density it comes at the cost of lost timing data. Packets are visualized as they arrive, which results in an information rich display that is useful for comparing packets. Spacing packets based on time of arrival is eas-ily possible, but would create a sparsely populated display that we believe would hinder analysis.
It is also important to consider the security of graphical binary rainfall screenshots. Because the graphical modes represent large amounts of actual network traffic, to include payloads, it would be straightforward for an attacker to extract this information by creat-ing an application which examines pixels. The same amount of care should be taken with these images as when sharing network capture files. In future work we will consider creating anonymization tools for the images similar to tcpdpriv and ipsumdump. We also believe that many classes of information visualization tools, including our system, are subject to overt and covert manipulation by malicious entities who inject carefully crafted traffic into the network [33].
4.2 Interaction Design
Effective interaction is key to the value of the system. While the bi-nary rainfall visualization technique allows users to compare 600-1000+ binary objects and detect general patterns, anomalies and
1Although, in certain applications, “jumbo frames” of up to 9,000 bytes
(a) (b)
(c) (d)
Figure 6: Comparison of ASCII (a & b) and SSH (c & d) network traffic. The binary rainfall images (left column) provide a quick overview of packet structure. Headers and packet lengths are readily apparent. The byte frequency images (right column) clearly show the difference between printable ASCII content (b) and encrypted content (d). Solid vertical lines indicate reoccurring values such as constant header fields. Diagonal lines indicate incrementally changing values, such as sequence numbers.
outliers, it is most effective when combined with dynamic queries, semantic zoom and interactive encoding. Our users used these ca-pabilities to focus on areas on interest, but an unpredicted filtering issue emerged. Our system design failed to take into account the users need to toggle between a filtered range and its inverse. Users desired this capability to examine certain classes of traffic and then remove that slice of data from view. Essentially, what was required was the ability to invert each filter. While we were able to hard code this capability in select instances, we envision, in future systems, the utility of a filter database where analysts can build and share these filters (perhaps with analyst comments). Each filter would have three states: off, on (band pass) and on (inverted band pass).
4.3 System Design
System performance was acceptable up to 100,000 packets, but was sluggish beyond this level. There were two primary reasons: slow graphics operations and inefficient data structures to buffer packet data. We were not surprised by these limitations. The strength of Visual Studio lies not in efficient graphics operations and pointer-based data structures, but in rapid GUI development. In the fu-ture, we believe we can achieve an order of magnitude performance boost by utilizing Open GL and more efficient data structures.
5 FUTUREWORK
There are several directions we are considering for future work. While our current work addresses the visualization of individual network packets we would like to modify the system to reconstruct TCP flows. From these flows we plan to reconstruct entire applica-tion level payloads, executable payloads in particular, and examine
them for malicious content such as buffer overflows. We also plan to apply the rainfall visualization technique to file system security problems. For example, we believe it will allow large numbers of files to be directly compared and examined for header overrun ex-ploits common in various file types such as JPEG and MP3.
6 CONCLUSIONS
In this paper, we explored the combination of dynamic queries, se-mantic zooming and interactive encoding with a visualization tech-nique for comparing large numbers of binary objects. We proposed a general model for the design of such systems and used it to guide the development of an information visualization system. We then used the system to study several datasets containing large numbers of malicious and non-malicious network packets. We believe the binary rainfall visualization technique is useful for off-line forensic analysis of network datasets and, to a lesser degree, for real time network monitoring and intrusion detection. In both applications it should be augmented with dynamic queries, semantic zooming and interactive filtering to eliminate noise and highlight areas of inter-est. We also believe that these techniques would work extremely well for navigation within and analysis of binary files, particularly when combined with semantic encoding and transforms based on knowledge of the file type.
7 ACKNOWLEDGEMENTS
We would like to thank Bill Cheswick, Tom Cross, David Dagon, Ron Dodge, Jeff Gribschaw, Oleg Kolesnikov, Mike Hamelin, Sven Krasser, Wenke Lee, David Maynor, Rand Smith, Jason Spence,
(a) View of Georgia Tech honeynet traffic (with headers) (b) Byte frequency of Georgia Tech honeynet traffic
(c) Filtering all traffic, but UDP ports 1026 and 1027 (d) Closer examination confirms traffic is Messenger Spam
Figure 7: Use of the System to Rapidly Identify and Filter Traffic. An analyst views a day’s capture from the Georgia Tech Honeynet (a) and examines the byte frequency of the packets (b). Several sets of packets have a large number of bytes in the printable ASCII range. By using the interaction menus, the analyst examines the payloads of these packets and verifies their similarity (c). Using the semantic zoom capability, the analyst confirms the traffic as messenger spam (d) and creates a filter that can then be used with future datasets (the filter can be seen in Figure 5).
John Stasko, Grant Wagner and the Yak Group for their thought-ful comments. In addition we would like to thank the Georgia Tech Information Security Center (www.gtisc.gatech.edu), United States Military Academy Information Technology and Operations Center (www.itoc.usma.edu), Interz0ne (www.interz0ne.com) and DEFCON (www.defcon.org) communities for their continued sup-port and feedback.
REFERENCES
[1] Tom Goldring. “Scatter (and other) Plots for Visualizing User Profiling Data and Network Traffic,” ACM Workshop on Visualization and Data Mining for Computer Security (VizSec/DMSec), 2004.
[2] Jonathan McPherson, Kwan-Liu Ma, Paul Krystosek, Tony Bartoletti, Marvin Christensen. “PortVis: A Tool for Port-Based Detection of Se-curity Events” ACM Workshop on Visualization and Data Mining for Computer Security (VizSec/DMSec), 2004.
[3] Kiran Lakkaraju, William Yurcik, Adam Lee, Ratna Bearavolu, Yi-fan Li, and Xiaoxin Yin. “NVisionIP: NetFlow Visualizations of System State for Security Situational Awareness,” ACM Workshop on Visualiza-tion and Data Mining for Computer Security (VizSec/DMSec), 2004. [4] Marchette, D. Computer Intrusion Detection and Network Monitoring:
A Statistical Viewpoint, Springer, 2001.
[5] Soon Tee Teoh, T. J. Jankun-Kelly, Kwan-Liu Ma, and S. Felix Wu. “Visual Data Analysis for Detecting Flaws and Intruders in Computer
Network Systems,” IEEE Computer Graphics and Applications, IEEE Computer Society Press, September/October, 2004.
[6] Xiaoxin Yin, William Yurcik, Michael Treaster, Yifan Li and Kiran Lakkaraju. “VisFlowConnect: NetFlow Visualizations of Link Relation-ships for Security Situational Awareness,” ACM Workshop on Visual-ization and Data Mining for Computer Security (VizSec/DMSec), 2004. [7] Robert Erbacher, Kenneth Walker and Deborah Frincke. “Intrusion and Misuse Detection in Large-Scale Systems,” Computer Graphics and Ap-plications, Vol. 22, No. 1, January/February 2002, pp. 38-48.
[8] Tamara Munzner. “Interactive Visualization of Large Graphs and Net-works,” Ph.D. dissertation, Stanford University, June 2000.
[9] The Cooperative Association for Internet Data Analysis (CAIDA). http://www.caida.org/.
[10] Eleftherios Koutsofios, Stephen North, Russell Truscott, Daniel Keim. “Visualizing large-scale telecommunication networks and services (case study),” IEEE Visualization, 1999.
[11] Hideki Koike and Kazuhiro Ohno. “SnortView: Visualization System of Snort Logs,” ACM Workshop on Visualization and Data Mining for Computer Security (VizSec/DMSec), 2004.
[12] Graphviz - Graph Visualization Software. http://www.graphviz.org/.
[13] Etherape: A Graphical Network Monitor.
http://etherape.sourceforge.net/.
[14] Anita Komlodi, John Goodall and Wayne Lutters. “An Information Visualization Framework for Intrusion Detection,” ACM Conference on Human Factors in Computing Systems (ACM CHI), 2004.
“Home-Centric Visualization of Network Traffic for Security Adminis-tration,” ACM Workshop on Visualization and Data Mining for Com-puter Security (VizSec/DMSec), 2004.
[16] William Yurcik, James Barlow, Kiran Lakkaraju, and Mike Haberman. “Two Visual Computer Network Security Monitoring Tools Incorporat-ing Operator Interface Requirements,” ACM CHI Workshop on Human-Computer Interaction and Security Systems (HCISEC), 2003. [17] Edwin Blake. “An Extended Platter Metaphor for Effective
Reconfig-urable Network Visualization,” 8th International Conference on Infor-mation Visualisation (IV), 2004.
[18] Benjamin Bederson and James Hollan. “Pad++: a zooming graphical interface for exploring alternate interface physics,” ACM Symposium on User Interface Software and Technology (UIST), 1994.
[19] Christopher Williamson and Ben Shneiderman. “The dynamic Home-Finder: evaluating dynamic queries in a real-estate information explo-ration system,” ACM Conference on Research and Development in In-formation Retrieval (SIGIR), 1992.
[20] Stefan Axelsson. “Combining a Bayesian Classifier with Visualisa-tion: Understanding the IDS,” ACM Workshop on Visualization and Data Mining for Computer Security (VizSec/DMSec), 2004.
[21] Snort: the de facto standard for intrusion detection/prevention. http://www.snort.org/.
[22] Ethereal: A Network Protocol Analyzer. http://www.ethereal.com/. [23] Ke Wang and Salvatore Stolfo. “Anomalous Payload-based Network
Intrusion Detection,” Seventh International Symposium on Recent Ad-vances in Intrusion Detection, 2004.
[24] InSeon Yoo. “Visualizing Windows Executable Viruses Using Self-Organizing Maps,” ACM Workshop on Visualization and Data Mining for Computer Security (VizSec/DMSec), 2004.
[25] IDA Pro Disassembler - multi-processor, windows hosted disassem-bler and debugger. http://www.datarescue.com/idabase/.
[26] Capture the RootFu! The Shmoo Group.
http://www.shmoo.com/cctf/.
[27] CyberDefense Exercise. United States Military Academy. http://www.itoc.usma.edu/cdx/.
[28] Scan of the Month. The Honeynet Project.
http://www.honeynet.org/scans/
[29] Maps, Directions and More. MapQuest. http://www.mapquest.com/. [30] PacketX - wrapper for WinPcap packet capture library. beeSync
Tech-nologies. http://www.beesync.com/packetx/index.html.
[31] Gregory Conti and Kulsoom Abdullah. “Passive Visual Fingerprinting of Network Attack Tools,” ACM Workshop on Visualization and Data Mining for Computer Security (VizSec/DMSec), 2004.
[32] Ruoming Pang, Vinod Yegneswaran, Paul Barford, Vern Paxson and Larry Peterson. “Characteristics of Internet Background Radi-ation,” ACM SIGCOMM Internet Measurement Conference (ACM-IMC), 2003.
[33] Gregory Conti, Mustaque Ahamad and John Stasko. “Attacking Infor-mation Visualization System Usability: Overloading and Deceiving the Human,” Symposium on Usable Privacy and Security (SOUPS), 2005.
The views expressed in this article are those of the authors and do not reflect the official policy or position of the United States Military Academy, the Department of the Army, the Department of Defense or the United States Government.
This work was supported in part by the National Science Foundation Information Tech-nology Research award 0121643.