RESEARCH ARTICLE
Blood pressure variability, heart functionality, and left ventricular tissue
alterations in a protocol of severe hemorrhagic shock and resuscitation
XMarta Carrara,1Giovanni Babini,2,3Giuseppe Baselli,1Giuseppe Ristagno,2Roberta Pastorelli,2 Laura Brunelli,2and Manuela Ferrario1
1Department of Electronics, Information, and Bioengineering, Politecnico di Milano, Milan, Italy;2Istituto di Ricerche Farmacologiche Mario Negri IRCCS, Milan, Italy; and3Department of Pathophysiology and Transplantation, University of Milan, Milan, Italy
Submitted 20 April 2018; accepted in final form 10 July 2018 Carrara M, Babini G, Baselli G, Ristagno G, Pastorelli R, Brunelli L, Ferrario M.Blood pressure variability, heart function-ality, and left ventricular tissue alterations in a protocol of severe hemorrhagic shock and resuscitation.J Appl Physiol125: 1011–1020, 2018. First published July 12, 2018; doi:10.1152/japplphysiol. 00348.2018.—Autonomic control of blood pressure (BP) and heart rate (HR) is crucial during bleeding and hemorrhagic shock (HS) to compensate for hypotension and hypoxia. Previous works have ob-served that at the point of hemodynamic decompensation a marked suppression of BP and HR variability occurs, leading to irreversible shock. We hypothesized that recovery of the autonomic control may be decisive for effective resuscitation, along with restoration of mean BP. We computed cardiovascular indexes of baroreflex sensitivity and BP and HR variability by analyzing hemodynamic recordings col-lected from five pigs during a protocol of severe hemorrhage and resuscitation; three pigs were sham-treated controls. Moreover, we assessed the effects of severe hemorrhage on heart functionality by integrating the hemodynamic findings with measures of plasma high-sensitivity cardiac troponin T and metabolite concentrations in left ventricular (LV) tissue. Resuscitation was performed with fluids and norepinephrine and then by reinfusion of shed blood. After first resuscitation, mean BP reached the target value, but cardiovascular indexes were not fully restored, hinting at a partial recovery of the autonomic mechanisms. Moreover, cardiac troponins were still ele-vated, suggesting a persistent myocardial sufferance. After blood reinfusion all the indexes returned to baseline. In the harvested heart, LV metabolic profile confirmed the acute stress condition sensed by the cardiomyocytes. Variability indexes and baroreflex trends can be valuable tools to evaluate the severity of HS, and they may represent a more useful end point for resuscitation in combination with standard measures such as mean values and biological measures.
NEW & NOTEWORTHYAutonomic control of blood pressure was highly impaired during hemorrhagic shock, and it was not completely recovered after resuscitation despite global restoration of mean pres-sures. Moreover, a persistent myocardial sufferance emerged from measured cardiac troponin T and metabolite concentrations of left ventricular tissue. We highlight the importance of combining global mean values and biological markers with measures of variability and autonomic control for a better characterization of the effectiveness of the resuscitation strategy.
cardiovascular autonomic control; hemorrhagic shock; metabolomics; myocardial sufferance; resuscitation
INTRODUCTION
Hemorrhage and unresolved hemorrhagic shock (HS) still represent the leading cause of mortality after trauma in both civilian and military settings, with the majority of deaths occurring because of the inability to control bleeding and to effectively resuscitate hemorrhage patients (27, 67).
Therefore, much effort has been spent on investigation of the fundamental underlying pathophysiology of HS in order to develop innovative approaches or to discover new biological parameters capable of detecting the severity of blood loss, controlling bleeding, and guiding resuscitation.
HS is a form of hypovolemic shock in which an acute reduction in central blood volume causes organ hypoperfusion and consequently an inadequate oxygen supply at the cellular level. Clinical signs of this condition are severe hypotension and hypoxia, pronounced tachycardia and tachypnea, diffused coagulopathy, hypothermia, and metabolic acidosis (14).
During progressive hemorrhage, physiological compensa-tory mechanisms are usually elicited in trying to maintain homeostasis. Indeed, the cardiovascular system activates phys-iological responses with the aim of maintaining cerebral oxy-genation and blood supply to central organs; for example, neuroendocrine-mediated modifications of peripheral vascular resistance cause a redistribution of fluids that leads to nonuni-form regional blood loss. Other compensatory mechanisms consist of an increase in heart rate (HR) and myocardial contractility to increase cardiac output (CO) (62).
The role of the sympathetic autonomic nervous system (ANS) has been demonstrated to be crucial during bleeding to prevent collapse through reflex tachycardia and peripheral vasoconstriction (6, 17, 18, 23, 24, 60). Schiller et al. (62) described a dynamic coupling between arterial blood pressure (ABP) and sympathetic outflow oscillations during progressive central hypovolemia. A decrease in ABP quickly initiates an increase in traffic of sympathetic nerve impulses by decreasing inhibitory afferent activity to the nucleus of the solitary tract; the subsequent arterial vasoconstriction results in increased vascular tone and compensatory elevation in ABP, activating a baroreflex-mediated feedback reduction in sympathetic out-flow. This baroreflex-mediated phenomenon of oscillatory cou-Address for reprint requests and other correspondence: M. Carrara,
Politec-nico di Milano, Dept. of Electronics, Information and Bioengineering (DEIB), Piazza Leonardo da Vinci, 32, 20133 Milan, Italy (e-mail: marta.carrara @polimi.it).
pling between blood pressure (BP) and sympathetic activity represents an important compensatory mechanism during hy-povolemia, and there is evidence that it may be lost at the point of hemodynamic decompensation (60). These dynamics under-score the physiological importance of measuring oscillations of BP rather than relying on an average trend. Analysis of BP variability could help in understanding the extent of ANS activation in response to volume depletion, the severity of hemorrhage, whether the patient is approaching shock, and, at the same time, whether he is likely to recover, i.e., when the resuscitation is effective.
Standards of resuscitation for prehospital hemorrhagic trauma patients include administration of fluids to stabilize BP and vascular volume before blood transfusion and surgical repair. However, after the replacement of blood loss the con-sequent restoration of CO and ABP does not accurately reflect the effectiveness of treatment (52, 58). In fact, overzealous resuscitation with crystalloids dilutes oxygen-carrying capacity and clotting factor concentrations, thus exacerbating coagu-lopathy, inflammation, and hypoxia (14, 38).
For this reason, resuscitation science has tried to identify other surrogates able to assess cardiocirculatory status and tissue perfusion so as to better depict shock severity and response to treatment (e.g., lactate, mixed venous saturation, base deficit, and oxygen debt) (3, 59).
In this study, we analyzed the cardiovascular signals re-corded during a protocol of severe hemorrhage and resuscita-tion with the aim of characterizing the compensatory response to hypovolemia and fluid repletion in terms of autonomic-mediated changes in BP variability and HR variability (HRV). Furthermore, hemorrhage is known to induce a sort of myocardial injury (15), and the reduction in heart size with central hypovolemia stimulates the release of other vasoactive and volume regulatory hormones, such as arginine vasopressin and renin. Vasoactive hormonal responses to hemorrhage in animals may also be species dependent; for example, Thrasher (69) confirmed that arterial baroreflexes control vasopressin but not renin release during graded hypotension in the dog.
For these reasons, we assessed the effects of severe hemor-rhage on heart functionality and cardiac tissue by integrating the hemodynamic findings with measurements of plasma high-sensitivity cardiac troponin T (hs-cTnT) and metabolite con-centrations in left ventricular (LV) tissue.
MATERIALS AND METHODS
Study Design and Experimental Procedure
Animal preparation.Nine male pigs (36⫾2 kg) received anesthe-sia by intramuscular injection of ketamine (20 mg/kg), completed by ear vein injection of propofol (2 mg/kg) and sufentanil (0.3 g/kg) and then maintained over the whole experiment with continuous intravenous administration of propofol (1–3 mg·kg⫺1·h⫺1),
midazo-lam (2– 4 mg·kg⫺1·h⫺1), and sufentanil (0.3g·kg⫺1·h⫺1). Animals
were mechanically ventilated with a tidal volume of 10 ml/kg⫺1and
inspired O2fraction of 0.21 during baseline and 0.3 during and after
the shock phase; respiratory frequency was adjusted to maintain the end-tidal partial pressure of CO2 (PCO2) values in the range 35– 40
mmHg. A 7-Fr catheter was placed in the descending aorta from the left femoral artery for blood sample collection. Another Millar Mikro-Tip pressure catheter was inserted in the right femoral artery for continuous monitoring of ABP. Continuous acquisition of central venous pressure in the right atrium, pulmonary arterial pressure, and
CO through thermodilution technique was obtained by means of an endovascular pentalumen 7-Fr catheter placed in the pulmonary artery from the right femoral vein. Continuous monitoring of LV pressure and volume was achieved by means of a Millar Mikro-Tip pressure catheter inserted in the LV cavity from the right carotid artery. Finally, a 14-Fr catheter was placed in the abdominal artery from the left femoral artery for blood withdrawal during the induction of shock, and a 14-Fr catheter was inserted in the left femoral vein for the successive blood reinfusion. The study was reviewed and approved by the Institutional Review Board and the governmental institution (Ital-ian Ministry of Health).
Acute hemorrhagic shock model. After baseline measurements, animals were randomized to one of two study groups: 1) HS and resuscitation (n⫽6) and2) sham-treated control (n⫽3). Bleeding was induced by withdrawal of blood from the left femoral artery with a peristaltic pump at a rate of 20 ml/min over an interval of 60 min, until mean arterial pressure (MAP) reached values of 40⫾5 mmHg. The hypoxic state with the consequent metabolic alteration was confirmed by serial blood lactate measurements. After 2 h of the shock condition, animals were resuscitated with a two-step procedure. Ini-tially, fluid (normal saline) and vasopressor (norepinephrine) were administered to restore MAP of at least 60 mmHg and a pulse pressure variation⬍12%. Then, shed blood was reinfused with the aid of a peristaltic pump over an interval of 30 min. After 1 h of observation, animals were euthanized by intravenous injection of Tanax (1 ml/10 kg) and heart biopsies from the LV were taken for histological, biochemical, and omics analyses.
For sham-treated animals the preparation was identical, but they did not undergo bleeding, fluid resuscitation, or blood reinfusion. One of six HS animals was excluded because of elevated blood pressure at baseline (MAP of 130 mmHg).
Animals were studied at four relevant time points: at baseline (T1), after the development of HS (T2), after fluid and vasopressor resus-citation (T3), and after blood reinfusion (T4).
At each time point a bolus of phenylephrine (3g/kg) and a bolus of epinephrine (10g) were intravenously administered to elicit the response of the ANS. Arterial and venous blood samples were collected for blood gas analysis and laboratory analyses (i-STAT System; Abbott Laboratories, Princeton, NJ). Plasma hs-cTnT was measured in a central laboratory by electrochemiluminescence immu-noassay using commercial reagents (Elecsys 2010; Roche Diagnos-tics).
After death, a thoracotomy was immediately performed, the heart was exposed, and the LV anterior free wall opposite to septum 1 cm below mitral valve level was removed and collected. Samples of 50 – 60 mg comprising the entire thickness of the muscle (endocar-dium to epicar(endocar-dium) were rinsed with protease inhibitor solution and stored at⫺80°C.
Clinical Data
Clinical variables collected at each time point were the following: CO (l/min), temperature (°C), urine output (ml), arterial pH, lactate (mmol/l), PCO2 in arterial blood (mmHg), partial pressure of O2 in
arterial blood (PO2; mmHg), base excess (mEq/l), hs-cTnT (ng/ml),
oxygen saturation (%), hematocrit (%), and LV ejection fraction (LVEF; %).
Hemodynamic Analyses
Signal processing. ABP, electrocardiogram (ECG), LV pressure (LVP), and right atrial pressure (RAP) were continuously recorded during the experiment. At each time point stationary segments of 7-min length on average were selected. R-R intervals (RRI) and HR time series were extracted from the ECG waveform by means of the ECG Analysis Module available for LabChart software; time series of systolic (SAP), diastolic (DAP) and mean (MAP) arterial pressure were obtained from the ABP waveform with specific algorithms (68,
74). Beat-to-beat RAP time series consist of the mean values of RAP within each cardiac cycle; the maximum of the derivative of LVP upstroke (dP/dtmax) was derived on a beat-to-beat basis from the LVP recording, and it was taken as an indirect measure of heart contrac-tility. Temporal relationships were maintained among the time series: given R(i) as the R peak of the current beat, RRI(i) designated the difference between R(i ⫹ 1) and R(i), SAP(i) follows R(i) and is followed by DAP(i), dP/dt(i) is the slope of the upstroke right after R(i), and RAP(i) is the averaged RAP values within RRI(i). Finally, an adaptive filter was applied to the data to remove outliers and irregularities (71). Each segment was subdivided into 3-min 50% overlapping windows. Each time series was resampled at 2 Hz by means of zero-order hold techniques, and then it was detrended with a high-order polynomial function to guarantee stationarity, further verified with the Dickey-Fuller and Kwiatkowski-Phillips-Schmidt-Shin statistical tests.
All the indexes obtained for these series were averaged and con-sidered for successive statistical comparisons.
Time and frequency indexes.We computed the mean value of SAP, DAP, MAP, RRI, dP/dtmax, and RAP series.
Spectral indexes obtained from power spectra included low-fre-quency (LF, 0.04 – 0.15 Hz) power distribution, total power (TP), which represents the total area under the spectrum and is a measure of the overall variability of the series, and LF%, which represents the relative power in the LF band and is computed as LF/(TP⫺VLF)%, where VLF is the very low-frequency component (0 – 0.04 Hz).
Cardiac baroreflex sensitivity analysis.We adopted the bivariate model method (4). Briefly, the two parameters of interest are the feedback (FB) gain, which represents the baroreflex mediated by the ANS, i.e., changes in RRI induced by oscillations in SAP and mediated by the ANS, and the feedforward (FF) gain, which denotes the mechanical influence of RRI on SAP through the heart and vasculature, also called the runoff effect. As the current RRI(i) cannot immediately affect SAP(i), a one-beat delay was considered for the FF relationship. Granger causality from SAP to RRI and vice versa was verified before computation of the gains (32, 54). The order of the model was optimized based on the Akaike information criterion, ranging from 5 to 15.
Heart rate complexity analysis.We assessed HRV by means of linear and nonlinear methods. In particular, we computed the root mean square of successive differences between adjacent RRI (RMSSD), the standard deviation of successive differences between adjacent RRI (SDSD), and the standard deviation of the overall RRI time series (SD) (48a). Moreover, we calculated the quadratic sample entropy (QSE) to investigate the nonlinear characteristics of HRV (43). The template lengthmwas fixed at 1, and the tolerancerwas computed as 20% of the SD of the time series.
Model-based system identification of DAP variability. To better investigate the different mechanisms of peripheral resistance control, we implemented a multi-input single-output causal black-box model for the prediction and spectral decomposition of DAP beat-to-beat fluctuations from variability signals of SAP, RAP, and RRI. The methodological principles underlying multivariate linear black-box modeling have been exhaustively illustrated elsewhere (5). Assuming that DAP variability is a surrogate measure of peripheral vascular resistance (2, 51), the current DAP value is assumed to be influenced by arterial and cardiopulmonary baroreflex control and by the me-chanical coupling between the heart and the circulatory system, the so-called runoff effect. To disentangle these mechanisms and to highlight their different contributions in DAP variability, we modeled such mechanisms as follows:
DAP(i)⫽
兺
j⫽s1 n hsap共
j兲
· SAP共
i⫺j兲
⫹兺
j⫽s2 n hrap共
j兲
· RAP共
i⫺j兲
⫹hrr共
1兲
· RR共
i兲
⫹e共
i兲
⫽DAPsap⫹DAPrap⫹DAPrr⫹DAPnoise(1)
We limited the effect of the mechanical runoff to a single gain parameterhrr(1), for physiological reasons. Granger causality among
the cardiovascular time series was verified before computation of the model (32). The optimal model ordernwas assessed with the “ARMA Parameter Reduction algorithm,” as proposed in Ref. 53, starting from a maximal order valuenequal to 12 and delays [s1,s2] equal to zero. Model parameters were determined by a least-squares minimization procedure. The black-box input-output relationships inEq. 1can be assumed to be representative of the following mechanisms of DAP variability control:
• SAP¡DAP (DAPsap) represents the black-box model for the
arterial baroreflex mediated sympathetic control of vasomotor tone.
• RAP¡DAP (DAPrap) represents the black-box model of
vaso-motor tone control related to the cardiopulmonary baroreflex; we assumed that RAP oscillations are representative of pressure oscillations sensed by cardiopulmonary baroreceptors.
• RRI¡DAP (DAPrr) represents the mechanical effect of
dia-stolic runoff.
The residual error (DAPnoise) includes all the remaining sources of
variability not measured, such as the influence of DAP past values, the autoregulation-mediated control of peripheral resistance, possible er-rors, or noise.
To quantify the amount of DAP variability explained by each component, a spectral decomposition was performed. In particular, we performed spectral analysis of the model component series (DAPsap, DAPrap, DAPrr) and then assessed the ratio of LF power
of DAPsap, DAPrap, or DAPrr components over total LF power
DAP (LF DAPsap/LF DAP, LF DAPrap/LF DAP, or LF DAPrr/LF
DAP), respectively.
Analysis of response to phenylephrine and epinephrine administration.Changes in HR with respect to changes in MAP were analyzed during phenylephrine injection to quantify the ANS-medi-ated response to the stimulus (37).
Phenylephrine acts directly at the vessel level as a selective ␣ 1-adrenergic receptor agonist. In physiological conditions, a bolus of phenylephrine is expected to cause a rise in MAP accompanied by a decrease in HR mediated by the baroreflex autonomic mechanism.
Changes in dP/dtmax during the injection of epinephrine were analyzed to assess the ANS-mediated response of heart contractility.
Metabolomics Analyses
Metabolic profile was obtained from tissue samples of the LV for both shock- and sham-treated animals. Sample tissue preparation was performed as reported previously (10). Briefly, frozen tissue samples were disintegrated with a Mikro-Dismembrator S at 3,000 revolutions/ min for 40 s. The powder obtained was resuspended in ice-cold MeOH (3l/mg tissue) and homogenized for 1 min. Homogenized samples were subsequently centrifuged for 15 min at 10,000g, and supernatants were stored at⫺80°C. Thirty microliters of each super-natant was used for targeted metabolomics analysis. A targeted quantitative approach using a combined direct flow injection and liquid chromatography (LC) tandem mass spectrometry (MS/MS) assay (AbsoluteIDQ 180 kit; Biocrates, Innsbruck, Austria) was applied to metabolomics analysis. The assay quantifies 188 metabo-lites from five analyte groups: acylcarnitines, amino acids, biogenic amines, hexoses (sum of hexoses), phosphatidylcholines, and sphin-gomyelins. The method combines derivatization and extraction of analytes with the selective MS detection using multiple reaction monitoring pairs. Samples were analyzed with an LC/MS (Triple quad 5500; AB Sciex) method (for analysis of amino acids and biogenic amines) followed by flow injection analysis-MS (analysis of lipids, acylcarnitines, and hexose). Methodological details and data preprocessing have been extensively reported in our previous articles (13, 29).
Statistical Analyses
We adopted the Mann-WhitneyU-test, also known as the Wilcoxon rank sum test, to verify significant differences in the index values between the two groups (shock and sham-treated) separately at each time point, whereas we used the Friedman test to assess significant changes among time points within the same group of animals. Sig-nificance was considered atP⬍0.05.
RESULTS
Hemodynamic Analysis and ANS Indexes
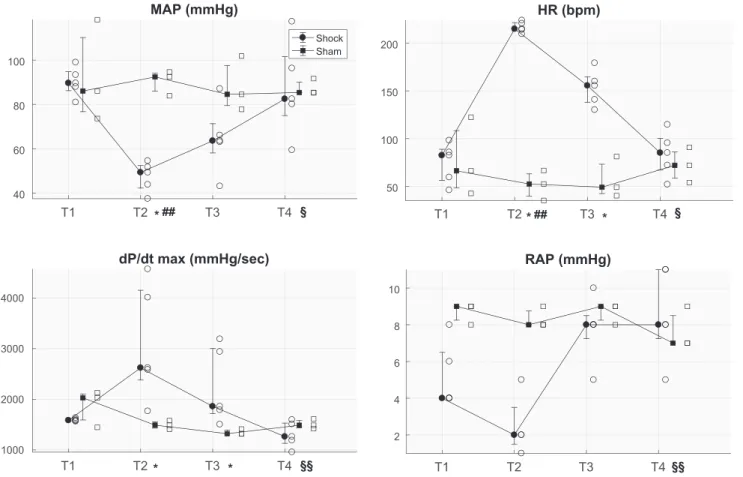
Bleeding caused a significant decrease in MAP, CO, and filling pressures and a concomitant significant increase in HR, heart contractility (dP/dtmax) and lactate compared with
sham-treated animals (Fig. 1, Table 1). After resuscitation with fluids and norepinephrine, MAP recovered to the target of 60 mmHg in all animals except one, but HR and heart contractility remained significantly higher than baseline values. Only after resuscitation with shed blood did all the indexes return to baseline values (Fig. 1).
The high level of lactate in HS pigs confirmed the severity of the hypovolemic condition. However, the preserved ejection fraction (LVEF) suggested that the severity of shock was not sufficient to induce a concurrent acute heart failure.
Table 2 shows that LF power of BP components (SAP, DAP, MAP) decreased during shock (T2) and remained lower with
respect to baseline after fluid and vasopressor resuscitation (T3). After blood reinfusion (T4) the values returned similar to baseline and higher than T3. A similar trend was observed for LF power of HR and dP/dtmax, even if less marked. Baroreflex
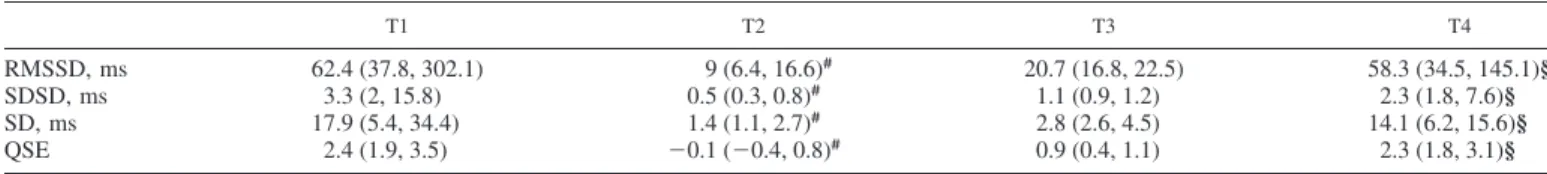
FB gain was reduced at T2 and T3 (significantly at T2) and recovered at T4; the opposite trend was observed for FF gain. Table 3 reports the HRV indexes. Variability of RRI was dramatically reduced at T2 and did not recover at T3, after fluid and vasopressor administration.
The ANS response to the administration of phenylephrine in shock pigs was quantified by considering the amplitude of the change in MAP and HR during the administration of the bolus. Similarly, the response to epinephrine was analyzed by con-sidering the magnitude of the increase in dP/dtmaxduring bolus
injection. Both MAP and HR variations in response to phen-ylephrine and dP/dtmax variation in response to epinephrine
were greatly reduced with respect to baseline at the end of the shock period (Table 4).
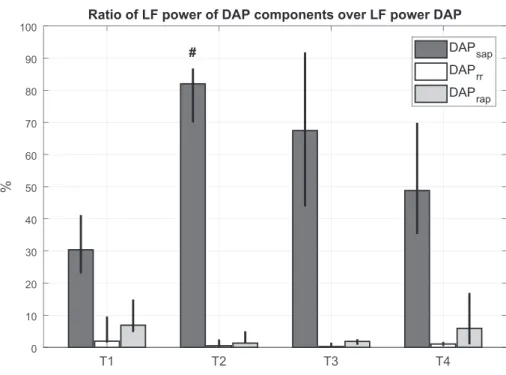
As regards the DAP model, the portion of DAP variability mediated by the arterial baroreflex mechanism (LF DAPsap/LF
DAP) was predominant with respect to the other mechanisms in each phase of the experiment (Fig. 2). A significant increase in LF DAPsap/LF DAP was observed in shock with respect to
baseline. Furthermore, the mechanical influence of the heart on the circulatory system (LF DAPrr/LF DAP) and the portion of
T1 T2 T3 T4 40 60 80 100 MAP (mmHg) Shock Sham T1 T2 T3 T4 50 100 150 200 HR (bpm) T1 T2 T3 T4 1000 2000 3000 4000 dP/dt max (mmHg/sec) T1 T2 T3 T4 2 4 6 8 10 RAP (mmHg) § *## *## * * * §§ §§ §
Fig. 1. Distributions (median, 25th and 75th percentiles) of the averaged value at each time point of the following variables: mean arterial pressure (MAP), heart rate (HR), maximum of 1st derivative of left ventricular pressure over time (dP/dtmax), and right atrial pressure (RAP) for both populations of hemorrhagic
shock-and sham-treated animals. Open symbols indicate values relating to each shock- or sham-treated pig. T1, baseline; T2, after development of shock; T3, after fluid and vasopressor resuscitation; T4, after blood reinfusion; bpm, beats per minute. *P⬍0.05 shock- vs. sham-treated animals (Mann-WhitneyU-test);##P⬍0.01
DAP variability regulated by the cardiopulmonary baroreflex (LF DAPrap/LF DAP) presented a u-shaped trend: they
de-creased during the shock period, remained lower than baseline after resuscitation, and recovered to baseline values after blood reinfusion.
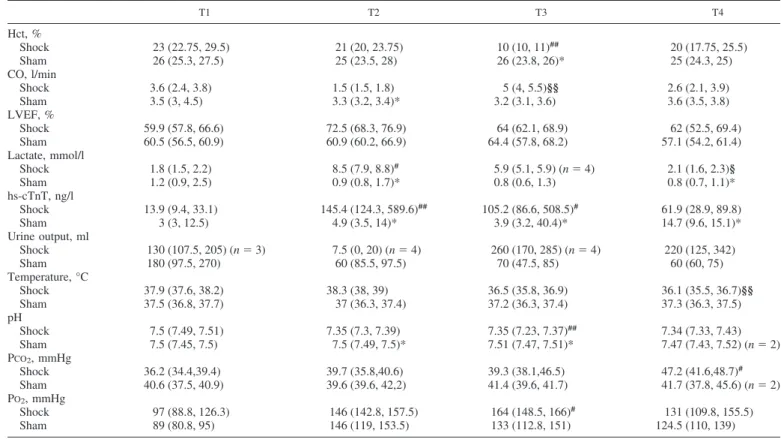
Left Ventricle Metabolic Profiling by Targeted Metabolomics All the measured metabolites are reported in Supplemental Table S1 (Supplemental Material for this article is available online at the Journal website). Only 11 metabolites signifi-Table 1. Clinical and laboratory data for hemorrhagic shock- and sham-treated animals at each time point
T1 T2 T3 T4 Hct, % Shock 23 (22.75, 29.5) 21 (20, 23.75) 10 (10, 11)## 20 (17.75, 25.5) Sham 26 (25.3, 27.5) 25 (23.5, 28) 26 (23.8, 26)* 25 (24.3, 25) CO, l/min Shock 3.6 (2.4, 3.8) 1.5 (1.5, 1.8) 5 (4, 5.5)§§ 2.6 (2.1, 3.9) Sham 3.5 (3, 4.5) 3.3 (3.2, 3.4)* 3.2 (3.1, 3.6) 3.6 (3.5, 3.8) LVEF, % Shock 59.9 (57.8, 66.6) 72.5 (68.3, 76.9) 64 (62.1, 68.9) 62 (52.5, 69.4) Sham 60.5 (56.5, 60.9) 60.9 (60.2, 66.9) 64.4 (57.8, 68.2) 57.1 (54.2, 61.4) Lactate, mmol/l Shock 1.8 (1.5, 2.2) 8.5 (7.9, 8.8)# 5.9 (5.1, 5.9) (n⫽4) 2.1 (1.6, 2.3)§ Sham 1.2 (0.9, 2.5) 0.9 (0.8, 1.7)* 0.8 (0.6, 1.3) 0.8 (0.7, 1.1)* hs-cTnT, ng/l Shock 13.9 (9.4, 33.1) 145.4 (124.3, 589.6)## 105.2 (86.6, 508.5)# 61.9 (28.9, 89.8) Sham 3 (3, 12.5) 4.9 (3.5, 14)* 3.9 (3.2, 40.4)* 14.7 (9.6, 15.1)* Urine output, ml Shock 130 (107.5, 205) (n⫽3) 7.5 (0, 20) (n⫽4) 260 (170, 285) (n⫽4) 220 (125, 342) Sham 180 (97.5, 270) 60 (85.5, 97.5) 70 (47.5, 85) 60 (60, 75) Temperature, °C Shock 37.9 (37.6, 38.2) 38.3 (38, 39) 36.5 (35.8, 36.9) 36.1 (35.5, 36.7)§§ Sham 37.5 (36.8, 37.7) 37 (36.3, 37.4) 37.2 (36.3, 37.4) 37.3 (36.3, 37.5) pH Shock 7.5 (7.49, 7.51) 7.35 (7.3, 7.39) 7.35 (7.23, 7.37)## 7.34 (7.33, 7.43) Sham 7.5 (7.45, 7.5) 7.5 (7.49, 7.5)* 7.51 (7.47, 7.51)* 7.47 (7.43, 7.52) (n⫽2) PCO2, mmHg Shock 36.2 (34.4,39.4) 39.7 (35.8,40.6) 39.3 (38.1,46.5) 47.2 (41.6,48.7)# Sham 40.6 (37.5, 40.9) 39.6 (39.6, 42,2) 41.4 (39.6, 41.7) 41.7 (37.8, 45.6) (n⫽2) PO2, mmHg Shock 97 (88.8, 126.3) 146 (142.8, 157.5) 164 (148.5, 166)# 131 (109.8, 155.5) Sham 89 (80.8, 95) 146 (119, 153.5) 133 (112.8, 151) 124.5 (110, 139)
Values are medians (25th, 75th percentiles). Hct, hematocrit; CO, cardiac output; LVEF, left ventricular ejection fraction; hs-cTnT, plasma high-sensitivity cardiac troponin T; PCO2, partial CO2pressure; PO2, partial O2pressure; T1, baseline; T2, after development of shock; T3, after fluid and vasopressor
resuscitation; T4, after blood reinfusion. Comparisons between shock and sham: *P⬍0.05 (Mann-WhitneyU-test). Comparisons between time points: #P⬍ 0.05, ##P⬍0.01 vs. T1; §P⬍0.05, §§P⬍0.01 vs. T2 (Friedman test).
Table 2. Frequency indexes and baroreflex gains for hemorrhagic shock pigs evaluated at each time point
T1 T2 T3 T4 SAP LF power, a.u. 105.3 (39.9, 165.3) 18 (12.2, 29.6) 12.5 (6.3, 35.8)# 78.9 (48.8, 102.1) LF % power, % 22.2 (7.2, 39.4) 4.8 (2.4, 6.2) 4.1 (3.3, 12.8) 18 (14.5, 21.7) DAP LF power, a.u. 155.2 (93, 234.7) 37.9 (24.7, 46.7)# 39.9 (33.5, 71.3) 196.3 (110.6, 248.3)§ LF % power, % 38.1 (20.5, 48.4) 11.4 (5.6, 11.7) 11.6 (7.1, 20.8) 53.6 (32.6, 60.7)§ MAP LF power, a.u. 80.3 (63.7, 123.5) 25.2 (18.1, 41.2) 24.8 (9.6, 47.6) 119.1 (99.1, 174.8)§† LF % power, % 16.6 (13.5, 29.8) 8.7 (4.2, 10.4) 7.4 (5.9, 13.1) 29.3 (26.4, 43.3)§ RRI LF power, a.u. 171.5 (161.7, 233) 97.3 (73.2, 130.5) 125.8 (75, 142) 116.3 (104.6, 172.7) LF % power, % 42.8 (33.4, 57.6) 32.2 (24.9, 42.6) 31.1 (21.6, 36.6) 30 (25.2, 41.2) dP/dtmax LF power, a.u. 147.8 (123.7, 214.6) 75 (50.1, 118.7) 104 (45.6, 133.8) 152.1 (111.3, 202.1) LF % power, % 31.6 (25.8, 44.9) 21.3 (14.1, 29.7) 22.7 (7.1, 40.9) 30.1 (22.6, 56.7) BRS FB gain, ms/mmHg 3.2 (1.1, 11.4) 0.08 (0.06, 0.2)## 0.2 (0.1, 0.6) 1.1 (0.8, 5.7)§ FF gain, mmHg/ms 0.05 (0.03, 0.1) 0.3 (0.2, 1.6) 0.4 (0.2, 0.5) 0.03 (0.02, 0.1)§ Values are medians (25th, 75th percentiles). SAP, systolic arterial pressure; DAP, diastolic arterial pressure; MAP, mean arterial pressure; RRI, R-R interval; BRS, baroreflex sensitivity; FB, feedback; FF, feedforward; T1, baseline; T2, after development of shock; T3, after fluid and vasopressor resuscitation; T4, after blood reinfusion. Comparisons between time points: #P⬍0.05, ##P⬍0.01 vs. T1; §P⬍0.05 vs. T2; †P⬍0.05 vs. T3 (Friedman test).
cantly changed concentrations between sham-treated and HS pigs in LV tissue (Table 5). LV tissue of HS animals was mainly characterized by enhanced levels of long-chain phos-phatidylcholine (PC) species and reduced concentrations of a few amino acids compared with LV tissue from sham-treated animals.
DISCUSSION
Cardiovascular Indexes and Models
The trends of vital signs and lactate confirmed the hypovo-lemic shock associated with a hyperdynamic cardiovascular response (Fig. 1, Table 1).
Changes in LF oscillations of BP can be related to changes in the outflow of the sympathetic nervous system, and spectral analysis of BP has been proven to be a powerful tool for identification of the different cardiovascular control mecha-nisms that regulate BP (65, 66). From this perspective, the reduction of LF power we observed during shock (Table 2) can be interpreted as a withdrawal or a saturation of sympathetic activity (6, 16, 25, 41, 64). Convertino et al. (22) and Cooke et al. (25) measured muscle sympathetic nerve activity during increasing negative pressure in a lower body negative pressure protocol, supporting the hypothesis that sympathetic with-drawal may represent a fundamental mechanism for the devel-opment of circulatory shock. Our results are thus in line with this hypothesis, i.e., acute bleeding and HS may cause a cardiovascular collapse characterized by a depressed peripheral sympathetic outflow.
Many hypotheses have been formulated in the past years, trying to explain this phenomenon. Some literature supports the concept that an “empty heart” might contribute to cardiac receptor stimulation, resulting in the activation of cardiac vagal afferents and subsequent sympathetic depression (50, 62, 64). Koyama et al. (41) proposed that prolonged brain ischemia could be the triggering cause of sympathetic outflow depres-sion documented in hypovolemic shock. Another possible
mechanism that may contribute to the loss of sympathetic peripheral outflow is the resetting of baroreflexes, which leads to a loss of synchrony between arterial BP and muscle sym-pathetic nerve activity, suggesting an impairment of arterial baroreflex control over sympathetic vasomotor activity (20, 24, 39, 40).
The available data and the results of our study do not fully support one of the above mechanisms. However, the hypoth-esis of prolonged brain ischemia-mediated sympathetic depres-sion can be excluded since the shock condition was not prolonged for long and all animals recovered after blood reinfusion. Interestingly, after resuscitation with fluid and va-sopressor (T3) the level of LF power did not recover to baseline value despite the animals reaching the target MAP values, and CO was higher than baseline (Table 1). Therefore, the persisting depressed LF oscillations of BP cannot be attributed to vagal reflexes activated by an unloading of car-diopulmonary baroreceptors.
As regards the cardiac baroreflex sensitivity (BRS) we observed a significant decrease of sensitivity during shock (BRS FB gain) that persisted even after the resuscitation maneuvers at T3 (Table 2). A dynamic reduction in BRS with decreased central blood volume has already been reported (19, 21, 23, 28, 47, 57, 73), and since it is known to reflect baroreflex-mediated cardiac vagal withdrawal (23) it could be explained as a compensatory mechanism that leads to a greater tachycardia reserve (18).
Interestingly, the opposite trend was observed for the feed-forward gain (BRS FF gain), or runoff effect, which was higher compared with baseline both in shock (T2) and after fluid and vasopressor resuscitation (T3). This may be due to a markedly high HR.
The black-box model of DAP variability, taken as a surro-gate of peripheral vascular resistance, highlighted interesting changes in peripheral control mechanisms induced by severe blood loss. During shock the cardiac baroreflex-mediated DAP oscillations (DAPsap) significantly increased with respect to
Table 3. HRV and HR complexity indexes for hemorrhagic shock pigs evaluated at each time point
T1 T2 T3 T4
RMSSD, ms 62.4 (37.8, 302.1) 9 (6.4, 16.6)# 20.7 (16.8, 22.5) 58.3 (34.5, 145.1)§
SDSD, ms 3.3 (2, 15.8) 0.5 (0.3, 0.8)# 1.1 (0.9, 1.2) 2.3 (1.8, 7.6)§
SD, ms 17.9 (5.4, 34.4) 1.4 (1.1, 2.7)# 2.8 (2.6, 4.5) 14.1 (6.2, 15.6)§
QSE 2.4 (1.9, 3.5) ⫺0.1 (⫺0.4, 0.8)# 0.9 (0.4, 1.1) 2.3 (1.8, 3.1)§
Values are medians (25th, 75th percentiles). HR, heart rate; HRV, HR variability; RMSSD, root mean square of successive difference; SD, standard deviation; SDSD, standard deviation of successive difference; QSE, quadratic sample entropy; T1, baseline; T2, after development of shock; T3, after fluid and vasopressor resuscitation; T4, after blood reinfusion. Comparisons between time points: #P⬍0.05 vs. T1; §P⬍0.05 vs. T2 (Friedman test).
Table 4. Delta values of MAP, HR, and dP/dtmaxduring administration of phenylephrine or epinephrine for shock animals
at each time point
T1 T2 T3 T4
Responses to phenylephrine administration
⌬MAP, mmHg 33.5 (27.7, 41.7) 10.6 (6.1, 13)# 27.5 (16, 31.5) 27 (19.4, 29.5) ⌬HR, beats/min ⫺13.4 (⫺27,⫺9.1) 0.08 (⫺5.4, 1.9)# ⫺5.1 (⫺10.5,⫺0.6) ⫺10.1 (⫺12.5,⫺8.2)
Responses to epinephrine administration
⌬dP/dtmax, mmHg/s 3,401.2 (2,678.2, 3,552.7) 1,602.7 (946.1, 1,986.5)# 2,188.6 (1,983.2, 3,082.3) 2,349.2 (1,826.8, 2,515.6)
Delta values (i.e., difference between final value and starting value) are medians (25th, 75th percentiles). MAP, mean arterial pressure; HR, heart rate; dP/dtmax,
maximum 1st derivative of left ventricular pressure over time; T1, baseline; T2, after development of shock; T3, after fluid and vasopressor resuscitation; T4, after blood reinfusion. Comparisons between time points: #P⬍0.05 vs. T1.
baseline, passing from ~30% to 80% in all animals. The other components (DAPrap, DAPrr) decreased at T2 and T3 with
respect to baseline (Fig. 2). These results highlighted that the large reduction in peripheral vascular resistance can be ex-plained again by the high HR, which cannot sustain BP changes.
The results of phenylephrine and epinephrine maneuvers confirmed a reduced sympathetic modulation of HR and BP as previously reported. During shock there was a reduced respon-siveness to the drugs, mostly in the HR: indeed, the variation during phenylephrine administration was negligible (Table 4). Analysis of HRV revealed that HS induced a decrease in HRV and HR complexity. In this context, the notion of com-plexity, as calculated by means of entropy estimates, refers to the regularity/irregularity of the time series, i.e., the degree to which template patterns repeat themselves; repeated patterns imply regularity and lead to reduced values of entropy. A loss of HR complexity, which means a higher regularity of the HR,
is considered a feature of impaired adaptation of the ANS to physiological stress in several cardiovascular pathologies (42, 46, 48). Accordingly, our results show that the autonomic modulation of HR in response to acute stress induced by hemorrhage and shock was severely impaired (Table 3), as already reported in other studies (7). Interestingly, this condi-tion is not relieved after administracondi-tion of fluids and vasopres-sors but only after reinfusion of shed blood.
HRV is assumed to be mostly dependent on the parasympa-thetic outflow to the heart; moreover, the recovery of barore-flex functionality, which followed the same trend as HRV during the experiment, has also been associated with an in-creased vagal activity in several pathologies (44). Thus we could suggest a vagal driver of effective resuscitation (61). Furthermore, an extensive literature has recently pointed to the central role of the vagus nerve as therapeutic target: direct vagus nerve stimulation has been proven to be beneficial in several diseases, including hemorrhage and shock (8, 26).
The lack of a recovery in the ANS control after resuscitation with fluid and vasopressor could be explained by the fact that the massive fluid infusion produced a reduction in the arterial blood oxygen content and, consequently, in the delivery of oxygen to peripheral tissues. Indeed, the hematocrit was sig-nificantly reduced and blood lactate still high at T3 (Table 1), supporting the notion of an ongoing mismatch between whole body oxygen consumption and oxygen delivery. Furthermore, the time window between T2 and T3 may be too short to obtain a complete resolution of the oxygen debt. Finally, the volume expansion offered by fluid infusion is limited because of redistribution of fluids in the interstitium and excretion in urine that usually occur soon after the beginning of fluid resuscita-tion (36).
After the transfusion of the shed blood we observed a complete restoration of HR and BP variability, lactate clear-ance, and hemodynamics to near-baseline values. Probably the increase in hematocrit and arterial oxygen content was
effec-Ratio of LF power of DAP components over LF power DAP
T1 T2 T3 T4 0 10 20 30 40 50 60 70 80 90 100 % DAPsap DAPrr DAPrap #
Fig. 2. Ratio between low-frequency (LF) absolute power of each predicted component and LF abso-lute power of diastolic arterial pressure (DAP) at each time point for hemorrhagic shock animals. Column height is median value for the population; black bars indicate values of 25th and 75th percen-tiles. T1, baseline; T2, after development of shock; T3, after fluid and vasopressor resuscitation; T4, after blood reinfusion; SAP, systolic arterial pres-sure; RR, R-R interval.#P⬍0.05 vs. T1 (Friedman
test).
Table 5. Concentration values of metabolites significantly different in LV tissue between sham- and hemorrhagic shock-treated animals Shock Sham PC aa C34:4 0.7 (0.4, 0.8) 0.3 (0.2, 0.3) PC aa C36:4 11.9 (7.8, 17.9) 4.8 (3.2, 5.2) PC aa C36:5 2.6 (1.7, 3.4) 0.9 (0.7, 1.1) PC aa C38:4 1.8 (1.2, 2.3) 0.7 (0.4, 0.8) PC aa C38:6 1.8 (1.2, 2.3) 0.65 (0.57, 0.66) PC ae C38:0 0.3 (0.2, 0.4) 0.13 (0.1, 0.13) PC ae C42:3 0.08 (0.04, 0.09) 0.029 (0.028, 0.03) Arginine 11.7 (6.8, 14.3) 26.3 (24.4, 28.2) Isoleucine 6.5 (5.9, 9.1) 11.9 (11.7, 13.8) Ornithine 2.5 (1.8, 3.04) 4.4 (4.2, 5.3) SM C22:3 0.1 (0.09, 0.14) 0.07 (0.05, 0.07)
Values (inm) are medians (25th, 75th percentiles). LV, left ventricular; PC aa Cxx:x, phosphatidylcholine diacyl C xx:x; SM C22:3, sphingomyelin C 22:3.
tive in restoring tissue oxygenation. Another hypothesis, based on the study of hemodilution physiology, is that the restoration of systemic and microvascular conditions after hemorrhage followed by hypovolemic shock depends mostly on blood rheological properties rather than on maintenance of oxygen-carrying capacity. The rationale for this hypothesis originates from experimental studies in HS, showing that a threshold of blood/plasma viscosity is required to maintain microvascular perfusion and, in particular, functional capillary density (11). Cardiac Functionality and LV Tissue
The shock protocol produced a clear decrease in CO and MAP and a hypoxic condition as supported by a lactate increase above 8 mmol/l. LVEF, however, was preserved, with an increased cardiac contractility during shock. After fluid resuscitation (T3) LVEF returned to baseline value, but only after blood reinfusion (T4) did both CO and dP/dtmaxrecover
to values similar to baseline.
These results suggest that the shock insult did not impair cardiac contractility. The main reason for this result could be the short period of shock before initiation of treatments. In-deed, in our study shock was maintained up to 2 h after confirmation of lactate increase, while in previous experimen-tal studies of HS the onset of myocardial depression was usually observed between 2 and 5 h after insult (49, 55). In our study, shock was not sufficiently prolonged to significantly impair cardiac contractility and to induce acute heart failure.
Nevertheless, plasma hs-cTnT increased significantly in shocked animals, remained high after fluid resuscitation, and finally returned to baseline values after blood reinfusion. The severity and the kinetics of troponin release do not support the hypothesis of an acute coronary syndrome (1, 31); indeed, the peak plasma concentration observed in shock was only modestly increased. Probably such an increase in hs-cTnT is the result of a general ischemic sufferance of cardiomyocytes. The most plausi-ble hypothesis may consist in the mismatch between oxygen delivery and oxygen consumption, leading to a type II myocardial ischemia. In fact, during hemorrhage and resuscitation with fluids, several factors may determine decrease in myocardial oxygen delivery (hypotension, low CO, reduced diastolic time, reduced hematocrit following fluid resuscitation) and increase in myocar-dial oxygen consumption (extreme tachycardia, circulating cat-echolamines, both endogenous and administered as support, i.e., norepinephrine) (70).
Another possible explanation of the increase in hs-cTnT could be the mechanical stress on the LV wall in the condition of elevated myocardial contractility and low filling volume, which causes sarcomere disruption in a highly susceptible spot (i.e., “zonal lesion”) (35). Unfortunately, we did not investigate the presence of ischemic lesions in histological samples of the LV, so we cannot confirm this hypothesis.
As regards metabolomics findings, only a small subset of the measured metabolites were differently abundant in LV tissue between HS and sham treatment (Table 5). A disturbance in the composition of myocardial membrane PC species occurred. Indeed, shocked LV tissue presented a marked increase in PC species, containing long-chain polyunsaturated fatty acids, such as PCaaC34:4, PCaaC36:4, and PCaaC36:5, with further elongation/desaturation products. We can speculate that since long-chain polyunsaturated fatty acids reduce T cell activation
and dampen inflammation (12), their enhanced presence would help relieve serious inflammatory conditions.
Concomitantly, raised plasmalogen levels such as PCasC38:0 and PCec42:3, which act as endogenous antioxi-dants (9), may protect cardiomyocytes during hypoxia in shocked LV. Interestingly, plasmalogens, highly predominant in the sarcolemma and sarcoplasmic reticulum of myocardial cells (33), play an important role in regulating myocardial electrical excitability (72) and sodium/calcium exchange in cardiac sarcolemmal preparations (30).
Together these findings converge toward a plausible adap-tation of the LV metabolic asset to cope with the insult. Such change in the metabolic asset might also be viewed as a key mechanism for either membrane structural rearrangement or damage to cardiomyocytes (45) and might directly or indirectly contribute to the production of electrophysiological abnormal-ities and arrhythmogenesis.
Moreover, shocked LV tissue presented a dysregulated ar-ginine metabolism, characterized by reduced arar-ginine and ornithine levels, thus suggesting a possible imbalance of nitric oxide (NO) formation. In heart, alterations of the arginine-NO pathway have been reported in chronic heart failure (63). NO synthesis requires the presence of arginine inside the cells of responsive tissues. Although some cell types can synthesize arginine from ornithine or citrulline, cardiac myocytes cannot produce it, and thus cardiac muscle must import this amino acid from the circulation. Depletion of arginine leads to nitric oxide synthase uncoupling. Combination ofO2⫺with NO from enzymatic or nonenzymatic sources will result in the produc-tion of peroxynitrite (ONOO⫺), an oxidizing agent associated with cell damage, decreased myocardial contractility, and con-gestive heart failure (56).
Limitations of the Study
The main limitation of this study is the small sample size. Moreover, the short time between T2 (shock), T3 (resuscita-tion), and T4 (blood reinfusion) could have attenuated the effects of shock in the physiological and metabolic responses. Finally, the unavailability of direct measures of autonomic outflow, such as muscle or cardiac sympathetic nerve activity, did not permit more than speculation about the compensatory mechanisms that are activated or suppressed during shock and resuscitation.
Conclusions
The results of this study suggest that BP variability, HRV, and baroreflex trends can be valuable tools to evaluate the severity of HS and they may represent a more useful end point for resuscitation, in combination with standard measurements such as mean values and biological measurements. In fact, they can add important insights into the recovery of the autonomic mechanisms of BP and HR regulation, which are fundamental for the recovery of organ dysfunction in shocked subjects. In this study, for example, resuscitation with fluid and vasopres-sor was effective in restoring circulating volume, CO, and mean BP, but indexes of autonomic functionality revealed that ANS control was not fully recovered. Interestingly, the high concentrations of cardiac troponin and a dysregulated metab-olism in the LV tissue after resuscitation are signs of a stress
condition induced by shock not resolved by the resuscitation maneuver.
GRANTS
This study was supported by the European Union FP7 Health Programme, ShockOmics Project, Grant No. 602706.
DISCLOSURES
No conflicts of interest, financial or otherwise, are declared by the authors. AUTHOR CONTRIBUTIONS
G. Baselli and M.F. conceived and designed research; G. Babini and G.R. performed experiments; M.C., R.P., L.B., and M.F. analyzed data; M.C., G. Babini, G.R., R.P., and M.F. interpreted results of experiments; M.C. prepared figures; M.C. drafted manuscript; M.C., G. Babini, G.R., R.P., and M.F. edited and revised manuscript; M.C., G. Babini, G. Baselli, G.R., R.P., L.B., and M.F. approved final version of manuscript.
REFERENCES
1. Agewall S, Giannitsis E, Jernberg T, Katus H.Troponin elevation in coronary vs. non-coronary disease. Eur Heart J 32: 404 –411, 2011. doi:10.1093/eurheartj/ehq456.
2. Aletti F, Ferrario M, Xu D, Greaves DK, Shoemaker JK, Arbeille P, Baselli G, Hughson RL.Short-term variability of blood pressure: effects of lower-body negative pressure and long-duration bed rest.Am J Physiol Regul Integr Comp Physiol 303: R77–R85, 2012. doi:10.1152/ajpregu. 00050.2012.
3. Barbee RW, Reynolds PS, Ward KR.Assessing shock resuscitation strategies by oxygen debt repayment.Shock33: 113–122, 2010. doi:10. 1097/SHK.0b013e3181b8569d.
4. Barbieri R, Parati G, Saul JP.Closed- versus open-loop assessment of heart rate baroreflex.IEEE Eng Med Biol Mag20: 33–42, 2001. doi:10. 1109/51.917722.
5. Baselli G, Porta A, Rimoldi O, Pagani M, Cerutti S.Spectral decom-position in multichannel recordings based on multivariate parametric identification. IEEE Trans Biomed Eng44: 1092–1101, 1997. doi:10. 1109/10.641336.
6. Batchinsky AI, Cooke WH, Kuusela TA, Jordan BS, Wang JJ, Cancio LC.Sympathetic nerve activity and heart rate variability during severe hemorrhagic shock in sheep.Auton Neurosci136: 43–51, 2007. doi:10. 1016/j.autneu.2007.03.004.
7. Batchinsky AI, Cooke WH, Kuusela T, Cancio LC.Loss of complexity characterizes the heart rate response to experimental hemorrhagic shock in swine. Crit Care Med 35: 519 –525, 2007. doi:10.1097/01.CCM. 0000254065.44990.77.
8. Borovikova LV, Ivanova S, Zhang M, Yang H, Botchkina GI, Watkins LR, Wang H, Abumrad N, Eaton JW, Tracey KJ. Vagus nerve stimulation attenuates the systemic inflammatory response to endotoxin. Nature405: 458 –462, 2000. doi:10.1038/35013070.
9. Brites P, Waterham HR, Wanders RJ.Functions and biosynthesis of plasmalogens in health and disease.Biochim Biophys Acta1636: 219 – 231, 2004. doi:10.1016/j.bbalip.2003.12.010.
10. Brunelli L, Caiola E, Marabese M, Broggini M, Pastorelli R. Compar-ative metabolomics profiling of isogenic KRAS wild type and mutant NSCLC cells in vitro and in vivo.Sci Rep6: 28398, 2016. doi:10.1038/ srep28398.
11. Cabrales P, Tsai AG, Intaglietta M.Is resuscitation from hemorrhagic shock limited by blood oxygen-carrying capacity or blood viscosity? Shock27: 380 –389, 2007. doi:10.1097/01.shk.0000239782.71516.ba. 12. Calder PC, Bevan SJ, Newsholme EA.The inhibition of T-lymphocyte
proliferation by fatty acids is via an eicosanoid-independent mechanism. Immunology75: 108 –115, 1992.
13. Cambiaghi A, Pinto BB, Brunelli L, Falcetta F, Aletti F, Bendjelid K, Pastorelli R, Ferrario M. Characterization of a metabolomic profile associated with responsiveness to therapy in the acute phase of septic shock.Sci Rep7: 9748, 2017. doi:10.1038/s41598-017-09619-x. 14. Cannon JW.Hemorrhagic shock.N Engl J Med378: 370 –379, 2018.
doi:10.1056/NEJMra1705649.
15. Chatpun S, Cabrales P.Cardiac systolic function recovery after hemor-rhage determines survivability during shock.J Trauma70: 787–793, 2011. doi:10.1097/TA.0b013e3181e7954f.
16. Converse RL Jr, Jacobsen TN, Jost CM, Toto RD, Grayburn PA, Obregon TM, Fouad-Tarazi F, Victor RG.Paradoxical withdrawal of reflex vasoconstriction as a cause of hemodialysis-induced hypotension.J Clin Invest90: 1657–1665, 1992. doi:10.1172/JCI116037.
17. Convertino VA, Sather TM.Vasoactive neuroendocrine responses asso-ciated with tolerance to lower body negative pressure in humans. Clin Physiol20: 177–184, 2000. doi:10.1046/j.1365-2281.2000.00244.x. 18. Convertino VA, Rickards CA, Ryan KL.Autonomic mechanisms
as-sociated with heart rate and vasoconstrictor reserves.Clin Auton Res22: 123–130, 2012. doi:10.1007/s10286-011-0151-5.
19. Convertino VA, Reister CA. Effect of G-suit protection on carotid-cardiac baroreflex function.Aviat Space Environ Med71: 31–36, 2000. 20. Convertino VA, Rickards CA, Ryan KL. Responses of sympathetic
nerve activity to presyncope: new insights about mechanisms of fainting. J Gravit Physiol17: 27–30, 2010.
21. Convertino VA, Ryan KL, Rickards CA, Salinas J, McManus JG, Cooke WH, Holcomb JB.Physiological and medical monitoring for en route care of combat casualties.J Trauma64,Suppl: S342–S353, 2008. doi:10.1097/TA.0b013e31816c82f4.
22. Convertino VA, Ludwig DA, Cooke WH.Stroke volume and sympa-thetic responses to lower-body negative pressure reveal new insight into circulatory shock in humans.Auton Neurosci111: 127–134, 2004. doi:
10.1016/j.autneu.2004.02.007.
23. Cooke WH, Convertino VA. Heart rate variability and spontaneous baroreflex sequences: implications for autonomic monitoring during hem-orrhage.J Trauma58: 798 –805, 2005. doi:10.1097/01.TA.0000151345. 16338.FD.
24. Cooke WH, Rickards CA, Ryan KL, Kuusela TA, Convertino VA. Muscle sympathetic nerve activity during intense lower body negative pressure to presyncope in humans. J Physiol 587: 4987–4999, 2009. doi:10.1113/jphysiol.2009.177352.
25. Cooke WH, Ryan KL, Convertino VA.Lower body negative pressure as a model to study progression to acute hemorrhagic shock in humans.J Appl Physiol (1985) 96: 1249 –1261, 2004. doi:10.1152/japplphysiol. 01155.2003.
26. Czura CJ, Schultz A, Kaipel M, Khadem A, Huston JM, Pavlov VA, Redl H, Tracey KJ. Vagus nerve stimulation regulates hemostasis in swine.Shock33: 608 –613, 2010. doi:10.1097/SHK.0b013e3181cc0183. 27. Eastridge BJ, Hardin M, Cantrell J, Oetjen-Gerdes L, Zubko T,
Mallak C, Wade CE, Simmons J, Mace J, Mabry R, Bolenbaucher R, Blackbourne LH. Died of wounds on the battlefield: causation and implications for improving combat casualty care. J Trauma71, Suppl: S4 –S8, 2011. doi:10.1097/TA.0b013e318221147b.
28. Faris IB, Jamieson GG, Ludbrook J.Effects of acute changes in blood volume on the carotid sinus baroreceptor reflex in conscious rabbits.J Physiol337: 563–573, 1983. doi:10.1113/jphysiol.1983.sp014642. 29. Ferrario M, Cambiaghi A, Brunelli L, Giordano S, Caironi P,
Guat-teri L, Raimondi F, Gattinoni L, Latini R, Masson S, Ristagno G, Pastorelli R.Mortality prediction in patients with severe septic shock: a pilot study using a target metabolomics approach.Sci Rep6: 20391, 2016. doi:10.1038/srep20391.
30. Ford DA, Hale CC.Plasmalogen and anionic phospholipid dependence of the cardiac sarcolemmal sodium-calcium exchanger. FEBS Lett 394: 99 –102, 1996. doi:10.1016/0014-5793(96)00930-1.
31. Giannitsis E, Katus HA.Cardiac troponin level elevations not related to acute coronary syndromes.Nat Rev Cardiol10: 623–634, 2013. doi:10. 1038/nrcardio.2013.129.
32. Granger CW. Economic processes involving feedback.Inf Control6: 28 –48, 1963. doi:10.1016/S0019-9958(63)90092-5.
33. Gross RW. Identification of plasmalogen as the major phospholipid constituent of cardiac sarcoplasmic reticulum. Biochemistry 24: 1662– 1668, 1985. doi:10.1021/bi00328a014.
35. Hackel DB, Ratliff NB, Mikat E. The heart in shock. Circ Res 35: 805–811, 1974. doi:10.1161/01.RES.35.6.805.
36. Hahn RG, Lyons G. The half-life of infusion fluids: an educational review. Eur J Anaesthesiol 33: 475–482, 2016. doi:10.1097/EJA. 0000000000000436.
37. Head GA, McCarty R.Vagal and sympathetic components of the heart rate range and gain of the baroreceptor-heart rate reflex in conscious rats. J Auton Nerv Syst 21: 203–213, 1987. doi: 10.1016/0165-1838(87)90023-3.
38. Hess JR, Brohi K, Dutton RP, Hauser CJ, Holcomb JB, Kluger Y, Mackway-Jones K, Parr MJ, Rizoli SB, Yukioka T, Hoyt DB, Bouillon
B.The coagulopathy of trauma: a review of mechanisms.J Trauma65: 748 –754, 2008. doi:10.1097/TA.0b013e3181877a9c.
39. Ichinose M, Saito M, Fujii N, Kondo N, Nishiyasu T.Modulation of the control of muscle sympathetic nerve activity during severe orthostatic stress.J Physiol576: 947–958, 2006. doi:10.1113/jphysiol.2006.117507. 40. Jacobs MC, Goldstein DS, Willemsen JJ, Smits P, Thien T, Dionne RA, Lenders JW.Neurohumoral antecedents of vasodepressor reactions. Eur J Clin Invest 25: 754 –761, 1995. doi:10.1111/j.1365-2362.1995. tb01954.x.
41. Koyama S, Aibiki M, Kanai K, Fujita T, Miyakawa K.Role of central nervous system in renal nerve activity during prolonged hemorrhagic shock in dogs.Am J Physiol Regul Integr Comp Physiol254: R761–R769, 1988. doi:10.1152/ajpregu.1988.254.5.R761.
42. Laitio TT, Mäkikallio TH, Huikuri HV, Kentala ES, Uotila P, Jalonen JR, Helenius H, Hartiala J, Yli-Mäyry S, Scheinin H.Relation of heart rate dynamics to the occurrence of myocardial ischemia after coronary artery bypass grafting.Am J Cardiol89: 1176 –1181, 2002. doi:10.1016/ S0002-9149(02)02300-7.
43. Lake DE.Improved entropy rate estimation in physiological data.Conf Proc IEEE Eng Med Biol Soc2011: 1463–1466, 2011.
44. Lavanga M, Baselli G, Fumagalli F, Ristagno G, Ferrario M. The possible role of the vagal nervous system in the recovery of the blood pressure control after cardiac arrest: a porcine model study.Physiol Meas 38: 63–76, 2017. doi:10.1088/1361-6579/38/1/63.
45. Leskova GF, Kryzhanovsky GN.Changes in phospholipid composition of cardiomyocyte plasma membranes during hemorrhagic shock.Bull Exp Biol Med151: 284 –287, 2011. doi:10.1007/s10517-011-1310-3. 46. Lipsitz LA, Goldberger AL.Loss of “complexity” and aging. Potential
applications of fractals and chaos theory to senescence. JAMA 267: 1806 –1809, 1992. doi:10.1001/jama.1992.03480130122036.
47. Ludbrook J, Faris IB, Jamieson GG.Blood volume and the carotid baroreceptor reflex in conscious rabbits. Clin Sci (Lond) 61, Suppl 7: 173s–175s, 1981. doi:10.1042/cs061173s.
48. Mäkikallio AM, Mäkikallio TH, Korpelainen JT, Sotaniemi KA, Huikuri HV, Myllylä VV. Heart rate dynamics predict poststroke mortality. Neurology 62: 1822–1826, 2004. doi:10.1212/01.WNL. 0000125190.10967.D5.
48a.Malik M, Bigger JT, Camm AJ, Kleiger RE, Malliani A, Moss AJ, Schwartz PJ; Task Force of the European Society of Cardiology and the North American Society of Pacing and Electrophysiology.Heart rate variability. Standards of measurement, physiological interpretation, and clinical use. Eur Heart J 17: 354 –381, 1996. doi:10.1093/ oxfordjournals.eurheartj.a014868.
49. Meng X, Ao L, Song Y, Raeburn CD, Fullerton DA, Harken AH. Signaling for myocardial depression in hemorrhagic shock: roles of Toll-like receptor 4 and p55 TNF-alpha receptor. Am J Physiol Regul Integr Comp Physiol288: R600 –R606, 2005. doi:10.1152/ajpregu.00182. 2004.
50. Moulton SL, Mulligan J, Grudic GZ, Convertino VA. Running on empty? The compensatory reserve index.J Trauma Acute Care Surg75: 1053–1059, 2013. doi:10.1097/TA.0b013e3182aa811a.
51. Mukkamala R, Toska K, Cohen RJ.Noninvasive identification of the total peripheral resistance baroreflex.Am J Physiol Heart Circ Physiol 284: H947–H959, 2003. doi:10.1152/ajpheart.00532.2002.
52. Pacagnella RC, Souza JP, Durocher J, Perel P, Blum J, Winikoff B, Gülmezoglu AM.A systematic review of the relationship between blood loss and clinical signs.PLoS One8: e57594, 2013. [Erratum inPLoS One 8: 10.1371/annotation/4db90e4b-ae29-4931-9049-3ef5e5c9eeee, 2013.] doi:10.1371/journal.pone.0057594.
53. Perrott MH, Cohen RJ.An efficient approach to ARMA modeling of biological systems with multiple inputs and delays.IEEE Trans Biomed Eng43: 1–14, 1996. doi:10.1109/10.477696.
54. Porta A, Furlan R, Rimoldi O, Pagani M, Malliani A, van de Borne P. Quantifying the strength of the linear causal coupling in closed loop interacting cardiovascular variability signals.Biol Cybern86: 241–251, 2002. doi:10.1007/s00422-001-0292-z.
55. Radisic M, Yang L, Boublik J, Cohen RJ, Langer R, Freed LE, Vunjak-Novakovic G.Medium perfusion enables engineering of compact and contractile cardiac tissue. Am J Physiol Heart Circ Physiol 286: H507–H516, 2004. doi:10.1152/ajpheart.00171.2003.
56. Ramachandran J, Peluffo RD.Threshold levels of extracellular l-argi-nine that trigger NOS-mediated ROS/RNS production in cardiac ventric-ular myocytes.Am J Physiol Cell Physiol312: C144 –C154, 2017. doi:
10.1152/ajpcell.00150.2016.
57. Randall WC, Kroeker T, Hotmire K, Burkholder T, Huprich S, Firth K. Baroreflex responses to the stress of severe hemorrhage in the rat. Integr Physiol Behav Sci27: 197–208, 1992. doi:10.1007/BF02690892. 58. Rixen D, Raum M, Holzgraefe B, Sauerland S, Nagelschmidt M,
Neugebauer EA; Shock and Trauma Study Group.A pig hemorrhagic shock model: oxygen debt and metabolic acidemia as indicators of severity. Shock16: 239 –244, 2001. doi: 10.1097/00024382-200116030-00012.
59. Rixen D, Siegel JH. Bench-to-bedside review: oxygen debt and its metabolic correlates as quantifiers of the severity of hemorrhagic and post-traumatic shock.Crit Care9: 441–453, 2005. doi:10.1186/cc3526. 60. Ryan KL, Rickards CA, Hinojosa-Laborde C, Cooke WH, Convertino
VA. Sympathetic responses to central hypovolemia: new insights from microneurographic recordings.Front Physiol3: 110, 2012. doi:10.3389/ fphys.2012.00110.
61. Salomão E Jr, Otsuki DA, Correa AL, Fantoni DT, dos Santos F, Irigoyen MC, Auler JO Jr.Heart rate variability analysis in an experi-mental model of hemorrhagic shock and resuscitation in pigs.PLoS One 10: e0134387, 2015. doi:10.1371/journal.pone.0134387.
62. Schiller AM, Howard JT, Convertino VA.The physiology of blood loss and shock: new insights from a human laboratory model of hemorrhage.Exp Biol Med (Maywood)242: 874 –883, 2017. doi:10. 1177/1535370217694099.
63. Shao Z, Wang Z, Shrestha K, Thakur A, Borowski AG, Sweet W, Thomas JD, Moravec CS, Hazen SL, Tang WH.Pulmonary hyperten-sion associated with advanced systolic heart failure: dysregulated arginine metabolism and importance of compensatory dimethylarginine dimethyl-aminohydrolase-1.J Am Coll Cardiol59: 1150 –1158, 2012. doi:10.1016/ j.jacc.2011.12.022.
64. Skoog P, Månsson J, Thorén P.Changes in renal sympathetic outflow during hypotensive haemorrhage in rats.Acta Physiol Scand125: 655– 660, 1985. doi:10.1111/j.1748-1716.1985.tb07768.x.
65. Stauss HM, Anderson EA, Haynes WG, Kregel KC. Frequency re-sponse characteristics of sympathetically mediated vasomotor waves in humans.Am J Physiol Heart Circ Physiol274: H1277–H1283, 1998. 66. Stauss HM.Identification of blood pressure control mechanisms by power
spectral analysis.Clin Exp Pharmacol Physiol34: 362–368, 2007. doi:
10.1111/j.1440-1681.2007.04588.x.
67. Stewart RM, Myers JG, Dent DL, Ermis P, Gray GA, Villarreal R, Blow O, Woods B, McFarland M, Garavaglia J, Root HD, Pruitt BA Jr.Seven hundred fifty-three consecutive deaths in a level I trauma center: the argument for injury prevention.J Trauma54: 66 –71, 2003. doi:10. 1097/00005373-200301000-00009.
68. Sun JX, Reisner AT, Mark RG.A signal abnormality index for arterial blood pressure waveforms.Comput Cardiol33: 13–16, 2006.
69. Thrasher TN.Baroreceptor regulation of vasopressin and renin secretion: low-pressure versus high-pressure receptors.Front Neuroendocrinol15: 157–196, 1994. doi:10.1006/frne.1994.1007.
70. Thygesen K, Alpert JS, Jaffe AS, Simoons ML, Chaitman BR, White HD; Task Force for the Universal Definition of Myocardial Infarction. Third universal definition of myocardial infarction.Nat Rev Cardiol9: 620 –633, 2012. doi:10.1038/nrcardio.2012.122.
71. Wessel N, Voss A, Malberg H, Ziehmann C, Voss HU, Schirdewan A, Meyerfeldt U, Kurths J.Nonlinear analysis of complex phenomena in cardiological data. Herzschrittmacherther Elektrophysiol 11: 159 –173, 2000. doi:10.1007/s003990070035.
72. Zeng Y, Han X, Gross RW.Phospholipid subclass specific alterations in the passive ion permeability of membrane bilayers: separation of enthalpic and entropic contributions to transbilayer ion flux. Biochemistry 37: 2346 –2355, 1998. doi:10.1021/bi9725172.
73. Zöllei E, Paprika D, Makra P, Gingl Z, Vezendi K, Rudas L.Human autonomic responses to blood donation.Auton Neurosci110: 114 –120, 2004. doi:10.1016/j.autneu.2003.10.003.
74. Zong W, Heldt T, Moody GB, Mark RG.An open-source algorithm to detect onset of arterial blood pressure pulses.Comput Cardiol, 30: 259 – 262, 2003.