For Peer Review Only
Malware Detection in Cloud Computing Infrastructures
Journal: Transactions on Dependable and Secure Computing
Manuscript ID: TDSC-2014-10-0262.R1
Manuscript Type: SI-Cyber Crime
Keywords:
C.2.0.f Network-level security and protection < C.2.0 General < C.2 Communication/Networking and Information Technology < C Computer Systems Organization, C.4.b Fault tolerance < C.4 Performance of Systems < C Computer Systems Organization, C.5.m Miscellaneous < C.5 Computer System Implementation < C Computer Systems Organization, I.2.11.d Multiagent systems < I.2.11 Distributed Artificial Intelligence < I.2 Artificial Intelligence < I Computing Methodologies, I.5.1.e Statistical < I.5.1 Models < I.5 Pattern Recognition < I Computing Methodologies, I.5.5.b Real-time systems < I.5.5 Implementation < I.5 Pattern Recognition < I Computing Methodologies
For Peer Review Only
To: Sonal Parik
Administrator for the IEEE Transactions on Dependable and Secure Computing
Title: Malware Detection in Cloud Computing Infrastructures
We would like to thank you for considering our paper for publication in the IEEE Transactions on
Dependable and Secure Computing and appreciate your sincere and honest reviews of our original
submission. Following your comments we have carefully considered each issue in order to improve
the standard of the paper. We hope that you find our new version addresses all of the comments to
your satisfaction.
Reviewer 1
Comment:
The paper addresses a very relevant topic in the area of cloud infrastructures. Recognizing and recovering infected VMs is a very important task for operators of cloud infrastructures to maintain a safe and secure service, as well as to save resource stealing, e.g., via botnets.The approach using one-class classification is sound and reasonable. Novelty detection can help to recognize newly emerging threats. There are, however, many different anomaly detection approaches. The authors chose SVM, but did not justify their choice. For advantages and disadvantages of other approaches see "Chandola et al., 'Anomaly detection: A survey,' Journal ACM Computing Surveys (CSUR), 2009".
Response:
We recognise that certain background was lacking in the previous version and have
included further discussion or related work and references, including the work by Chandola et al.
We have also framed our motivation better by referencing sources that have similar goals in the
same problem space, but which provide different solutions. These can be found in the re-drafted
Background & Related Work section (section 2). In addition, we justify the use of one-class SVM
over traditional two-class SVM and any other types of supervised two-class and multi-class ML
algorithms (e.g. Bayesian Networks), due to its ability of avoiding misclassifications caused by the
data imbalance that could exist in the training phase. In particular, we emphasize this aspect in the
last paragraph of section 2.3.
Comment:
The architecture depicted in Figure 3 embodies four elements and their flow of information: COE, SRE, SAE, NAE. The evaluation section focuses on the SAE which applies the SVM to features generated out of VM properties. The results are good and it seems probable that also other malware than the tested specimen (Kelihos, Zeus) can be recognized using the SVM. However, I got the impression that the other three elements are not as elaborate as the SAE.The NAE looks at the network traffic and is able to recognize DoS attacks. What would be required to recognize C&C traffic from normal traffic?
The SRE is responsible for recovery and remediation, but this functionality is not validated during the experiments.
The COE should integrate information from other peers in the recognition, i.e., to provide trend information of the cloud to improve the recognition of
individual SAE and NAE instances. How is this information integrated in the recognition process? 2 3 4 5 6 7 8 9 10 11 12 13 14 15 16 17 18 19 20 21 22 23 24 25 26 27 28 29 30 31 32 33 34 35 36 37 38 39 40 41 42 43 44 45 46 47 48 49 50 51 52 53 54 55 56 57 58 59 60
For Peer Review Only
Response:
Our paper focuses on the SAE, its design, and the methods it uses within the overall
context of the architecture. The architecture and its components have been introduced to give a
better overall picture of our approach. However, a detailed discussion of the architecture and its
elements is out of scope of this paper. Further information on this can be found in [4]. Since we
also take a bottom up approach in detailing the elements of our architecture the main focus of our
work at present is the SAE and NAE. While in this paper we concentrate on the SAE, work related
to the NAE has been published in more detail in [37] and [38]. In order to get the right balance and
avoid the impression that the architecture would be a major topic of this paper we have shortened
the discussion and integrated it within the background section. We have also included some
supplementary background on our other work concerning Ensemble Empirical Mode
Decomposition (E-EMD) in order to address the issue of the NAE recognising C&C traffic and the
usage of joint datasets.
Comment:
A very controversial finding of the paper is presented in Section 6.7: "[..] overall detection is less effective when system and network data are analyzed together [..]". My guess would have been the opposite. A betterapproach is suggested in the last paragraph of this section, but it has not been validated and, therefore, it remains an assumption. Making this circumstance more clearly would improve the paper's contribution significantly.
Response:
While we do agree that the result is surprising further consideration leads us to believe
that this is due to a combination of the use of the Support Vector Machine (SVM) algorithm, the
kind of network features considered and the fact that the malware itself does not show major
communication anomalies. Hence the use of additional features representing traffic can have the
effect of obscuring the more prominent systems anomalies. We support this with the following
addition to section 5.7:
“... this outcome also indicates that a joint dataset may not be useful in general due to the explicit algorithmic
formulation of one-class SVMs. As we show in our other study in [8], the joint dataset was appropriate for use with the Empirical Mode Decomposition (EMD) algorithm, which performed well under the same constraints.”
Comment:
The research field of Security information and event management (SIEM) is working in a related direction, but focusing more on distributed systems. Maybe there are some relevant connections to topic of this paper, i.e., cloud infrastructures.Response:
We have strengthened the background discussion within the paper in order to provide a
better context and supported this through the selection of appropriate references that are relevant in
the context of cloud computing infrastructures. These can mainly be found in the aforementioned
Background & Related Work section.
Comment:
It would also be interesting to learn what are the features and how does the feature extraction process work? This is very relevant information. The description of the SVM is very high level and similar to what is found in any textbook on machine learning.Response:
We agree with the comment that the explanation of the features used in our experiments
was insufficient. As such, we have included them in the form of a bulleted list in section 3.1 and
have clarified the derived meta-features by adding the following:
“... the raw features are per process, which is not useful if we are to consider each sample, or snapshot, as a single 1 2 3 4 5 6 7 8 9 10 11 12 13 14 15 16 17 18 19 20 21 22 23 24 25 26 27 28 29 30 31 32 33 34 35 36 37 38 39 40 41 42 43 44 45 46 47 48 49 50 51 52 53 54 55 56 57 58 59 60
For Peer Review Only
feature vector. Therefore a subsequent step is dedicated to building statistical meta-features such as the mean variance and standard deviation of each feature across all processes.”
Summarizing, the paper goes in the right direction and the authors have produced some impressive results. It is, however, rather a milestone towards the cloud resilience architecture than a final description thereof.
We would like to thank the reviewer for their time in reviewing our paper and providing helpful and
constructive comments.
Reviewer 2
The authors of this paper propose a resilience architecture for cloud computing infrastructures. This architecture includes anomaly detection, remediation and coordination elements. The authors present this overall architecture in the paper and then focus of one of its detection elements: the SAE (System Analysis Engine). The authors detail the design of this element, implementing a novelty detection algorithm (one-class SVM algorithm), able to detect unknown malware. The authors present how they were able to tune the one-class SVM algorithm in order to improve the efficiency of their detector. Finally, they describe a set of experiments on two different malwares.
Comment:
The main problem I have regarding this paper is the real contribution, which is not clearly announced by the authors. To my understanding, the real contribution is the tuning of the one-class SVM algorithm to obtain a efficient host intrusion detection system. The architecture in itself is described but does not seem to the topic of the paper as there are not details at allregarding the internals of the architecture (the details regarding the COE for instance). Moreover, this architecture in itself does not seem to be
particularly innovative. If the contribution is really this improvement of the one-class SVM, the paper has to be rewritten. The description of the algorithm, in section 4, is not self-contained at all.
Response:
As stated above, the architecture as been presented to better explain the context of the
work. We have also stressed the contribution of the research and our contributions throughout the
paper. The contribution we provide is an alternative to the current methods of malware detection in
cloud environments, including novel approaches and the current state of the art. The main aim is
not to evaluate or improve on the SVM algorithm, but rather apply it in a pragmatic way to the
domain of cloud computing and to highlight its benefits and weaknesses. In order to clarify this
point we have rewritten the background section (section 2) in order to better contrast our work with
that of others in this field. In parallel, we have emphasized that the purpose of the paper is not to
introduce a cloud resilience architecture (see the abstract and introduction) but rather present the
anomaly detection capabilities within two dedicated engines (SAE and NAE). Furthermore, we
indicate the efficiency of the particular one-class SVM formulation (and not the traditional
two-class as they have been broadly used in the literature), which to the best of our knowledge has not
been used in the past in the context of malware detection in the cloud. In addition, we justify its use
throughout section 2.3.
Comment:
I am not an IDS expert, and I am totally unable to understand the formula (1) (2), (3), not explained at all. Section 4.3, regarding the tuning of2 3 4 5 6 7 8 9 10 11 12 13 14 15 16 17 18 19 20 21 22 23 24 25 26 27 28 29 30 31 32 33 34 35 36 37 38 39 40 41 42 43 44 45 46 47 48 49 50 51 52 53 54 55 56 57 58 59 60
For Peer Review Only
the algorithm, is not understandable neither.If if correctly understood what the contribution is, the paper must be
rewritten, in my opinion, in a different way. The overall description of the architecture and the beginning of the paper may be shorten a little. It is never used after. Then section 4 should quickly introduce SVM algorithm, then one-class SVM, then the tuning, in such a way that it is possible to understand their contribution.
Response:
We have made the explanation more clear by reordering the concepts and by rewriting
each paragraph, which should help the reader to better understand what the research presented in
this paper is based on; however, as mentioned earlier, the focus of the paper is not on the algorithm
itself, but rather its application and, as such, the explanation also intends to provide context for the
variables nu and gamma in the explanation of our tuning procedure and in the results section
(sections 3.3 and 5 respectively).
Comment:
In section 2, I do not really see the point of section 2.2 about malware. There are some parts of this section that I do not understand (see detailed remarks) and I do not think this brings something important to the paper.Response:
This is a valid comment and we have rewritten this section to focus more on the subject
of detection methods. We have moved any discussion of the malware used in our experimentation to
the introduction and to the methodology section (sections 1 and 4 respectively), where we feel the
information is more relevant.
Comment:
Regarding the architecture in itself, as presented in section 3, it does not seem particularly original to my viewpoint. The deployment of CRMs on ingress routeur is not very clear for me. What are the differences between these CRMS and the CRMs deployed on nodes ?Response:
As explained above, the discussion about the architecture has been included to provide
more context about the research and related activities within our group. In order to make this more
clear we have shortened this discussion and made it part of section 2.4, which also includes the
following discussion:
“Network level CRMs operate in exactly the same manner as the CRMs deployed within the cloud, but are able to observe network traffic from a unique vantage point not available to the inner network. For example, a CRM deployed on an ingress/egress router (i.e. D in the figure) is able to observe traffic before it is firewalled, enabling it to
communicate valuable information back into the cloud. An ingress/egress CRM is also able to analyse the traffic from multiple nodes, allowing the presence of a botnet to be detected, communicated to each internal CRM, and thwarted by the SREs on each node.”
However, since the intention with the paper is not to explain the architecture in too much detail
(due to the fact that this information has already been made available through a prior publication)
we have attempted to keep explanations as succinct as possible.
Comment:
There are also some other issues regarding section 4. Section 4.1 is dedicated to the presentation of the offline training. But the information provided in this section is very short. The offline training is an important step in order to correctly calibrate the detection algorithm.Response:
We believe this point has been better addressed by information provided in section 3.3,
1 2 3 4 5 6 7 8 9 10 11 12 13 14 15 16 17 18 19 20 21 22 23 24 25 26 27 28 29 30 31 32 33 34 35 36 37 38 39 40 41 42 43 44 45 46 47 48 49 50 51 52 53 54 55 56 57 58 59 60
For Peer Review Only
which goes into detail about the specific method we use for algorithm tuning. In particular we
describe the incremental selection of the parameters nu and gamma in a pair of nested loops in
order to arrive at a decision function that can classify its own training data to a high degree of
acuracy.
Comment:
The authors talk about HTTP requests, websurfing, downloads and other user application activities ... There should be more information about that and a discussion. Is it representative of the normal operations on a VM in a cloud computing context ?Response:
The main reason for the inclusion of websurfing, downloads and other user application
activities in our background data was to induce an additional load on the system during training
(i.e. in addition to the webserver activity, which is ever present). We do however feel that the
inclusion of this information in the paper only serves to confuse the reader as it does not help in
understanding our results. As such, and based on information obtained from cloud operators and
other industrial partners within the IU-ATC project, we have replaced it with the following in
section 4.1:
“In order to generate some realistic background traffic we developed some custom scripts on other hosts within the same LAN that enabled the random generation of HTTP requests to the target server. The choice of HTTP for traffic generation is typical of many cloud servers that host web servers or related REST based applications. In addition, these types of server are among the most targeted by malware due to them being very public facing, and therefore require the most monitoring.”
This also serves to improve the motivation of the detection of malware in the realm of virtualised
servers.
Comment:
The time durations in section 4.4, regarding online detection, seem also very short. 10 minutes of normal traffic, is it enough ? The authors should justify these durations.Response:
The duration for our experiments has been carefully chosen after studying the behaviour
of the malware we use within our evolution. Contrary to an initial impression that the time intervals
might be short, our studies have indicated that the duration is appropriate to evaluate the
effectiveness of the detector since the execution times of the malware are much shorter and we are
able to detect their activities within the given observation time . We have included the following
argument to support our view:
“The experiment duration was chosen based on empirical experience of the behaviour of our chosen malware strains. Since detection is conducted in real-time it is necessary to have the experiment run uninterrupted. This places a constraint on the format of the experiment whereby the malware needs to be detectable for the duration of the anomalous period, with the only valid outcomes being TPs and FNs during this time. Through experimentation it was observed that the Zeus samples we obtained have a tendency to cease execution beyond 15 minutes; we do not, therefore, need to continue the experiment beyond this boundary. Moreover, we have found that 10 minutes of malware execution is more than sufficient to characterise the detection performance of the detector under the parameters of our experimentation.”
Comment:
Regarding the experimental resultats, it seems to show that thedetector performs very well but I think that these results should be discussed. The two malware chosen in this paper make a lot of modifications on the guest OS and thus, are easy to detect. They would also probably be easily detected by signatures. In order to prove the relevance of the approach proposed by the
2 3 4 5 6 7 8 9 10 11 12 13 14 15 16 17 18 19 20 21 22 23 24 25 26 27 28 29 30 31 32 33 34 35 36 37 38 39 40 41 42 43 44 45 46 47 48 49 50 51 52 53 54 55 56 57 58 59 60
For Peer Review Only
authors, I think they should have chosen some much more furtive malware, such a rootkit kernels for instance, in order to see if their detector is able to detect any sufficient deviation.
Response:
Signature based systems can only detect known threats. Hence, they cannot detect any
new threats or modifications of existing malware. Further, modifications that the malware samples
make to the system are subtle, at least in the case of Zeus, and could easily evade a malware
detector that executes in the same operating system as the sample. It is not the modifications that
the samples make, but rather the deviation from normal operation that they induce, that is being
detected by our method. Therefore the introduced method can detect malware activities that cannot
be detected through common signature based techniques. However, we certainly agree that further
work needs to be done, including experiments involving rootkit based malware samples.
Comment:
In section 5.1, some software are presented, that have to be installed on the infrastructure. The authors do not explain where these software must be installed (VM, hypervisor ? ). As the authors focus on IAAS architecture, it is difficult to imagine that such software must be installed on VM guests OS, which are completely under control of the client. So, are these software installed inside the hypervisor, on some control VMs or somewhere else ?Response:
Throughout the paper we have attempted to clarify our precise experimental set-up. We
have addressed this comment in particular by including the following in section 3.1:
“The data collection and analysis tools installed on each compute node in the described testbed include libVMIand Volatilityfor real-time Virtual Machine Introspection (VMI), and CAIDA's CoralReeffor packet capturing and network flow summarisation. Overall, the data acquisition, feature extraction and anomaly detection performed by both the SAE and NAE components of our resilience architecture are achieved through custom software that operates on VMs in real-time at the hypervisor level of the cloud node.”
We would like to thank the reviewer for their detailed and helpful comments.
Reviewer 3
Comment:
The paper is generally well-written and and well-organized. I also understand that implementations and evaluations require a lot of time and effort, and the evaluation in the paper seems to be quite thorough. But I had trouble discerning the intellectual/conceptual novelty in the paper, which I believe needs to come out a lot clearer. The problem with empirically evaluating an existing idea like SVM-learning in a new domain, and especially one related to security is that it is hard to say whether the evaluation has any degree of practical relevance given it is highly unclear how the adversary can game the system. Also the threat model does not appear to be very clearly stated. What the adversary can do against the system is something that needs to be addressed. Overall I see some merits in this approach, but they do not come out veryclearly.
Response:
We can see that a better discussion about the motivation and general framing of the
problem space could be strengthened. We have tried to address this together with the comments of
the other two reviewers, for instance by restructuring the background section and introducing
additional related work. Another key aspect to our work, that we have highlighted in the revision, is
that we evaluate an alternative to the two-class SVM algorithm and Bayesian Nets, which are both
prevalent in the literature. We show that one-class SVM has major advantages in the cloud space
1 2 3 4 5 6 7 8 9 10 11 12 13 14 15 16 17 18 19 20 21 22 23 24 25 26 27 28 29 30 31 32 33 34 35 36 37 38 39 40 41 42 43 44 45 46 47 48 49 50 51 52 53 54 55 56 57 58 59 60
For Peer Review Only
and exhibits high levels of accuracy for a relatively small amount of training data. We also show
that it is possible to conduct detection in two distinct domains at the same point in the
infrastructure and lay the foundation for future work on combined network/system analysis and
information dissemination throughout a cloud.
We would like to thank the reviewer for their kind words and constructive criticism of our work.
2 3 4 5 6 7 8 9 10 11 12 13 14 15 16 17 18 19 20 21 22 23 24 25 26 27 28 29 30 31 32 33 34 35 36 37 38 39 40 41 42 43 44 45 46 47 48 49 50 51 52 53 54 55 56 57 58 59 60
For Peer Review Only
Malware Detection in
Cloud Computing Infrastructures
Michael R. Watson, Noor-ul-hassan Shirazi, Angelos K. Marnerides, Andreas Mauthe and David Hutchison
Abstract—Cloud services are prominent within the private, public and commercial domains. Many of these services are expected to be always on and have a critical nature; therefore, security and resilience are increasingly important aspects. In order to remain resilient, a cloud needs to possess the ability to react not only to known threats, but also to new challenges that target cloud infrastructures. In this paper we introduce and discuss an online cloud anomaly detection approach, comprising dedicated detection components of our cloud resilience architecture. More specifically, we exhibit the applicability of novelty detection under the one-class support Vector Machine (SVM) formulation at the hypervisor level, through the utilisation of features gathered at the system and network levels of a cloud node. We demonstrate that our scheme can reach a high detection accuracy of over90%whilst detecting various types of malware and DoS attacks. Furthermore, we evaluate the merits of considering not only system-level data, but also network-level data depending on the attack type. Finally, the paper shows that our approach to detection using dedicated monitoring components per VM is particularly applicable to cloud scenarios and leads to a flexible detection system capable of detecting new malware strains with no prior knowledge of their functionality or their underlying instructions.
Index Terms—Security, resilience, invasive software, multi-agent systems, network-level security and protection.
✦
1
I
NTRODUCTIONC
LOUD datacenters are begining to be used for a range of always-on services across private, public and com-mercial domains. These need to be secure and resilient in the face of challenges that include cyber attacks as well as component failures and mis-configurations. However, clouds have characteristics and intrinsic internal operational structures that impair the use of traditional detection sys-tems. In particular, the range of beneficial properties offered by the cloud, such as service transparency and elasticity, introduce a number of vulnerabilities which are the outcome of its underlying virtualised nature. Moreover, an indirect problem lies with the cloud’s external dependency on IP networks, where their resilience and security has been ex-tensively studied, but nevertheless remains an issue [1].The approach taken in this paper relies on the principles and guidelines provided by an existing resilience frame-work [2]. The underlying assumption is that in the near fu-ture, cloud infrastructures will be increasingly subjected to novel attacks and other anomalies, for which conventional signature based detection systems will be insufficiently equipped and therefore ineffective. Hence, it is our goal to develop detection techniques that are specifically targeted at the cloud and integrate with the infrastructure itself in order to, not only detect, but also provide resilience through remediation.
At the infrastructure level we consider: the elements that make up a cloud datacentre, i.e. cloud nodes, which are hardware servers that run a hypervisor in order to host a number of Virtual Machines (VMs); and network infrastructure elements that provide the connectivity within the cloud and connectivity to external service users. A cloud service is provided through one or more interconnected VMs that offer access to the outside world. Cloud services
can be divided into three categories based on the amount of control retained by the cloud providers. Software as a Service (SaaS) retains the most control and allows customers to access software functionality on demand, but little else. Platform as a Service (PaaS) provides customers with a choice of execution environment, development tools, etc., but not the ability to administer their own Operating Sys-tem (OS). Infrastructure as a Service (IaaS) relinquishes the most control by providing customers with the ability to install and administer their own choice of OS and install and run anything on the provided virtualised hardware; as such, IaaS clouds present the most challenges in terms of maintaining a properly functioning system. Such a system would ideally be free from malware and from vulnerabilities that could lead to an attack. It is for this reason that we focus on this type of cloud since security measures applicable to IaaS clouds will also be relevant for other cloud types.
In order to increase the resilience of cloud infrastructures we have already defined a resilience architecture in our previous works [3], [4] that comprises anomaly detection, remediation and also coordination elements. However, this paper discusses two particular components within this ar-chitecture that deal with anomaly detection at the system and network level.
The elements presented here form the basis in which different detection techniques can be hosted and further allow the identification and attribution of anomalies. In this paper we discuss the detection of anomalies using a novelty detection approach that employs the one-class Support Vector Machine (SVM) algorithm and demonstrate the effectiveness of detection under different anomaly types. More specifically, we evaluate our approach using malware and Denial of Service (DoS) attacks as emulated within a controlled experimental testbed. The malware samples used are Kelihos and multiple variants of Zeus. We have selected
1 2 3 4 5 6 7 8 9 10 11 12 13 14 15 16 17 18 19 20 21 22 23 24 25 26 27 28 29 30 31 32 33 34 35 36 37 38 39 40 41 42 43 44 45 46 47 48 49 50 51 52 53 54 55 56 57 58 59 60
For Peer Review Only
they have been identified as posing recent and evolving threats for a range of Windows OS flavors that have already compromised more than 3.6 million machines worldwide between 2010 and 2014; mainly due to their varying and sophisticated evasion techniques, as well as their stealthy propagation1. Our contributions are as follows:
• We introduce an overall cloud resilience
architec-ture under the implementation of one-class Sup-port Vector Machines (SVMs) in the context of on-line anomaly detection in virtualized cloud environ-ments.
• The resulting experimental findings show that
anomalies can be effectively detected online, with minimal time cost for reasonably realistic data sam-ples per Virtual Machine (VM), using the one-class SVM approach, with an overall accuracy of greater than90%in most cases.
• Our work is the first to explicitly address the aspect
of malware detection in pragmatic cloud-oriented scenarios as performed by cloud providers, such as VM live-migration.
• We provide an online novelty detection
implementa-tion that allows the adaptive SVM-specific parameter estimation for providing better detection accuracy benefits.
• This work assesses the VM-based feature
selec-tion spectrum (i.e. system, network-based or joint datasets) with respect to the detection performance benefits on two distinct network-wise attacks (mal-ware and DDoS) under novelty detection.
The remainder of this paper is structured as follows: in Section 2 the relevant background is introduced as well as our cloud resilience architecture, into which the detection components we evaluate in this paper are to be placed. Section 3 is dedicated to describing the data and the method-ology used in this work. In Section 4 we provide infor-mation on our particular evaluation approach setup and a description of the malware samples we have used. Section 5 provides the results of the experimentation conducted in this work. Finally, Section 6 summarizes and concludes this paper.
2
B
ACKGROUND& R
ELATEDW
ORKThe intrinsic properties of virtualised infrastructures (such as elasticity, dynamic resource allocation, service co-hosting and migration) make clouds attractive as service platforms. Though, at the same time they create a new set of security challenges. These have to be understood in order to better protect such systems and make them more secure. A num-ber of studies have addressed aspects of cloud security from different viewpoints (e.g. the network, hypervisor, guest VM and Operating System (OS)) under various approaches de-rived either from traditional rule-based Intrusion Detection
1. The Kelihos malware was first detected in 2010 and has since been developed into new variants that perform a range of attacks such as phishing and spamming [5]. Zeus was first detected in 2010 [6], but since then there has been a plethora of new variants that even recently (July 2014) compromised millions of machines and gave rise to a botnet that could steal sensitive banking information [7].
paper presents a cloud security solution derived from a sub-domain of anomaly detection, viz. novelty detection. In this section we firstly review the challenges arising from the virtualisation embedded within cloud technologies and further discuss background and related work with respect to anomaly detection in cloud environments. We also present the architectural context, within which the research pre-sented in this paper is carried out.
2.1 Virtualisation & Cloud Technologies
In [3], [8], [9] the specific security threats and challenges introduced into clouds through the use of core virtualisation technologies are discussed. Despite the end-user benefits gained by virtualisation it also comes with a range of threats that include: exploits to security holes on virtual machines (e.g. rootkit attacks on virtual machines [10]); mutated cloud-specific Internet-based attacks that aim to compromise cloud networks (e.g. malware [11], [3]; and DDoS attacks on cloud services [11]). According to [12] blackhat hackers have already identified the potential of the cloud since the instantiation, maintenance and continued operation of botnets seems to be much more effective under a cloud paradigm.
In parallel, co-residence as a security concern has been explored in [10] and is the result of VMs belonging to different customers being hosted on the same cloud node. It was revealed that the outcome of co-residence is to en-able shared memory attacks that, at their most benign, are capable of leaking sensitive information, and at their most destructive are capable of taking control of the entire node. Moreover, the aspect of VM migration is also a possible enabler of malicious side effects in cases where infected VMs are migrated around the cloud to a number of nodes. The cause of migration could be as a result of the provider’s load balancing policy, but as an unwanted side-effect the result is to place malware in contact with a larger number of potential targets throughout the cloud infrastructure.
Additionally, automation is becoming an increasingly integral part of computer system configuration through the use of dedicated tools (e.g. Ansible2) or simply by
creat-ing new VMs from clones or snapshots. This results in a collection of servers, all with the same functionality, being configured in precisely the same way. Hence, vulnerabilities and threats are being repeatedly instantiated across large portions of the cloud and malware can more easily propa-gate and exploit said vulnerabilities.
2.2 Malware & Detection Methods
One of the biggest challenges within the development of resilient and secure cloud-oriented mechanisms is related to the adequate identification and detection of malware. This is due to the fact that, in the majority of cases, malware is the first point of initiation for large-scale Distributed Denial of Service (DDoS) attacks, phishing and email spamming [3], [8], mainly through the deployment of botware.
2. Ansible configuration management software: http://www.ansible. com/home 2 3 4 5 6 7 8 9 10 11 12 13 14 15 16 17 18 19 20 21 22 23 24 25 26 27 28 29 30 31 32 33 34 35 36 37 38 39 40 41 42 43 44 45 46 47 48 49 50 51 52 53 54 55 56 57 58 59 60
For Peer Review Only
Current methods of detecting attacks on cloud infras-tructures or the VMs resident within them do not suf-ficiently address cloud specific issues. Despite the huge efforts employed in past studies regarding the behaviour of certain types of malware in the Internet [13], [14], so far little has been done to tackle malware presence in clouds. In particular, the studies in [15], [16] aimed to adjust the perfor-mance of traditional Intrusion Detection Systems (IDS) un-der signature-based techniques that employ Deep Packet In-spection (DPI) on network packets. Moreover, work in [17], [18] studied system-related features on monitored VMs by employing Virtual Machine Introspection (VMI) methods in order to detect threats on a given VM’s Operating System (OS).
Nevertheless, despite the important lessons learned from these studies they do not develop an overall online detection strategy that considers real-time measurement samples from each VM. Further, these approaches are purely signature-based, and as such are not in a position to provide a robust scheme for any future threats posed by novel malware strains due to their simplistic rule-based nature.
Each solution to detection is performed in an isolated manner and neglects to consider the unique topology of the cloud, which is at its heart a network of intercon-nected nodes, each with their own isolated execution en-vironments. If a detection system is to perform effectively within a cloud it is required to possess the capability of communicating detected faults and challenges across the whole infrastructure, especially if it is to perform as part of a larger, autonomous and self-organising, cloud resilience system.
2.3 Anomaly Detection in Clouds
Anomaly detection has been an active research area for a number of years. Numerous techniques for different scenar-ios and application domains have been developed. Chan-dola et al. show in their survey [19] the prediction, detection and forecasting accuracy of anomaly detection in a number of disciplines, whereas the work in [20] thoroughly surveys the use of several anomaly detection schemes in the context of IP backbone networks. Within this paper the focus is on anomaly detection in the cloud.
A number of anomaly detection techniques [21], [22], [23], [24], [25], [26] aim to proactively and reactively detect cloud-specific threats, but due to their complex statistical measures they mostly lack scalability and often require prior knowledge, thus making them unsuitable for online detection in cloud infrastructures.
The work by Wang et al. [27] produced the EbAT system that allowed the online analysis of multiple metrics obtained from system-level components (e.g. CPU utilization on rack servers, memory utilization, read/write counts of the OS, etc.). The proposed system showed potential in the areas of detection accuracy and monitoring scalability, however it’s evaluation did not adequately emphasise pragmatic cloud scenarios.
In [28] an anomaly detection technique to detect intru-sions at different layers of the cloud was proposed. How-ever, the technique appears to lack the flexibility required by dynamic cloud environments. It is also not sufficiently
demonstrated how such techniques can be operationally applied. In [29] the authors propose a multi-level approach, which provides fast detection of anomalies discovered in the system logs of each guest OS. One of its disadvantageous is the apparent lack of scalability since it requires increasingly more resources under high system workload. Further, it is designed to classify text based log data, which may not manifest the effects of malware.
The work in [24] provided a novel prototype that en-abled an online spatio-temporal anomaly detection scheme in a cloud scenario. Thus, the authors were able to ini-tially formulate and further implement a wavelet-based multi-scale anomaly detection system. The system relies on measured cloud performance metrics (e.g. CPU utilization, memory) gathered by multiple components (e.g. hardware, software, system) within the examined institution-wide cloud environment. The resulting experimental outcomes were quite promising since the proposed approach reached a93.3%of sensitivity on detecting anomalous events with only just a6.1%of the reported events to be false alarms.
The only study that has some similarities to what we propose in this paper is the approach by Pannu et al. in [30]. In particular, the authors in [30] instrumented an online adaptive anomaly detection (AAD) framework that was able to detect failures through the analysis of execution and run-time metrics using the traditional two-class Support Vector Machine (SVM) algorithm. Under a real experimentation, over a 362-node cloud computing environment in a univer-sity campus, the produced results were extremely promising since they exhibited the efficiency of the proposed scheme, which reached an overall of over87%of anomaly detection sensitivity. However, the main issue raised by this study was that the formulation of the two-class SVM algorithm suffered from the data imbalance problem [31], which af-fected the training phase, and consequently led to several mis-classifications of newly tested anomalies. Moreover, in contrast with our work the proposed approach did not explicitly address the aspect of early attack detection, but rather was mainly aimed at various faults in the cloud infrastructure.
Therefore, apart from providing an online anomaly de-tection approach, our work is also aimed at confronting an algorithmic constraint that is inherited in most of the tradi-tional two-class on n-class Machine-Learning based tech-niques (e.g. two-class SVMs, Artificial Neural Networks, Bayesian Classifiers) when applied to cloud environments (e.g. [30], [32]); data imbalance. As indicated in [31], [33] a dataset is imbalanced if the classification labels are not approximately equally represented. In simple terms, the imbalanced nature of training datasets3 invoke high
clas-sification errors and problematic labelling of the training in-stances that naturally engage high rates of misclassification throughout the testing phase of n-classclassifiers (e.g. tra-ditional SVMs). Hence, in this work we are inspired by the findings in [31], where one-class SVMs perform much better than two-class SVMs, as well as Artificial Neural Networks (ANNs), in the context of classifying DSL-level faults. Here we employ them explicitly for the detection of anomalous
3. Having a tremendously large training dataset for DDoS attacks versus a comparatively small one for malware instances, for example
1 2 3 4 5 6 7 8 9 10 11 12 13 14 15 16 17 18 19 20 21 22 23 24 25 26 27 28 29 30 31 32 33 34 35 36 37 38 39 40 41 42 43 44 45 46 47 48 49 50 51 52 53 54 55 56 57 58 59 60
For Peer Review Only
2 3 4 5 6 7 8 9 10 11 12 13 14 15 16 17 18 19 20 21 22 23 24 25 26 27 28 29 30 31 32 33 34 35 36 37 38 39 40 41 42 43 44 45 46 47 48 49 50 51 52 53 54 55 56 57 58 59 60For Peer Review Only
1 2 3 4 5 6 7 8 9 10 11 12 13 14 15 16 17 18 19 20 21 22 23 24 25 26 27 28 29 30 31 32 33 34 35 36 37 38 39 40 41 42 43 44 45 46 47 48 49 50 51 52 53 54 55 56 57 58 59 60For Peer Review Only
known class, which in our case is the normal VM behaviour, and the other is the novel class, which represents any testing instances that are unknown to the classifier. If we let
x= (x1, x2, . . . , xn−1, xn)represent a feature vector, which
contains all of the VM-related features described earlier (section 3.1), then the decision functionf(x)takes the form:
f(x) =
N X
i=1
αik(x, xi)−ρ (1)
However, in order to achieve f(x) and attain the αi multipier over the kernel function k(x, xi) it is firstly re-quired to solve the optimisation problem in Equation 2 using Lagrange multipliers, as follows:
min w,ξi,ρ 1 2kwk2+νn1 Pn i=1ξn−ρ subject to: (w·φ(xi))≥ρ−ξi for alli= 1, . . . , n ξi≥0 for alli= 1, . . . , n (2)
The parameter ν is extremely critical and characterises the solution by setting an upper bound on the fraction of outliers, and a lower bound on the number of support vectors. Increasingνresults in a wider soft margin, meaning there is a higher probability that the training data will fall outside the normal frontier, thus identifying legitimate VM behaviour as anomalous in our case. With reference to Equation 1, the functionk(x, xi)denotes the kernel function and can be chosen to suit a particular problem. In our implementation we employed the Radial Basis Function (RBF) kernel function, which is defined as:
k(x, xi) = exp(−γkx−xik2) (3) The kernel parameterγis sometimes expressed as1/σ2and
a reduction inσresults in an decrease in the smoothness of the frontier between normal data and outliers. It is therefore possible to produce a decision function which approximates a nearest neighbour classifier by increasing the value of
γ. As we explain next, bothγ and ν parameters are quite critical and require some tuning in order to avoid missclas-sifications of abnormal behaviour to normal and vice versa.
3.3 SAE & NAE One-Class SVM Tuning
Prior to the training process, the SAE & NAE engines auto-matically transform the initial gathered dataset by scaling them towards a Gaussian distribution. This is due to a requirement of the RBF kernel that the data be centred on zero and have unit variance. Thus the tuning process embedded in the SAE and NAE removes the mean from each feature and divides the feature vector by the standard deviation. The training process subsequently involves pass-ing the scaled trainpass-ing dataset as an input to the one-class SVM algorithm, which produces a decision function that is able to classify new feature vectors.
In general, the training process is determined by four factors: the size and content of the training dataset and the two parameters ν and γ. The training dataset size is de-termined by the length of time over which VM monitoring is conducted, after which it is possible to select subsets of the available data resulting in a refinement of training data
determined by the behaviour of the processes in the VM and is not accurately controllable, hence the only influence that can be imposed on the data is by varying the applications and the loads on each of them. In contrast, the parameters
ν andγcan be finely controlled and are chosen at training time to alter the accuracy of the classifier with respect to the available training data.
The choice of algorithm parameters is not obviousa priori and a small change of ν or γ either way can result in a less accurate detector. However, by choosing the parameters based on how accurately the classifier classifies its own training dataset it is possible to optimise the detector for a particular server profile.
The process of parameter selection is conducted in an incremental manner by selecting the lowest reasonable val-ues forν andγand incrementing the values of first ν and thenγin a pair of nested loops12. The increment forγneed
not be as fine asν because, within our experimentation, we have found it to have much less influence on the accuracy of the detector. At each step the False Positive Rate (FPR) is calculated for the pair of parameter values according to the formula in Equation 4.
Overall, by conducting this iterative process we have found that once a minimum is reached there may be some parameter pairs that yield the same minimum, after which the FPR will rise again for all subsequent pairs of values. This is to be expected due to the fact that increasing both parameters past a certain point results in a frontier that fits too tightly to close neighbours in the training data and does not generalise well. Thus, a compromise needs to be reached between fitting the training data loosely with low values of the algorithm parameters, and being too restrictive with high values. Hence, with empirical experience of search times it is possible to stop the procedure long before the end of the exhaustive search and therefore reach an optimised set of parameters in reasonable time13.
3.4 SAE & NAE Online Detection Process
As described in the previous subsections, the one-class SVM classifier within our SAE and NAE implementations is trained to identify anomalies by training it on a dataset of normal VM behaviour. This is embodied in a dataset comprising features obtained during normal operation and is used to generate a decision function that is capable of classifying novel samples (i.e. anomalous behaviour). Once trained, the classifier operates on feature vectors in an online capacity in order to produce a classification in real-time. The evaluation of the classifier within the SAE is conducted experimentally through the following procedure:
• A clean VM is created from a known-to-be-clean disk
image
• The VM is monitored for a period of 10 minutes in
what we refer to as the “normal phase”
12. Since it is impossible forν to be equal to 0 we begin the search
with a value of 0.0001 and also increment in intervals of 0.0001. Since
γcan be any non negative real number we begin at 0 and increment in
intervals of 0.01
13. Within our experimentation we found that this iterative process takes no more than 10 seconds on an average machine and need only be carried out once per training dataset
2 3 4 5 6 7 8 9 10 11 12 13 14 15 16 17 18 19 20 21 22 23 24 25 26 27 28 29 30 31 32 33 34 35 36 37 38 39 40 41 42 43 44 45 46 47 48 49 50 51 52 53 54 55 56 57 58 59 60
For Peer Review Only
• Malware is injected and a further 10 minutes of
mon-itoring follows in what we refer to as the “anomalous phase”
The output of the detector component is a vectorywith an n dimension equal to the m dimension of the input matrix, which in the case of online detection yields a single value of y ∈ {−1,1} for each snapshot vector x. This means it is possible to infer the success of the detector from its output relative to the phase in which the output was produced.
3.5 Classification Performance Metrics
The detection performance of the classifier can be assessed by determining the difference between the class it produces for a given input and the class it should produce. For example, if a sample of data contains no anomalies due to a malware strain, and the classifier produces an output of 1 for that data point, it is a correct classification. In order to quantify the classification performance we consult a confusion matrix that describes all possible outcomes of a prediction and has the form:
TN 1 1 FN −1 FP −1 TP Predicted Class Actual Class
In our experiments a “positive” outcome is one in which the detector detects an anomaly, i.e. produces a class of
−1. From this we can conclude that a True Positive (TP) is possible when the classifier produces a−1during malware execution, otherwise it is treated as a False Positive (FP). Similarly, negative results occur when the detector detects normal operation. As such, if malware is not executing, an output of1is a True Negative (TN), otherwise it is treated as a False Negative (FN). From the confusion matrix it is possible to derive a number of performance metrics which are shown in Equation 4 below.
F P R= F P F P +T N Accuracy= T P +T N T P +T N+F P +F N P recision= T P T P +F P Recall= T P T P +F N F score= 2× P recision×Recall P recision+Recall
G mean=√P recision×Recall
(4)
Accuracy is the degree to which the detector classifies any newly tested data samples correctly whereas precision is a measure of how many of the positive classifications are correct, i.e. the probability that a detected anomaly has been correctly classified. The recall metric is a measure of the detector’s ability to correctly identify an anomaly, i.e.
the probability that an anomalous sample will be correctly detected. The final two metrics are the harmonic mean (F score) and geometric mean (G mean), which provide a more rounded measure of the performance of a particular detector by accounting for all of the outcomes to some degree.
4
E
XPERIMENTALS
CENARIOS& M
ALWARED
E-SCRIPTION
4.1 Malware Analysis on Static VMs
An initial concern of any cloud provider should be the aspect of VM screening; the process of profiling the system and network features of a running VM and subsequently confirming that it is not infected with malware. Thus, our first experiment as illustrated via Figure 3 utilised the testbed configuration described earlier and aimed to eval-uate our screening process by injecting malware and also emulating a DDoS attack (as described in section 5.6) on a given VM. The VM in our experimentation hosts a sim-ple web server that provides an HTTP service to multisim-ple client requests. The experiment lasted for 20 minutes, with malware injection (using Kelihos and Zeus malware strains serparately) on the10thminute. In order to generate some realistic background traffic we developed some custom scripts on other hosts within the same LAN that enabled the random generation of HTTP requests to the target server14.
The choice of HTTP for traffic generation is typical of many cloud servers that host web servers or related REST based applications. In addition, these types of server are among the most targeted by malware due to them being very public facing, and therefore require the most monitoring.
The experiment duration was chosen based on empirical experience of the behaviour of our chosen malware strains. Since detection is conducted in real-time it is necessary to have the experiment run uninterrupted. This places a constraint on the format of the experiment whereby the malware needs to be detectable for the duration of the anomalous period, with the only valid outcomes being TPs and FNs during this time. Through experimentation it was observed that the Zeus samples we obtained have a tendency to cease execution beyond 15 minutes; we do not, therefore, need to continue the experiment beyond this boundary. Moreover, we have found that 10 minutes of malware execution is more than sufficient to characterise the detection performance of the detector under the parameters of our experimentation.
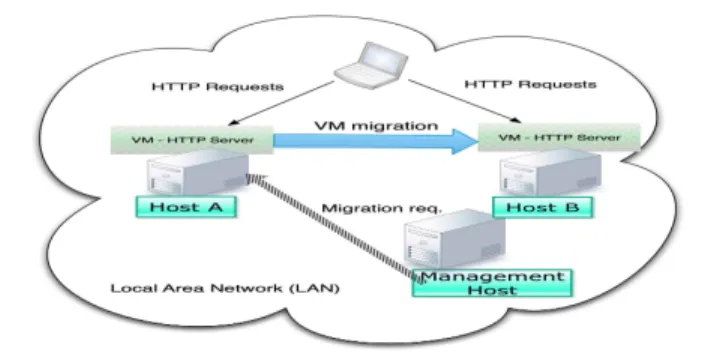
4.2 Malware Analysis During Live-Migration
Cloud providers are also heavily concerned with the secu-rity implications associated with the scenario of VM/service migration from one physical host to another. Thus, in this work we have explicitly targeted live migration for experi-mentation, since the greatest majority of commercial cloud management software (e.g. VMWare VSphere15) employ
this functionality by default. Therefore, the objectives of
14. These scripts were based on the implementation of iperf clients and they included random bursty and “lightweight” requests with varying content and flow size.
15. VMWare VSphere:http://www.vmware.com/uk/products/ vsphere 1 2 3 4 5 6 7 8 9 10 11 12 13 14 15 16 17 18 19 20 21 22 23 24 25 26 27 28 29 30 31 32 33 34 35 36 37 38 39 40 41 42 43 44 45 46 47 48 49 50 51 52 53 54 55 56 57 58 59 60
For Peer Review Only
!"#$#%&&'# ()*+)* !"#$%&'()$&*)+,"(-&.!'*/ 0112&3)45)6+6 0112&3)45)6+6 !"#$%& !"#$# ,-./012Fig. 3. Visualization for the experimental setup for static malware analysis. !"#$%!& !"#$%!' !"#$#%&&'#()*+)* !"#$%&'()$&*)+,"(-&.!'*/ 0112&3)45)6+6 !"#$#%&&'#()*+)* ()*)+,-,*%! "#$% 789($+8":&()4;& <7&=89($+8": "#$%!& 0112&3)45)6+6 "#$%!'
Fig. 4. Visualization for the experimental setup for malware analysis under VM migration.
Fig. 5. Time taken to train the classifier vs. training dataset size Fig. 6. Time taken to output a class vs. training dataset size
our second experiment were: to firstly determine whether the malware resident on an infected VM would remain operational post-migration; secondly, we aimed to address the actual detection of the malware from data gathered at the hypervisor level of the nodes that hosted the VM.
When investigating the effects of migration each ex-perimental run had a total duration of 20 minutes. The experiment was divided into two scenarios: one in which the malware was active during the migration, and one in which the malware was injected after migration. In the first scenario the malware was injected on the10thminute, with migration occuring after injection on the 15thminute. The second scenario involved migration on the5thminute and injection of the malware on the10th minute, as before. As Fig. 4 demonstrates, the testbed for the migration scenario consists of four physical machines, where one machine acts as the management entity (in charge of regulating the mi-gration activities between Host A and Host B), one provides the HTTP client connections, and the other two host the infected VM. Throughout the experiment the HTTP sessions remained active despite the migration of the VM, which is precisely the behaviour expected of webservers in the cloud.
4.3 Malware Samples
This work could have not be evaluated without the ability to generate anomalies within a testing environment. It was therefore essential to utilise appropriate samples of genuine
malware in our experiments16. As already mentioned ( see
Section 1), both malware strains have been reported to exhibit sophisticated evasive and propagation properties and they have compromised million of Windows OS-based machines since 2010 until recently, hence we consider their selection and analysis as timely and at the same time neces-sary.
In particular, the Kelihos malware spawns many child processes and subsequently exits from its main process. This is likely an obfuscation method to avoid detection, but has the effect of skewing system level features resulting in an ob-vious anomaly. The main purposes of these child processes are to monitor user activity and contact a Command and Control server (C&C) in order to join a botnet. At the same time, the Zeus malware and its variants, exhibit obfuscation techniques that tamper with security software installed on a given host. Its first action is to inject itself into one of the main system processes and to subsequently disable anti-virus and security center applications. This behaviour leads to any attempt to detect it from within the OS futile and makes detection systems that exist outside the execution environment of the malware (such as the method used in this work) particularly applicable.
The choice of Windows as the subject of experimentation is largely due to the fact that a range of IaaS clouds do
16. The specific samples of malware used under experimen-tal conditions are: Trojan.Kelihos-5, Trojan.Zbot-1433, Trojan.Zbot-1023, Trojan.Zbot-18 and Trojan.Zbot-385, which were obtained from offensivecomputing.net 2 3 4 5 6 7 8 9 10 11 12 13 14 15 16 17 18 19 20 21 22 23 24 25 26 27 28 29 30 31 32 33 34 35 36 37 38 39 40 41 42 43 44 45 46 47 48 49 50 51 52 53 54 55 56 57 58 59 60
For Peer Review Only
demonstrate a higher need for Windows-based VMs as men-tioned by cloud operators within the IU-ATC project [34]. In addition, most of the malware available in binary form have been compiled as Windows executables, thus we chose a compatible target on which to unleash them.
5
R
ESULTSThe experiments we present in this section test the detection aspects of the System and Network Analysis Engines (SAE and NAE respectively). Given the fact that both engines perform online anomaly detection under the one-class SVM formulation we initially present our results related to the computational cost of the online training and testing of the algorithm, since they affects the overall response of the real-time detection process. We subsequently present our assess-ment on detecting the Kelihos and Zeus malware strains as well as the DDoS attacks. In addition, we further present a comparison between the detection accuracy obtained when using a joint dataset (i.e. composed of both system and network features) with a featureset that strictly considers network-based features.
5.1 Training and Classification Cost Analysis
Figure 5 illustrates the required time for training the one-class SVM one-classifier on various sizes of training datasets. For the sake of completeness we have experimented with a range of sizes having, as a maximum, a large dataset consist-ing up to 80000 rows. This was in order to demonstrate the extremely small impact that training and classification have in our actual experimental conditions. The dataset used in the experiments was around 200 samples, which resulted in a training time of between2and10ms, which is not possible to measure reliably using our tools. Hence, the dataset was extrapolated up to 80000 entries in order to produce an observable trend.
Considering feature extraction takes in the order of sec-onds to complete17, the time taken to train the classifier is
negligible, especially since it is only required to take place once during the lifetime of the classifier.
Classification could also potentially hold up the process of obtaining a class for a particular vector and, like training, is dependent on dataset size. However, as Figure 6 shows, the time taken to produce a class is also negligible with respect to the time taken to obtain the feature vector itself, despite the fact that classification is carried out on every sample vector.
5.2 SAE Kelihos Detection
As already mentioned and described in Section 4.3, the first sample of malware used to test the performance of the SAE component was Kelihos (Trojan.Kelihos-5), which due to its nature as a trojan can be directly executed on the target VM without the need to explicitly alter the Windows registry.
Our trained and tuned one-class SVM implementation was used in an online mode to classify feature vectors as they were collected from the test VM. The classifier
17. 8 seconds in our experiments, however this is without any optimi-sations and could be reduced significantly through natively compiled code rather than interpreted scripts.
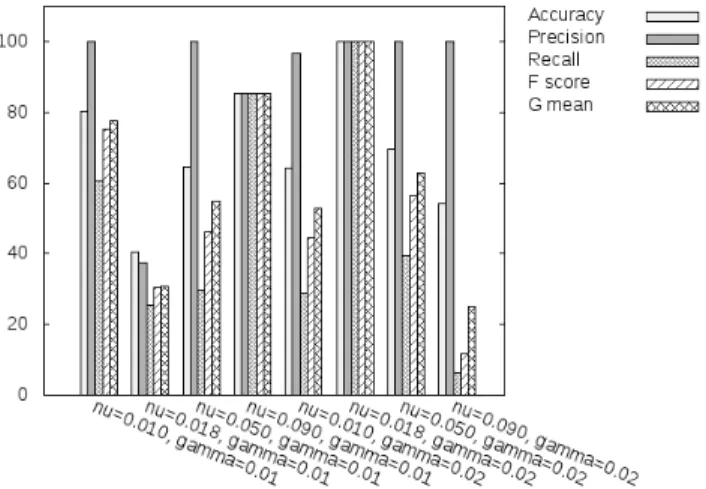
Fig. 7. Results of detection for Kelihos-5 using end-system features and a variety of kernel parameters
was tuned according to the methods described in Section 3.3 and was trained using a dataset consisting of around 200 samples of normal behaviour gathered during normal server operation.
The output class produced by the detector for each input vector was determined to be either correct or incorrect depending on the state of the malware sample at the time of feature extraction.
In particular, the timeline for the experiment consisted of two phases: 10 minutes of normal activity, followed by 10 minutes of malware infection where any positive detection classifications in the first phase were therefore false posi-tives, whereas positive results in the second phase were true positives.
The results of this experiment can be seen in Figure 7 where all bar charts shown in the figure were produced by calculating the various performance metrics for each set of the SVM-specific parameters according to the formulae in Equation 4. In our case, the the tuned classifier can be identified by the kernel parameters nu = 0.018 and
gamma= 0.02.
Based on the generated results it is shown that tuning an SVM classfier according to the method in Section 3.3 results in a more reliable detector for our particular scenario. In addition, the results show that it is possible to reliably classify feature vectors as they are produced, which enables the algorithm to be used in an online capacity to detect anomalies in a target VM as they occur. Furthermore, the anomalies produced by Kelihos as a result of its execution behaviour were detectable using the features collected by our analysis engine at accuracies nearing 100%.
5.3 SAE Zeus Detection
Experiments using Zeus samples were conducted in the same manner as those using Kelihos. A Zeus sample was executed for the last 10 minutes of a 20 minute experiment, during which results were obtained from the classifier in real time.
The first experiment using one Zeus sample tested the ability of the SAE to detect samples other than Kelihos
1 2 3 4 5 6 7 8 9 10 11 12 13 14 15 16 17 18 19 20 21 22 23 24 25 26 27 28 29 30 31 32 33 34 35 36 37 38 39 40 41 42 43 44 45 46 47 48 49 50 51 52 53 54 55 56 57 58 59 60
For Peer Review Only
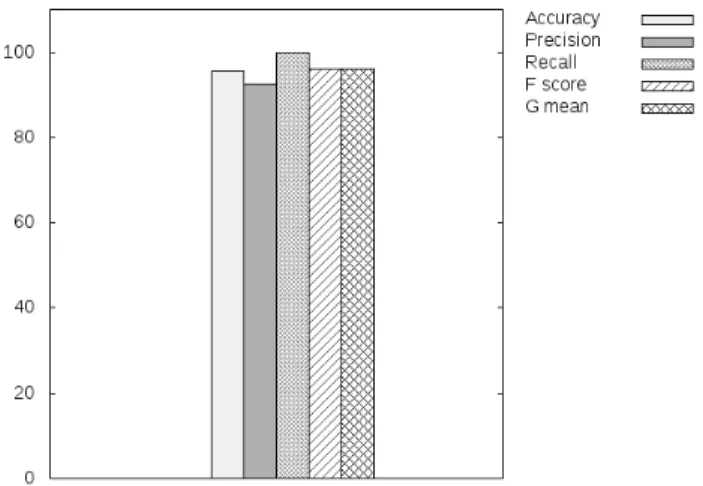
Fig. 8. Detection of Zeus-1433 using end-system features with a tunedclassifier
Fig. 9. SAE Detection of various Zeus samples using end-system data and a tuned classifier
in order to verify that the method is not limited to one type of malware. As evidenced by Figure 8 the detector performs equally well when detecting either Kelihos or Zeus by reaching overall more than 95% of detection accuracy throughout all the detection performance metrics.
5.4 Detecting Zeus Variants
The experiments thus far have tested the SAE against two strains of malware from different malware families. How-ever we felt it necessary to test against different samples from the same strain in order to determine whether our ap-proach is flexible in its classification of anomalous activity.
Figure 9 shows experiments conducted with the same experimental procedure as the previous two experiments, but with each using a different sample of Zeus. The excellent detection results from each show that the method is suitable not only for detecting multiple strains of malware, but also variants of the same strain with more than90% of overall detection performance for most of the malware strains.
However we have witnessed a poor result that involved the detection of theTrojan.Zbot-18strain. We argue that this is likely due to this particular malware sample’s execution pattern and not neccesarily a deficiency of the detector. The Trojan.Zbot-18 sample does not exhibit anomalous activity when first executed, but rather waits for a period of time before continuing to operate. As such the detector correctly detects normal activity even though the experiment has pro-gressed into the infected, or “anomalous”, phase. This skews the results so that the detector appears to be performing less well, when in fact the malware is dormant during a portion of its lifetime.
5.5 SAE Detection During VM “Live” Migration
Clouds are characterised not only by hardware virtualisa-tion, but also by the elasticity that virtualisation enables. As such, and based on discussions with real cloud operators, we considered it important to test the detection performance of our proposed technique in scenarios that utilise the elastic nature of the cloud. One such elasticity measure is VM “live” migration which allows real-time load balancing,
failover and other resilience techniques to be employed towards improving server uptime on a physical host, as well as efficient operation of the services hosted on a given VM.
To test the SAE under scenarios with VM “live” migra-tion, we deployed our SAE implementation on two com-pute nodes and configured them to use the same training dataset and algorithm parameters. The first experiment consisted of a normal phase lasting 10 minutes followed by an anomalous phase of a further 10 minutes, with live-migration scheduled halfway through the anomalous phase. The second experiment was conducted in a similar manner, but with migration scheduled halfway through the normal phase. Figures 10 and 11 exhibit the results for each experi-ment respectively.
In general, the results show that migration does not affect the performance of the detector at all due to the fact that each SAE is configured in exactly the same way, and thus detects anomalies with the same level of accuracy. The migration itself has no effect because it pauses the VM and reinstates it with exactly the same configuration on the new node; the actual downtime is not noticeable. The VM has fixed hardware parameters that must be satisfied on the new node if migration is to succeed, therefore since the migration occurred without issue the detection is able to continue, also without issue.
In Figure 11 thepre-migrationresults are missing values for precision, f-score and g-mean. This is simply a matter of divide-by-zero errors, caused by the detector not producing any true positives or false positives. The metrics cannot be calculated and are therefore absent from the chart.
No true positives were produced because the detector was in the normal phase and there were no anomalies to detect; no false positives were produced because the detector was performing particularly well. Hence, we can only determine values for the missing metricspost-migration when the experiment has entered the anomalous phase and true positives are once again a possibility. Theoverallresults are the best measure of the performance of the SAE and were calculated by combining the results of both SAE compo-nents as if they had been produced by a single detector and,
2 3 4 5 6 7 8 9 10 11 12 13 14 15 16 17 18 19 20 21 22 23 24 25 26 27 28 29 30 31 32 33 34 35 36 37 38 39 40 41 42 43 44 45 46 47 48 49 50 51 52 53 54 55 56 57 58 59 60
For Peer Review Only
as is evident from the figure, once again reached accuracy levels well above90%.
5.6 NAE Detection of Volumetric Network Attacks
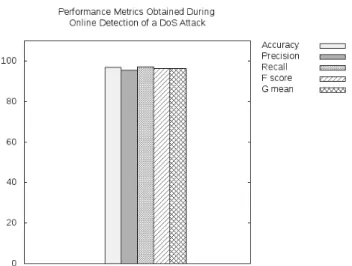
Using a featureset that is capable of encapsulating changes to the volumetric properties of traffic on the network we were able to detect Denial of Service (DoS) attacks on the HTTP service running on a given VM using our NAE component.
The experiment consisted of the same VM as in previous experiments, running an HTTP server and serving clients with random data. The NAE collected network features in 8 second time bins under a normal period which lasted for 10 minutes. After the normal period the VM was attacked using the DoS traffic generator Low Orbit Ion Cannon (LOIC). The anomalies produced by this tool were detected by the NAE, which used SVM to compare new vectors with a dataset of normal samples. The output of the NAE was used to produce evaluation metrics according to the formulae in Equation 4.
The results in Figure 12 show that our choice of network features is appropriate and sufficient for detecting network based DoS attacks, since the accuracies obtained echo those of the SAE of well above 90%. However, due to the poor results obtained from the joint dataset experiments shown below in Section 5.7 it can be concluded that the featureset is insufficient for detecting the anomalies produced by the malware samples we use in this work.
Although the SAE was not the subject of this experiment it is likely that the system metrics obtained by the SAE com-ponent would be impacted by the attack, if the attack had any impact on the VM’s services. This would be the case if the DoS caused the server to spawn more processes/threads in order to meet demand, therefore skewing these particular features and their respective meta-features. Unfortunately, due to time constraints, it was not possible to confirm this.
5.7 Detection Using Joint vs. Network-Only Datasets
The previous experiment using network data involved the use of a volume-based external attack to test the detector. Figure 13 shows the results of two experiments to detect the anomalies produced by Zeus at the network level. As is evident from the figure the detector is not successful, using the features that are more suited to detecting DoS attacks rather than C&C communication. This is embodied in a result of less than 10% for recall, a measure of how well the detector can identify anomalies.
Experiments involving the detection of malware have so far been conducted in each domain separately. It is also possible, using the same techniques of feature extraction, to combine the features into a joint feature vector before analysis; that is, rather than analysing system and network-level features separately it is possible to combine them using a joint analysis approach. The experimental parameters of 10 minutes of normal activity followed by 10 minutes of anomalous activity were carried out as usual. However, the SAE classifier was trained using a dataset composed of vectors that were created from both network and system-level data. The evaluation metrics from Equation 4 were applied to the output in order to determine the detector’s reliability under these new experimental conditions.
The results in Figure 13 show that overall detection is no more effective when system and network data are analysed together, in fact the performance is almost as poor as if the system-level data had been left out. The result for recall was improved to just over 10%, however this is still un-acceptable. This is due to the fact that the network features chosen were not sufficient to detect network anomalies on their own, indicating that a larger number of statistical meta-features are needed.
Another possibility is the fact that the separate feature-sets do not correlate sufficiently in order to be used effec-tively together. In parallel, this outcome also indicates that a joint dataset may not be useful in general due to the explicit algorithmic formulation of one-class SVMs. As we show in our other study in [8], the joint dataset was appropriate for use with the Empirical Mode Decomposition (EMD) algo-rithm, which performed well under the same constraints. This may be due to the formulation of EMD as a signal processing-based solution, which differs significantly to the machine-learning approach of one-class SVM.
6
C
ONCLUSIONSIn this paper we introduce an online anomaly detection method that can be applied at the hypervisor level of the cloud infrastructure. The method is embodied by a resilience architecture that was initially defined in [4], further explored in [36], [37] and which comprises the System Analysis Engine (SAE) and Network Analysis Engine (NAE) com-ponents. These exist as submodules of the architecture’s Cloud Resilience Managers (CRMs), which perform detec-tion at the end-system, and in the network respectively. Our evaluation focused on detecting anomalies as produced by a variety of malware strains from the Kelihos and Zeus samples under the formulation of a novelty detector that employs the one-class Support Vector Machine (SVM) algo-rithm. Moreover, in order to empower the generic properties of our detection approach we also assess the detection of anomalies by the SAE and NAE during the onset of DoS attacks.
Overall, this work performs online anomaly detection under two pragmatic cloud scenarios, based on suggestions by cloud operators, which emulate “static” detection as well as detection under the scenario of VM “live” migra-tion. The results obtained by strictly utilizing system-level data in our SAE detection, which was supp