Multicategory Classification Using Support Vector
Machine for Microarray Gene Expression Cancer
Diagnosis
Dr.S.Santhosh Baboo1, Mrs.S.Sasikala2Abstract-This paper deals with the advanced and developed
methodology know for cancer multi classification using Support Vector Machine (SVM) for microarray gene expression cancer diagnosis, this is used for directing multicategory classification problems in the cancer diagnosis area. SVMs are an appropriate new technique for binary classification tasks, which is related to and contain elements of non-parametric applied statistics, neural networks and machine learning. SVMs can generate accurate and robust classification results on a sound theoretical basis, even when input data are non-monotone and non-linearly separable. The performance of SVM is evaluated for the multicategory classification on benchmark microarray data sets for cancer diagnosis, namely, the SRBCT Data set. The results indicate that SVM produces comparable or better classification accuracies when the data given as input are preprocessed. SVM delivers high performance with reduced training time and implementation complexity is less when compared to artificial neural networks methods like conventional back-propagation ANN and Linder’s SANN.
Keyword- SVM, ANOVA, Dataset,Cancer Classification
and Gene Expression
I.
I
NTRODUCTIONancer is one of the atrocious diseases found in most of the living organism, which is one of the challenging studies for scientist towards 20th century. There were lot of proposal from various pioneers and detailed picture study was still going on. Basically Cancer is characterized by an abnormal, uncontrolled growth that may destroy and invade adjacent healthy body tissues or elsewhere in the body. Living organisms such as animals and plants are made of cells. The simplest organisms consist of just a single cell. The human body compromises of billions of cells; most of the cells have a limited life-span and need to be replaced in cyclic manner. Each cell is capable of duplicating themselves. Millions of cell divisions and replications take place daily in the body and it is astounding that the process occurs so perfectly most of the time every cell division requires replication of the 40 volumes of genetic coding. On rare circumstances there is some defect in a division and a ___________________________
About1- Reader, PG and Research department of Computer Science, Dwaraka Doss Goverdhan Doss Vaishnav College Chennai, Tamil Nadu,[email protected]
About2- ResearchScholar,Dravidian University,AndraPradesh, Head Department of Computer Science, Sree Saraswathi Thyagaraja College, Pollachi, Coimbatore, Tamil Nadu, INDIA. [email protected]
rogue, potentially malignant cell arises. The immune system seems to recognize such occurrences and is generally capable of removing the abnormal cells before they have an opportunity to proliferate. Rarely, there is a failure of the mechanism and a potentially malignant cell survives, replicates and cancer is the result.High-density DNA microarray computes the activities of several thousand genes simultaneously and the gene expression profiles have been used for the cancer classification recently. This new approach promises to give improved therapeutic measurements to cancer patients by diagnosing cancer types with improved accuracy. SVM is successfully applied to the cancer identification problems. However, it is most favorable extension to more than two classes was not obvious, which might impose limitations in its application to multiple tumor types. The binary SVM is applied to multiclass cancer diagnosis problems. SVM is a learning machine used as a tool for data classification, function approximation, etc, due to its generalization ability and has found success in many applications. Feature of SVM is that it minimizes the upper bound of generalization error through maximizing the margin between separating hyper plane and dataset. SVM has an added advantage of automatic model selection in the sense that both the optimal number and locations of the basis functions are automatically obtained during training. The performance of SVM largely depends on the kernel [23], [24].This paper presents a new technique for Multicategory Classification for Microarray Gene Expression Cancer Diagnosis Using Support Vector Machine for predicting cancer cells in living organism by the technique of ANOVA (Analysis Of Variance). This proposed system put fourth an accuracy of 100% by second level combinational technique. The multi-category cancer classification performance of SVM is evaluated on SRBCT Dataset. The evaluation results indicate that SVM produces better classification accuracy with reduced training time and implementation complexity compared to earlier implemented models. The remainder section of this paper is organized as follows. Section 2 discusses cancer classification systems with various classifying approach that were earlier proposed in literature. Section 3 explains the proposed work of developing a cancer classification system using a Support Vector Machine. Section 4 illustrates the results for experiments conducted on sample dataset in evaluating the performance of the proposed system. Section 5 concludes the paper with fewer discussions.
C
GJCST Classification J.3, H.2.8
Global Journal of Computer Science and Technology
Vol. 10 Issue 15 (Ver. 1.0) December 2010
P a g e
|
39
II.
R
ELATED WORKSridhar ramaswamy et al. [16] describes about multiclass cancer diagnosis using tumor gene expression signatures, which deliberately says about, the complex combination of clinical and histopathological data for optimal treatment of patients with cancer depends on establishing accurate diagnoses; it seems to be difficult because of atypical clinical presentation or histopathology. To determine whether the identification of multiple common adult malignancies could be achieved purely by molecular classification, for example the author, subjected 218 tumor samples, spanning 14 common btumor types, and 90 normal tissue samples to oligonucleotide microarray gene expression analysis. Here by using SVM the accuracy of multi class is predicted by expressing 16,063 genes and sequence tags. So this had an output of 95%, much greater than the accuracy of random classification that is about 9%. In recent times, [6] [7] DNA microarray-based tumor gene expression profiles have been used for cancer diagnosis. Anyhow, studies have been limited to few cancer types and have spanned multiple technology platforms complicating comparison among different datasets. The possibility of cancer diagnosis across all of the common malignancies based on a single reference database has not been explored. For a sample 314 tumors and 98 normal tissues were considered, in that 218 tumor and 90 normal tissue samples passed quality control criteria and were used for subsequent data analysis. The remaining 104 samples of the data will either fail the quality control measures or the quality of RNA, as assessed by spectrophotometric measurement of OD and agarose gel electrophoresis, or yielded poor-quality scans. Scans are discarded if the mean chip intensity exceeded 2 SDs from the average mean intensity for the whole scan set, if the proportion of p resent calls was less than 10%, or if microarray artifacts were visible. The problem of biological and measurement noise, contaminating nonmalignant tumor components, and inclusion of genetically heterogeneous samples within clinically defined tumor classes may all effectively decrease predictive power in the multiclass setting. Increased gene number likely allows for accurate prediction despite these factors. A greater variety and large number of tumors with detailed clinic pathological characterization will be required to fully explore the true limitations of gene expression-based multiclass classification. Lipo wang et al proposed the accurate cancer classification using expression of very few genes, the author aim at finding the smallest set of genes that can ensure highly accurate classification of cancers from microarray data by using supervised machine learning algorithms. The importance of finding the minimum gene subsets is three-fold: 1) It greatly reduces the computational burden and “noise” arising from irrelevant genes. From the examples stated in this paper, finding the minimum gene subsets even allows for extraction of simple diagnostic rules which lead to accurate diagnosis without the need for any classifiers. 2) The gene expression tests are simplified to include only a very small number of genes rather than
thousands of genes, which can bring down the cost for cancer testing significantly.3) It calls for additional investigation into the possible biological relationship between these small numbers of genes and cancer development and treatment. Our simple yet very effective method involves two steps. In the first step, the author chooses some important genes using a feature importance ranking scheme. In the second step, the author tests the classification capability of all simple combinations of those important genes by using a good classifier. For three “simple” and “small” data sets with two, three, and four cancer (sub) types, our approach obtained very high accuracy with only two or three genes. For a “large” and “complex” data set with 14 cancer types, the author divided the whole problem into a group of binary classification problems and applied the 2-step approach to each of these binary classification problems. Through this “divide-and-conquer” approach, the author obtained accuracy comparable to previously reported results but with only 28 genes rather than 16,063 genes. In general, this method can significantly reduce the number of genes required for highly reliable diagnosis by the technique of SVM-T test analysis. The author analyzed finally and gave the accuracy rate of 100% by three combinational iteration techniques. Ahmad M. Sarhan suggests ,The cancer classification based on microarray gene expression data using DCT and ANN‟. The author mainly deals about, a stomach cancer detection system based on Artificial Neural Network (ANN), and the Discrete Cosine Transform (DCT), is developed. The developed system extracts classification features from stomach microarrays using the DCT. The extracted features from the DCT coefficients are then applied to an ANN for classification (tumor or non tumor). The microarray images used in this study were obtained from the Stanford Medical Database (SMD). Simulation results showed that the developed system produces a very high success rate. DNA Microarrays are glass microscope slides onto which genes are attached at fixed and ordered locations. Each gene sequence is identified by a location of a spot in the array. Using a Microarray printer, the DNA is spotted directly onto the slide. With microarrays, it is possible to examine a gene expression within a single sample or to compare gene expressions within two tissue samples, such as in tumor and non tumor tissues. In this paper, a robust system for stomach cancer detection using microarrays is presented. The system consists of a feature extraction stage followed by an ANN classification stage. The feature extraction stage uses the 2 D DCT to compress the input microarray. Low frequency components of the DCT array constitute most of the energy/information of the input microarray. These components were, thus, used as distinctive features and were extracted using a windowing technique. The paper also investigates through simulations, optimal parameters such as the optimal number of DCT coefficients/features and the optimal ANN structure for the recognition of stomach cancer. The proposed method produces a success rate of 99.7%. The sensitivity, specificity, and accuracy of the system were found to be equal to 99.2%, 100%, and 99.66%
respectively. Experimental tests on the SMD Database achieved 99.7% of recognition accuracy using only100 DCT coefficients, with a simple 2-layer ANN structure and low computational cost. Runxuan Zhang en al. in [6] proposed a fast and efficient classification method called ELM algorithm. In ELM one may choose at random and fix all the hidden node parameters and then analytically determine the output weights. Studies have shown [2] that ELM has good generalization performance and can be implemented easily. Many nonlinear activation functions are used in ELM, like sigmoid, sine, hard limit [5], radial basis functions [3] [4], and complex activation functions [1]. In order to evaluate the performance of ELM algorithm for micro category cancer diagnosis, three bench-mark micro array data sets, namely, the GCM, the lung and the lymphoma data sets are used. For gene selection recurs-ive feature elimination method is used. ELM can perform multicategory classification directly with out any modific-ation. This algorithm achieves higher classification accuracy than the other algorithms such as ANN, SANN and SVM with less training time and a smaller network structure.
III.
M
ETHODOLOGYThis proposed system mainly deals with cancer prediction by using SVM classification technique. SVM technique uses ANOVA test for grouping up the sample amount of sequen-tial data. SVM technique overcomes the previous classifica-tion methodology by means of time consumpclassifica-tion and by giv-ing best accuracy rate. This projected method is comprised of two steps. In Step 1, all genes in the training data set are ranked using a scoring scheme. Then, the genes with high scores are retained. In Step 2, the classification capability of all simple combinations is tested among the genes selected in Step 1 using a good classifier. This paper proposes a new method of ranking with ANOVA and classifying with SVM. The mechanisms for Step 1 and Step 2 are described as follows. Step 1: Gene Importance Ranking
In Step 1, the importance ranking of each gene is computed using a feature ranking measure, two of which are described below.
Only the most important genes are retained for Step 2.
1) ANOVA (ANalysis Of VAriance)
ANOVA is a technique, which is often used in analysis of data, and to draw interesting information based on P-values. The ANOVA is known to be robust and assumes that all the sample populations are normally distributed with equal variance and all observations (samples) are mutually independent. The approach chosen in this paper is the one-way ANOVA which performs an analysis on comparing two or more groups (samples) which in turn returns a single p-value that is significant for groups that are different from others. The most significant varying information has the smallest p-values. Within groups estimate of
= (1)
Between –group estimate of
= (2)
F ( ) =b (3)
Of all the information existing in the ANOVA table, if the p value for the F- ratio is less than the critical value (α), then the effect is said to be significant. In this paper the α value is set at 0.05, any value less than this will result in important effects, while any value greater than this value will result in non-significant effects. The very small p-value indicates that differences between the column means (group means) are highly significant. The probability of the F-value arising from two similar distributions gives us a measure of the significance of the between-sample variation as compared to the within-sample variation. Small p-values indicate a low probability of the between-group variation being due to sampling of the within-group distribution and small p-values indicate interesting features. This study uses the p-values to rank the important features with small values and the sorted numbers of features are used for further processing.
Global Journal of Computer Science and Technology
Vol. 10 Issue 15 (Ver. 1.0) December 2010
P a g e
|
41
Fig.1: Proposed Feature Selection Method Initially, all the features are ranked using a feature ranking
measure and the most important features alone are retained for next the step. After selecting some top features from the importance ranking list, the data set is attempted to classify with only one feature. In this paper, the Support Vector Machine (SVM) classifier is used to test n-feature combinations.
a) Class Separability
Another frequently used method for gene importance ranking is the class separability (CS) [8]. The CS of gene I is defined as
(4)
= (5)
(6) For gene i, SBi (the distances between samples of different classes) is the sum of squares of the interclass distances. SWi (the distances of samples within the same class) is the sum of squares of the intraclass distances. A larger CS denotes a greater ratio of the interclass distance to the intraclass distance and, therefore, can be used to measure the capability of genes to separate different classes. In fact, the CS used here is similar to the F-statistic that is also widely used for ranking genes in literature (see, e.g., [12], [13]). The difference between the CS and the F-statistic F is:
= - (7)
Because the term
- (8)
CS equation is a constant for a specific dataset; the CS can be regarded as a simplification of F-statistic. The two methods will guide to the same ranking results for the same data set.
Step 2: Finding the Minimum Gene Subset
After selecting some top genes from the importance ranking list, the data set is attempted to classify with only one gene. Each selected feature is given as input into our classifier. If no good accuracy is obtained, continued classifying the data set with all the possible 2-feature combinations within the selected feature. If still no good accuracy is obtained, this procedure with 2-features combination is repeated and so on, until a good accuracy is obtained.
2) Support Vector Machine (SVM)
SVM is usually used for classification tasks introduced by Cortes [25]. For binary classification SVM is used to find an optimal separating hyper plane (OSH) which generates a maximum margin between two categories of data. To construct an OSH, SVM maps data into a higher dimensional feature space. SVM performs this nonlinear mapping by using a kernel function. Then, SVM constructs a linear OSH between two categories of data in the higher feature space. Data vectors which are nearest to the OSH in the higher feature space are called support vectors (SVs) and contain all information required for classification. In brief, the theory of SVM is as follows [27].
Consider training set with each input n i x ∈ Rn and an associated output y
i { -1, +1}. Each input x is firstly mapped into a higher dimension feature space F, by
z=φ (x) via a nonlinear mapping φ: Rn →F. When data are linearly non-separable in F, there exists a vector w ∈ F and a scalar b which define the separating hyper plane as:
(9)
where ( 0) are called slack variable. The hyper plane that optimally separates the data in F is one that
(10) where C is called regularization parameter that determines the tradeoff between maximum margin and minimum classification error. By constructing a Lagrangian, the optimal hyper plane according to previous equation, may be shown as the solution of
(11)
where 1,….., L are the nonnegative Lagrangian multipliers. The data points i x that correspond to i>0 are SVs. The weight vector w is then given by
(12)
For any test vector x ∈Rn , the classification output is then given by
(13) To build an SVM classifier, a kernel function and its parameters need to be chosen. So far, no analytical or empirical studies have established the superiority of one kernel over another conclusively. In this study, the following three kernel functions have been applied to build SVM classifiers:
1) Linear kernel function, K(x,z) = x,z ;
2) Polynomial kernel function K( x, z) =( x, z +1) dis the degree of polynomial;
3) Radial basis function is the
width of the function.SVM kernel functions The classification ability of feature combinations in cancer applications is obtained with first attempt work of SVM kernel function. The three main kernel functions are used for our study here. Partial kernel function, influence to data near test points. The above mentioned kernel functions are briefly explained in this chapter. The most used kernel function for SVM is Radial Basis Function (RBF). Radial Basis Function Kernel: The B-Spline kernel is defined on the interval [−1, 1]. It is given by the recursive formula:
(14)
In the work by Bart Hamers it is given by:
(15)
Alternatively, Bn can be computed using the explicit expression (Fomel, 2000):
(16) Where x+ is defined as the truncated power function:
(17) 1. Linear Kernel: The Linear kernel is the simplest kernel function. It is given by the inner product <x,y> in addition with an optional constant c. Kernel algorithms using a linear kernel are often equivalent to their non-kernel counterparts.
(18) 2. Polynomial Kernel: The Polynomial kernel is a non-stationary kernel. Polynomial kernels are apt for problems where all the training data is normalized.
(19) Modifiable parameters are the slope alpha, the constant term c and the polynomial degree d.
IV.
E
XPERIMENTAL RESULTSIn order to evaluate the performance of the SVM algorithm for multicategory cancer diagnosis SRBCT Dataset used in this paper. The SRBCT data set [28] contains the expression data of 2,308 genes. There are a total of 63 training samples and 25 testing samples already provided in [2]; five of the testing samples are not SRBCTs. The 63 training samples hold 23 Ewing family of tumors (EWS), 20 rhabdomyosarcoma (RMS), 12 neuroblastoma (NB), and eight Burkitt lymphomas (BL). And, the 20 SRBCT testing samples hold six EWS, five RMS, six NB, and three BL. As introduced in [6], for a microarray data with n genes, each ANOVA classifier produces a hyperplane w, which is a vector of n elements, each corresponding to the expression of a particular gene. The absolute magnitude of each element in w can be considered as a measure of the importance of each corresponding gene. Each ANOVA-SVM classifier is first trained with all of the genes, then the gene corresponding to the bottom 10 percent, wij, are removed. Each classifier is then again trained after the
Global Journal of Computer Science and Technology
Vol. 10 Issue 15 (Ver. 1.0) December 2010
P a g e
|
43
removal of genes. This process is repeated with iterations and a rank of all of the genes based on the statistical significance of each class can be obtained. In the first step, the entire set of 2,308 genes is ranked according to their TSs in the training data set. Then, 50 genes with the highest TSs
are picked out as showninTable1
(http://www.ntu.edu.sg/home5/pg02317674). SVM is used as the classifier for the SRBCT microarray data set. The expression data of the gene ranked 1 in referenceTable1 (http://www.ntu.edu.sg/home5/pg02317674) is used to train and then test the SVM. This process is repeated with the top two genes in Table 1 (http://www.ntu.edu.sg/ home5/pg02317674), then the top three genes, and so on. The testing error reduced to 0 when the top 16 genes were
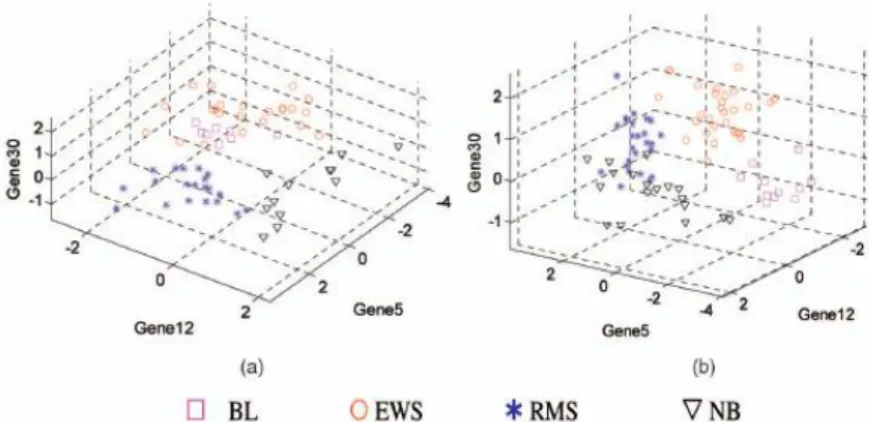
input into the SVM. To further decrease the number of genes required for accurate classification of the four cancer subtypes, all possible combinations of one gene and two genes within the 50 selected genes are tested. None of them can lead to 100 % CV accuracy for training data.Then, all possible combinations of three genes within the 50 selected genes were tested. Among all 19,600 such 3-gene combinations, the 5-fold CV accuracy for the training data found to be reached 100 percent with the combination of Gene 5, Gene 12, and Gene 30. The testing accuracy of this combination is 95 % (one error for the 20 testing samples). Because this combination contains only three genes, it is still possible for us to visualize it. Two different views of the 3D plot of this 3-gene combination is shown in fig.2.
Fig.2: Three-dimensional views of gene expression
levels of 3-gene combination (5, 12, 30) that separates the four SRBCT subtypes, i.e., BL, EWS,RMS, NB: (a) A view in which RMS and NB can be seen to be separated from other subtypes. (b) A view in which BL can be seen to be separated from EWS. From the two views, the four subtypes are clearly separable. Here, all of the genes are labeled according to their TS ranks. ANOVA found only one such 3-gene combination that achieved 100 percent 5-fold CV accuracy.In the view of Fig. 2a, RMS and NB are well separated from other types. In the view of Fig. 2b, BL and EWS are well separated with a clear boundary. It is obvious that the four SRBCT subtypes are separated from one another, when observed from these two views. Except for (5, 12, and 30), no other gene combinations obtained 100 % CV accuracy for the training data. Even some combinations achieved 100% testing accuracy.
Table 1: Comparison of Accuracy of SVM with PCA and T-Test Algorithm Accuracy (%) SVM with Raw data 95.51 SVM with preprocessed data 97.28
Fig. 3: Comparison of accuracy for the Raw and preprocessed dataset on SVM
Fig.3 displays the comparison of achieved by SVM for two input datasets which are preprocessed and raw dataset. The preprocessed dataset input delivers high accuracy.
V.
C
ONCLUSIONIn this paper, a fast and efficient classification method called the SVM algorithm for a multicategory cancer diagnosis problem based on microarray data is presented. Its performance has been compared for the raw data and ANOVA preprocessed data. It is found that SVM performs better with high accuracy when the data is preprocessed and given as input. The previous methods inevitably involve more classifiers, greater system complexities and computational burden, and a longer training time. SVM can
85 90 95 100 Accura cy
Input Data for SVM
Raw Data Preprocessed Data
carry out the multicategory classification directly, without any modification. Study results are consistent with our hypothesis that, even when the number of categories for the classification task is large, the SVM algorithm achieves a higher classification accuracy than the other algorithms with less training time and a smaller network structure. It can also be seen that SVM achieves more balanced and better classification for individual categories as well. Theoretical investigation on these is currently under way.
VI.
R
EFERENCES1) M. Ringner, C. Peterson, and J. Khan, “Analyzing Array Data Using Supervised Methods,” Pharmacogenomics, vol. 3, no. 3, pp. 403-415, 2002. 2) G.-B. Huang and C.-K. Siew, “Extreme Learning
Machine: RBF Network Case,” Proc. Eighth Int‟l Conf. Control, Automation, Robotics, and Vision (ICARCV ‟04), Dec. 2004
3) D. Serre, Matrices: Theory and Applications. Springer-Verlag, 2002.
4) G.-B. Huang, L. Chen, and C.-K. Siew, “Universal Approximation Using Incremental Constructive Feedforward Networks with Random Hidden Nodes,” IEEE Trans. Neural Networks, vol. 17, no. 4, pp. 879-892, 2006.
5) S. Dudoit, J. Fridlyand, and T.P. Speed, “Comparison of Discrimination Methods for Classification of Tumors Using Gene Expression Data,” J. Am. Statistical Assoc., vol. 97, no. 457, pp. 77-87, 2002.
6) Runxuan Zhang, Guang-Bin Huang, Narasimhan Sundararajan, and P. Saratchandran, “ Multicategory Classification Using an Extreme Learning Machine for Microarray Gene Expression Cancer Diagnosis, ” vol 4,no 3,july-september 2007.
7) M. Schena, D. Shalon, R.W. Davis, and P.O. Brown, “Quantitative Monitoring of Gene Expression Patterns with a Complementary DNA Microarray,” Science, vol. 270, pp. 467-470, 1995.
8) S. Dudoit, J. Fridlyand, and T.P. Speed, “Comparison of Discrimination Methods for the Classification of Tumors Using Gene Expression Data,” J. Am. Statistical Assoc., vol. 97, pp. 77-87, 2002.
9) R. Linder, D. Dew, H. Sudhoff, D. Theegarten, K. Remberger, S.J. Poppl, and M. Wagner, “The ‟Subsequent Artificial Neural
10) Network‟ (SANN) Approach Might Bring More Classificatory Power to ANN-Based DNA Microarray Analyses,” Bioinformatics, vol. 20, no. 18, pp. 3544-3552, 2004
11) G.-B. Huang, Q.-Y. Zhu, and C.-K. Siew, “Extreme Learning Machine: A New Learning Scheme of Feedforward Neural Networks,” Proc. Int‟l Joint Conf. Neural Networks (IJCNN ‟04), July 2004.
12) G.-B. Huang and C.-K. Siew, “Extreme Learning Machine: RBF Network Case,” Proc. Eighth Int‟l Conf.
Control, Automation, Robotics, and Vision (ICARCV ‟04), Dec. 2004.
13) G.-B. Huang and C.-K. Siew, “Extreme Learning Machine with Randomly Assigned RBF Kernels,” Int‟l J. Information Technology, vol. 11, no. 1, 2005.
14) G.-B. Huang, Q.-Y. Zhu, K.Z. Mao, C.-K. Siew, P. Saratchandran, and N. Sundararajan, “Can Threshold Networks Be Trained Directly?” IEEE Trans. Circuits and Systems II, vol. 53, no. 3, pp. 187-191, 2006. 15) M.-B. Li, G.-B. Huang, P. Saratchandran, and N.
Sundararajan, “Fully Complex Extreme Learning Machine,” Neurocomputing, vol. 68, pp. 306-314, 2005.
16) S. Ramaswamy, P. Tamayo, R. Rifkin, S. Mukherjee, C.-H. Yeang, M. Angelo, C. Ladd, M. Reich, E. Latulippe, J.P. Mesirov, T. Poggio, W. Gerald, M. Loda, E.S. Lander, and T.R. Golub, “Multiclass Cancer Diagnosis Using Tumor Gene Expression Signatures,” Proc. Nat‟l Academy Sciences, USA, vol. 98, no. 26, pp. 15149-15154, 2002.
17) R. Linder, D. Dew, H. Sudhoff, D. Theegarten, K. Remberger, S.J. Poppl, and M. Wagner, “The ‟Subsequent Artificial Neural Network‟ (SANN) Approach Might Bring More Classificatory Power to ANN-Based DNA Microarray Analyses,” Bioinformatics, vol. 20, no. 18, pp. 3544-3552, 2004. 18) O. Troyanskaya et al., “Missing Value Estimation
Methods for DNA Microarrays,” Bioinformatics, vol. 17, pp. 520-525, 2001.
19) M. West, C. Blanchette, H. Dressman, E. Huang, S. Ishida, R. Spang, H. Zuzan, J.A. Olson Jr., J.R. Marks, and J.R. Nevins, “Predicting the Clinical Status of Human Breast Cancer by Using Gene Expression Profiles,” Proc. Nat‟l Academy of Sciences USA, vol. 98, pp. 11 462-11 467, 2001.
20) E. Freyhult, P. Prusis, M. Lapinsh, J.E. Wikberg, V. Moulton, and M.G. Gustafsson, “Unbiased Descriptor and Parameter Selection Confirms the Potential of Proteochemometric Modelling,” BMC Bioinformatics, vol. 6, no. 50, 2005.
21) S. Dudoit, M.J.V.D. Laan, S. Keles, A.M. Molinaro, S.E. Sinisi, and S.L. Teng, “Loss-Based Estimation