Systems and Methods for Measuring and Improving
End-User Application Performance on Mobile Devices
by
Ashkan Nikravesh
A dissertation submitted in partial fulfillment of the requirements for the degree of
Doctor of Philosophy
(Computer Science and Engineering) in The University of Michigan
2018
Doctoral Committee:
Professor Z. Morley Mao, Chair Professor Jason N. Flinn
Associate Professor Harsha V. Madhyastha Assistant Professor Neda Masoud
Ashkan Nikravesh [email protected]
ORCID iD: 0000-0001-9562-5481
c
Ashkan Nikravesh 2018 All Rights Reserved
ACKNOWLEDGEMENTS
First and foremost, I would like to express my deepest gratitude to my advisor Profes-sor Morley Mao for her constant presence, continuous support, and constructive feedback throughout my Ph.D. None of this work would have been possible without her help and patience. It has been a true privilege to have her as my advisor.
I would also like to thank my thesis committee: Professor Jason Flinn, Professor Harsha Madhyastha, and Professor Neda Masoud for the helpful discussions and their constructive comments. I am also lucky to have had the opportunity to work with Professor David Choffnes, Professor Feng Qian, and Professor Harsha Madhyastha. They have been instru-mental in the completion of this dissertation.
I am very glad that I have had the opportunity to work with Eric Osterweil, my mentor at Verisign. I am very grateful for his support and guidance during my internship. I would also like to thank Shubho Sen, Professor Geoffrey Challen, and Scott Haseley for the fruitful discussions we had in the meetings.
During my Ph.D., I was fortunate to have great graduate student collaborators, including Shichang Xu, Sanae Rosen, David Ke Hong, and Hongyi Yao among many others. I have truly enjoyed working with them. I would also like to thank the rest of RobustNet research group members for many great conversations we had and projects that we did together: Qi Alfred Chen, Yihua Guo, Mehrdad Moradi, Yuru Shao, Yunhan Jia, Xiao Xu.
I am also very grateful to my dear friends in Ann Arbor who have helped me whenever I need them: Mahdi Aghadjani, Morteza Sheikhsofla, Hamed Yousefi, Amir Rahmati, and Alireza Goshtasbi.
Above all, I would like to thank my parents and my sister for their constant and endless source of encouragement, love, support, guidance, and care. I owe all my accomplishments to them.
TABLE OF CONTENTS
DEDICATION . . . ii
ACKNOWLEDGEMENTS . . . iii
LIST OF FIGURES . . . ix
LIST OF TABLES . . . xii
ABSTRACT. . . xiii
CHAPTER I. Introduction . . . 1
1.1 Contributions . . . 4
1.1.1 Mobile Network Performance from User Devices: A Longitudinal, Multidimensional Analysis . . . 4
1.1.2 Mobilyzer: An Open Platform for Controllable Mobile Network Measurements . . . 5
1.1.3 An In-depth Understanding of Multipath TCP on Mo-bile Devices: Measurement and System Design . . . 5
1.1.4 Design and Implementation of an HTTP-based Multi-path Solution for Mobile Devices . . . 6
1.1.5 QoE Inference and Improvement Without End-Host Control . . . 7
1.2 Organization . . . 8
II. Related Work . . . 9
2.1 Building Systems for Measuring Mobile Performance . . . 9
2.2 Studies on Mobile Multipath . . . 11
III. Mobile Network Performance from User Devices: A Longitudinal,
Multidimensional Analysis . . . 15
3.1 Introduction . . . 15
3.2 Methodology and Dataset . . . 16
3.3 Data Analysis . . . 18
3.3.1 Performance across carriers . . . 18
3.3.2 Performance across different locations . . . 20
3.3.3 Performance over time . . . 22
3.3.4 Performance Degradation: Root Causes . . . 24
3.4 Conclusion . . . 26
IV. Mobilyzer: An Open Platform for Controllable Mobile Network Mea-surements . . . 28
4.1 Introduction . . . 28
4.2 Goals . . . 32
4.2.1 Standard, Easy-to-use Measurements . . . 32
4.2.2 Measurement Isolation . . . 33
4.2.3 Global Coordination . . . 33
4.2.4 Incentives for Adoption . . . 33
4.2.5 Nongoals . . . 35
4.3 Design and Implementation . . . 36
4.3.1 Overview . . . 36
4.3.2 Measurement Library and API . . . 38
4.3.3 Local Measurement Scheduler . . . 41
4.3.4 Global Manager . . . 44 4.3.5 Security . . . 46 4.4 Evaluation . . . 47 4.4.1 Deployment Experience . . . 47 4.4.2 Measurement Isolation . . . 48 4.4.3 Microbenchmarks . . . 49 4.4.4 Server Scheduling . . . 56
4.5 New Measurements Enabled . . . 58
4.5.1 Page Load Time Measurement . . . 59
4.5.2 Video QoE Measurement . . . 67
4.6 Conclusion . . . 70
V. An In-depth Understanding of Mobile Multipath: Measurement and System Design . . . 71
5.1 Introduction . . . 71
5.2 Measurement Methodology . . . 74
5.2.1 Multipath Configuration For User Trial . . . 76
5.3 Measurement Results . . . 78
5.3.1 Passive Measurements of User Study . . . 78
5.3.2 Active Measurements of User Study . . . 83
5.3.3 Other Applications over MPTCP: Voice-over-IP and In-stant Messengers . . . 85
5.3.4 Interplay between Multipath and CDN . . . 87
5.4 MPFlex: A Flexible Architecture For Mobile Multipath . . . 91
5.4.1 The MPFlex Architecture . . . 91
5.4.2 MPFlex Design and Implementation . . . 93
5.5 Evaluation of MPFlex . . . 96
5.5.1 File Download . . . 97
5.5.2 Web Browsing . . . 97
5.5.3 Applying Multipath Policies . . . 98
5.5.4 Impact of Proxy Location . . . 99
5.5.5 System Overhead . . . 100
5.6 Concluding Remarks . . . 100
VI. Design and Implementation of an HTTP-based Multipath Solution for Mobile Devices. . . 102
6.1 Introduction . . . 102
6.2 Motivation . . . 104
6.2.1 MPTCP Adoption . . . 105
6.2.2 CDN Server Selection . . . 105
6.2.3 Anycast and Load Balancing . . . 111
6.2.4 Flexible Transport Protocol Support . . . 111
6.3 Design . . . 112
6.3.1 Our Algorithm . . . 116
6.3.2 Implementation Challenges . . . 120
6.4 Application Specific Optimization and Interaction . . . 125
6.4.1 Video Streaming Applications . . . 126
6.4.2 Web based Apps . . . 127
6.5 Implementation . . . 127
6.6 Evaluation . . . 128
6.6.1 Experimental Setup . . . 128
6.6.2 Tail Byte Elimination . . . 128
6.6.3 Single File Download . . . 130
6.6.4 Video Streaming . . . 132
6.7 Conclusion . . . 134
VII. QoE Inference and Improvement Without End-Host Control . . . 135
7.1 Introduction . . . 135
7.2 Motivating Examples . . . 138
7.3.1 Recording and Identifying App Usages . . . 142
7.3.2 Replaying App Usage Traces . . . 145
7.3.3 QoE Measurement . . . 146
7.3.4 QoS-to-QoE Mapping . . . 148
7.3.5 Adaptive Sampling of the QoS Metric Space . . . 152
7.3.6 Evaluation . . . 154
7.3.7 Impact of System-level QoS Metrics . . . 154
7.4 QOEBOX: QoE-Aware Traffic Management . . . 155
7.4.1 App Name and Usage Detection . . . 156
7.4.2 QoS Measurement . . . 158
7.4.3 Traffic Shaping Rule Generation . . . 159
7.5 Case Studies . . . 160
7.5.1 Classifying and Prioritizing Different Traffic Types . . . 160
7.5.2 QoE-Aware Bandwidth Allocation . . . 163
7.6 Conclusion . . . 168
VIII. Conclusion . . . 169
LIST OF FIGURES
Figure
3.1 Throughput and latency across access technology and carriers. . . 19
3.2 Verizon LTE Ping RTT in Different Locations . . . 21
3.3 Time of day pattern of HTTP throughput . . . 23
3.4 Weighted Moving Average Error (Median Ping RTT,W = 2) . . . 23
3.5 Performance Degradation in: (a)T-Mobile HSDPA network in Bay Area due to server selection flapping from Bay Area to Seattle (b)T-Mobile HSDPA network in Seattle due to change in ingress point of transit AS between T-Mobile and Google (c) Verizon LTE network in Bay Area. . . 25
3.6 Impact of signal strength on latency, packet loss, and throughput. . . 26
4.1 Mobilyzerarchitecture (shaded region). Apps (top) include theMobilyzer library, which provides an API to issue network measurements, and a scheduler service (middle) that provides measurement management and isolation. The scheduler communicates with a global manager (bottom) to fetch measurement requests and report measurement results. . . 32
4.2 Using sequential tasks to build a simple diagnosis task. . . 41
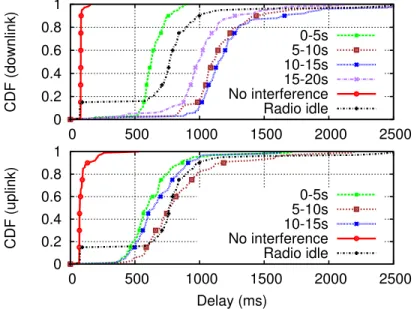
4.3 Impact of throughput measurements (grouped into time periods) and ra-dio state on measured RTT. Results vary with rara-dio state, and upstream or downstream cross-traffic with varying throughput. Mobilyzerprovides strict control over these kinds of dependencies. . . 48
4.4 Scheduling overhead for aMobilyzermeasurement task. . . 50
4.5 IPC overhead for DNS burst sizes. . . 50
4.6 IPC and schedule overhead, 1 app. . . 51
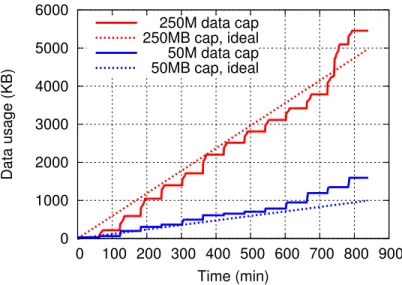
4.7 Data usage under different data caps. . . 54
4.8 CDF of CDN-selected server rank (in terms of latency) compared to ten other CDN servers. WiFi and cellular redirections have similar distribu-tions, so we show only the aggregated result here. . . 55
4.9 CDF of ping latency difference between the CDN-selected server and the CDN IP with lowest latency. . . 55
4.10 Navigation timing data from crowdsourced PLT measurements, compris-ing 80 users durcompris-ing six weeks (2000 measurements per page on average). . 61
4.11 Browser computation time versus PLT and PIT. The fraction of load time due to computation is variable, but often a significant portion. . . 62
4.12 Computation time of different mobile processors (30 distinct device mod-els) compared with desktop. . . 63 4.13 Computation time in mobile devices can account for more than half of
the PLT. (Desktop was connected to a 3Mbps broadband internet service.) 63 4.14 Comparing BBA with CBA bitrates and throughput for users with
throughputs that are higher and lower than the maximum bitrate. . . 66 4.15 Timeline plots of typical throughputs and bitrate adaptations for BBA
and CBA. BBA tends to achieve higher average bitrates than CBA with minimal impact on rebuffering. . . 66 4.16 BBA leads to lower rebuffering rates compared with CBA, particularly
for users with lower throughput. . . 67 5.1 Distributions of the fractions of payload transmitted over the primary
sub-flow, across all MPTCP flows. . . 75 5.2 Distributions of DL/UL bytes in a SPTCP/MPTCP flow. . . 75 5.3 Distributions of the handshake delays of MPTCP secondary subflow. . . . 75 5.4 Average TCP throughput for different flow size groups. . . 80 5.5 Fraction of data delivered by cellular versus the fraction of energy
con-sumed by cellular for popular apps. . . 80 5.6 Throughput ratio of MPTCP (WiFi primary) to SPTCP over WiFi for
4,371 back-to-back throughput measurements for different value of LTE signal strength. . . 81 5.7 Crowd-sourced video streaming measurements (1,500 measurements in
total) . . . 84 5.8 QoE and power consumption of VoIP under different SPTCP/MPTCP
settings. . . 85 5.9 Example: CDN sever selection over multipath. . . 87 5.10 File download time from different CDN servers, averaged over 10 runs.
Shaded blue is a “what-if” scenario. . . 87 5.11 Distributions of path latency differences for 190 out of Alexa top-500
websites. Refer to Figure 5.9 for the four paths. . . 88 5.12 TheMPFlexarchitecture. . . 92 5.13 Components within anMPFlexendpoint. . . 93 5.14 Single file download over MPTCP and MPFlex (best SPTCP results
shown only for small downloads). . . 95 5.15 Transfer many short flows over MPTCP andMPFlex. . . 96 5.16 Fetch web pages over MPTCP andMPFlex. . . 96 5.17 Case study: MPTCP applies multipath to all traffic, while MPFlexdoes
that selectively based on user policy. . . 98 5.18 Performance impact ofMPFlexproxy location. . . 98 6.1 Netflix server selection in the context of MPTCP. . . 106 6.2 Impact of sub-optimal server selection on the download time of Netflix
video data chunks. . . 106 6.3 Impact of sub-optimal server selection on the performance of MPTCP
(emulation). . . 107 6.4 Crowd-sourced latency measurement of multipath server selection. . . 109
6.5 Comparing MPTCP performance with constant chunk size scheme with different sizes when downloading 512KB and 1MB files. . . 112 6.6 Timeline of sending HTTP requests to download data chunks on WiFi
and cellular interfaces. . . 113 6.7 Two iterations of the byte range adjustment. Grayed area shows the
downloaded parts of the data chunks. . . 114 6.8 Performance of MP-HTTP scheduler for downloading a 2MB file on a
device connected to 10Mbps WiFi and 5Mbps cellular network. Y-axis shows the byte ranges requested on different interfaces. . . 115 6.9 Timeline of sending HTTP requests and HTTP/2.0 control frames to
download two chunks of data, S1 and S2, on a single connection. . . 119 6.10 Comparing the performance of the proposed tail byte elimination with
canceling a stream using HTTP/2.0RST STREAMframe. . . 129 6.11 Compare performance of different schedulers under three bandwidth
set-tings. . . 129 6.12 Compare performance of different schedulers under real bandwidth profiles.130 6.13 Compare the video quality of different schedulers under three capped
bandwidth profiles. . . 133 6.14 Compare the video quality of different schedulers under real bandwidth
profiles. . . 133 7.1 Problem of resource management for two scenarios, in which two users
using different apps at the same time. . . 139 7.2 Number of distinct usages for top 100 apps. . . 144 7.3 Distribution of the frequency of interactions for each usage for six
popu-lar apps. . . 145 7.4 Our experimental setup for generating QoS-to-QoE mappings . . . 146 7.5 Mapping (a) latency and (b) bandwidth to launch time. . . 148 7.6 Mapping various QoS metrics to frame rate (QoE) for AppRTC and Skype 151 7.7 Mapping bandwidth (QoS metric) to video bitrate (QoE metric) for
Youtube, Microsoft Smooth Streaming, and Apple HLS . . . 151 7.8 Sampled QoS values based on Algorithm 2 . . . 153 7.9 Compare accuracy of adaptive sampling with regression-based modelings. 153 7.10 QOEBOXarchitecture. . . 155 7.11 App response delay of five usage types under three scenarios: without
concurrent video traffic, with video traffic, and with prioritization. . . 155 7.12 Frame rate of AppRTC and Skype w/o and with video traffic, and with
prioritization. . . 163 7.13 Video bitrate of 10 users streaming video at random times and duration. . 164 7.14 Simulation results of different number of users streaming video under
100Mbps bandwidth. . . 164 7.15 Total MOS of 10 users streaming video and downloading a file at the
LIST OF TABLES
Table
3.1 Number of Measurement and Carriers for the Network Technologies . . . 18
4.1 Measurement types supported byMobilyzer. . . 32
4.2 Mobilyzerkey API functions to support issuing and controlling measure-ment tasks. . . 36
4.3 Lines of code (LoC) for open-source measurement apps. By integrating Mobilyzer into existing apps, developers can save thousands of lines of code. . . 48
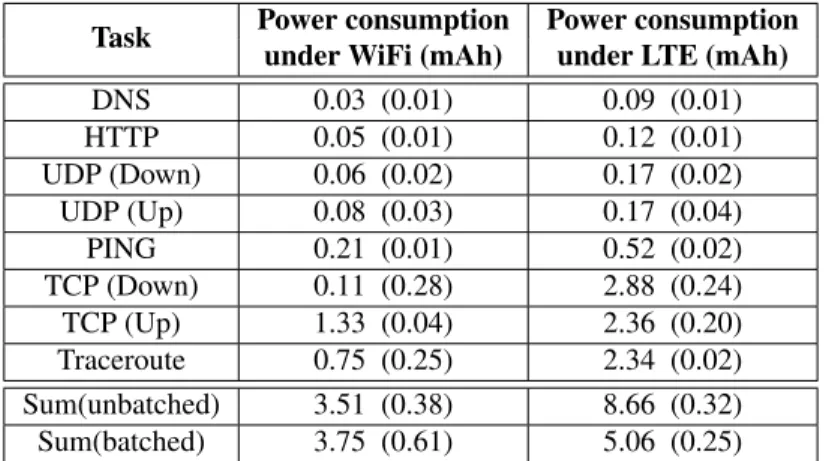
4.4 Power consumption of Mobilyzer: each cell lists the average, then the standard deviation in parentheses. . . 52
5.1 Summary of the findings and proposed improvement . . . 74
5.2 Statistics of the user study dataset. . . 77
5.3 Comparison of three multipath proxy solutions. . . 93
ABSTRACT
In today’s rapidly growing smartphone society, the time users are spending on their smartphones is continuing to grow and mobile applications are becoming the primary medium for providing services and content to users. With such fast paced growth in smart-phone usage, cellular carriers and internet service providers continuously upgrade their infrastructure to the latest technologies and expand their capacities to improve the perfor-mance and reliability of their network and to satisfy exploding user demand for mobile data. On the other side of the spectrum, content providers and e-commerce companies adopt the latest protocols and techniques to provide smooth and feature-rich user experiences on their applications.
To ensure a good quality of experience, monitoring how applications perform on users’ devices is necessary. Often, network and content providers lack such visibility into the end-user application performance. In this dissertation, we demonstrate that having vis-ibility into the end-user perceived performance, through system design for efficient and coordinated active and passive measurements of end-user application and network per-formance, is crucial for detecting, diagnosing, and addressing performance problems on mobile devices.My dissertation consists of three projects to support this statement. First, to provide such continuous monitoring on smartphones with constrained resources that oper-ate in such a highly dynamic mobile environment, we devise efficient, adaptive, and coordi-nated systems, as a platform, for active and passive measurements of end-user performance. Second, using this platform and other passive data collection techniques, we conduct an in-depth user trial of mobile multipath to understand how Multipath TCP (MPTCP) performs
in practice. Our measurement study reveals several limitations of MPTCP. Based on the insights gained from our measurement study, we propose two different schemes to address the identified limitations of MPTCP. Last, we show how to provide visibility into the end-user application performance for internet providers and in particular home WiFi routers by passively monitoring users’ traffic and utilizing per-app models mapping various network quality of service (QoS) metrics to the application performance.
CHAPTER I
Introduction
Mobile data traffic has grown 18-fold over the past five years [8]. As of March 2017, be-tween 2.8 and 2.2 million apps were available for Android and iOS users, respectively [32]. For a single type of service or app, users are able to choose between a wide variety of apps providing the same service, including social media, messaging, news, media and entertain-ment, and shopping apps.
In such a hyper-competitive app market, app developers try to deliver the most sat-isfying service to their clients by improving the performance of their app. To do so, they continuously propose, implement, or adopt new transport-layer network protocols and application-layer adaptation techniques that better fit mobile networks with highly dynamic network conditions. For instance, to reduce latency, Google proposed QUIC in 2012 and has been using that ever since. QUIC is by default enabled in the Chrome browser and about half of all requests from Chrome to Google web servers happen over QUIC [38]. Facebook has also built an experimental Zero protocol over TCP based on QUIC’s crypto protocol [5], to provide fast and secure data transfers on its app. Apple has been using Mul-tipath TCP (MPTCP) to improve the reliability of its digital assistant (Siri), since 2013.
Along with app developers’ efforts, wireless carriers are also heavily invested and en-gaged in updating their infrastructure and adopting the next generations of mobile commu-nication technology to better accommodate high bandwidth demands of their users. For
instance, AT&T plans to introduce mobile 5G service in a dozen markets by late 2018 [4]. When adopting a new protocol or technology, understanding how it performs on users’ devices in this highly dynamic and mobile environment is important. To be able to identify inefficiencies in its design, finding factors impacting performance, and detecting problems causing performance degradation, continuous measurement of performance on the users’ devices is essential. Ideally, app developers and internet service providers should be able to collect performance measurement data from any mobile device on any network at any time. With this information, wireless carriers could study the factors impacting performance and detect problems causing degradation, and application developers could tune and improve their service quality. This information is even useful for the users, as they could evaluate the services they are paying for.
In this dissertation, through three main projects, we design systems and techniques to measure andinfer end-user application performance for various types of apps. We char-acterize the performance of Internet-scale systems and protocols by conducting in-lab and crowd-sourced measurement studies, diagnose their performance bottlenecks, and propose solutions to address them.
In the first project [131, 134], we first study end-to-end performance as seen from mo-bile devices, using a dataset of scheduled network measurements spanning more than 100 carriers over 17 months. We find that there are significant performance differences across carriers, access technologies, geographic regions, and over time. Further, we find that these variations themselves are not uniform, making network performance difficult to diagnose. Another reason that contributes to the fact that we are unable to find the root cause behind these variations is the lack of coordination and control over the scheduled measurements. Ideally, we would be able to dynamically change measurements’ parameters based on the collected results to factor out the impact of each individual element that might cause the observed performance degradation.
con-ductingcontrollable mobile network measurement experiments, calledMobilyzer. Mobi-lyzer provides visibility into the end-user application performance by supporting various types of complex application-layer measurements. It enables performance evaluation of Internet-scale systems (e.g., network protocols, video adaptation schemes, etc.) in the mo-bile environment through its support of coordinated measurements among large numbers of vantage points and efficient use of scarce resources on mobile devices. UsingMobilyzer, we could identify and diagnose cases of CDN inefficiency, characterize and decompose page load time delays for web browsing, and evaluate alternative video bitrate adaptation schemes in the mobile environment. In most of the projects discussed in this thesis, we use Mobilyzeras the main platform for conducting large-scale crowd-sourced measurement of mobile network and application performance.
In the second project [132], we augment the platform we developed in the first project with passive measurement techniques to conduct an in-depth measurement study of how mobile Multipath TCP (MPTCP) performs in the wild. In this project, our goal is to quan-tify the performance benefits MPTCP can offer in real-world settings and to measure its energy footprint on real users’ devices. To achieve this goal, we leverage Mobilyzer to crowd-source active measurements of application QoE on participants’ phones and capture how they perform in multipath settings and under diverse network conditions. Our mea-surement study reveals several limitations of MPTCP, including its poor interaction with short flows, lack of infrastructural support for multipath policy, and suboptimal CDN server selection. To address these limitations, we propose two solutions: (1)MPFlex, a transport layer solution that employs multiplexing to improve the performance of short flows and enables the apps to enforce their multipath policy; (2) MP-HTTP, an application layer so-lution which operates on top of HTTP and is easier to adopt. MP-HTTP addresses the sub-optimal CDN server selection and provides comparable performance to the MPTCP scheduler.
over all the devices and applications, in the last project, we propose a mechanism to infer end-user application performance by passively monitoring users’ traffic. In this project, our proposed approach for inferring QoE corresponding to a traffic flow is to rely on models that can map the flow’s QoS metrics to the corresponding app’s QoE metrics. We generate these model by developing an app-independent tool that is capable of recording and replaying users’ interactions for different types of apps under different QoS values. These generated models enable any entity that can observe an app’s network traffic, including ISPs and access points, to infer end-user app performance. We demonstrate how the model can be utilized for the purpose of traffic management for wireless access points by designing, implementing, and evaluating two traffic management schemes: latency-sensitive traffic prioritization and a novel bandwidth allocation scheme for bandwidth-intensive apps. We show that for both schemes, we can significantly improve various app performance metrics that reflect user-perceived performance.
1.1
Contributions
The following paragraphs summarize the major findings and contributions of this thesis, organized by the papers.
1.1.1 Mobile Network Performance from User Devices: A Longitudinal, Multidi-mensional Analysis
In this paper, we took a first look at end-to-end performance as seen from mobile de-vices, using a dataset of scheduled network measurements spanning more than 100 carriers over 17 months. In particular, we find that all carriers exhibit significant variance in end-to-end performance in terms of latency and throughput. To explain this variance, we in-vestigate geographic and temporal properties of network performance. While we find that these properties account for some differences in performance, importantly we observe that performance is inherently unstable, with some carriers providing relatively more or less
predictable performance. Last, we identify that routing (i.e., inefficient paths) and signal strength are alternative sources of variance in latency and throughput.
1.1.2 Mobilyzer: An Open Platform for Controllable Mobile Network Measurements In this project, we design and build Mobilyzer, a unified platform for conducting net-work measurements in the mobile environment. The main contributions of this paper are:
• Design and implementation ofMobilyzer, a platform for conducting mobile network measurement experiments in a principled manner, that includes an API for issuing network measurements using a standard suite of tools, a cloud-based global manager that dynamically deploys measurement experiments to devices according to avail-able resources, device properties and prior measurement results and manages data collection from participating devices.
• Evaluation ofMobilyzerin terms of new measurement studies that it enables, using Mobilyzer’s support for coordinated measurements among large numbers of vantage points to evaluate the performance of Internet-scale systems. For instance, we use Mobilyzerto identify and diagnose cases of CDN inefficiency, characterize and de-compose page load time delays for Web browsing, and evaluate alternative video bitrate adaptation schemes in the mobile environment.
1.1.3 An In-depth Understanding of Multipath TCP on Mobile Devices: Measure-ment and System Design
In this paper, we conduct an in-depth measurement-driven study of multipath over mo-bile devices, with the goal of providing key knowledge and vital clues for evolving the mobile multipath design. More specifically, our key contributions are as follows:
• We launch an IRB-approved user trial by collecting network traces from real users’ smartphones with MPTCP enabled. Leveraging the unique data we collected, we
analyzed MPTCP behaviors“in the wild”, including multipath availability, path uti-lization, handshake latency, TCP throughput, web page load time, video streaming bitrate. From the user study, we find that multipath is widely available and it in-curs rather complex interactions with applications due to their diverse traffic patterns and QoE metrics. MPTCP’s suboptimal performance often stems from three factors: short flow duration and excessive delay of subflows’ handshakes.
• By applying previously validated single-path and multipath radio energy models on real users’ network traffic, we find that properly using multipath incurs reasonable and manageable overhead. However, blindly applying MPTCP to all traffic, as is usually done today, increases users’ average radio energy by 1.08X.
• We find that under multipath, the state-of-the-art DNS-based server selection often leads to suboptimal server selection. This is attributed to the fact that CDNs DNS infrastructure is unaware of other subflows available to the client. We demonstrate its real world importance by probing Alexa top-500 websites and provide recommenda-tions for multipath-aware server selection.
• To address the identified limitations of MPTCP, we propose a flexible software ar-chitecture of mobile multipath, called MPFlex. MPFlex performs transparent mul-tiplexing to improve multipath performance and provides an ideal vantage point for flexibly realizing user-specified multipath policies.
1.1.4 Design and Implementation of an HTTP-based Multipath Solution for Mobile Devices
In this paper, we propose Multipath HTTP (MP-HTTP), a new client side multipath so-lution with optimized scheduler that operates on top of HTTP. MP-HTTP can be integrated into applications seamlessly,i.e., without any modification to the client and server. They key contributions are:
• We design a client side multipath scheduler on top of HTTP/2.0 that aims to achieve simultaneous chunk completion time on WiFi and cellular interfaces and fully utilize their bandwidth.
• We implement MP-HTTP scheduler for Android devices and compare its perfor-mance with MPTCP and other HTTP-based schedulers by conducting extensive mea-surements in realistic settings. Our results show that MP-HTTP provides comparable performance to MPTCP scheduler and brings significant performance boost com-pared to other state-of-the-art HTTP- based schedulers.
• As one of the main applications of MP-HTTP, we further optimize its performance for ABR video streaming. We include MP-HTTP into a popular video player frame-work and show that under realistic bandwidth settings, its performance is close to MPTCP and it outperforms other state-of-the-art HTTP-based schedulers.
1.1.5 QoE Inference and Improvement Without End-Host Control
In this paper, we propose offline generation of per-app models mapping app-independent QoS metrics to app-specific performance metrics. This enables any entity that can passively observe an app’s network traffic—including ISPs and access points—to infer the end-user app performance. In particular, our contributions are:
• We generate the models by replaying real users’ common interactions in popular interactive apps, two popular video conferencing apps, and three video streaming apps, with significantly different QoE metrics. We identify important combination of QoS values that causes change in QoE of these apps using a new adaptive sampling technique.
• We design and implement QOEBOX, a proxy-based QoE-centric traffic management framework. QOEBOXmaps the traffic belonging to an app to its corresponding QoE model, and invokes custom modules to apply traffic shaping policies.
• We showcase how the models can be utilized for the purpose of traffic management by designing, implementing, and evaluating two QoE-aware traffic managements schemes on WiFi access points: prioritizing latency sensitive traffic and an opti-mal fair bandwidth allocation for bandwidth intensive apps. We show that for both schemes, we can significantly improve various QoE metrics, including frame rate, app responsiveness, and video bitrate, without modifying the end-host or requiring a very precise model.
1.2
Organization
The rest of this dissertation is organized as follows. We first provide an overview of related work in chapter 2. In chapter 3, we present a measurement study of cellular net-work performance. Based on the insights gained from this study, we discuss the design and implementation of a platform for conducting network measurement on mobile devices in chapter 4. Using this platform, we study the performance of Multipath TCP on real users’ devices in chapter 5. Our measurement results indicate that MPTCP suffers from a few lim-itations and in chapter 6, we propose a client-side scheduler to address these limlim-itations. Last, in chapter 7, we propose an approach for inferring and improving end-users’ appli-cation performance by passively monitoring their traffic. This enables various entities that can monitor users’ traffic, including wireless carriers and ISPs, to infer end-user applica-tion performance without requiring to run any active measurements. Finally, in chapter 8, we conclude with a summary of the contributions of this work and discussion of potential future work.
CHAPTER II
Related Work
The projects described in this dissertation build upon and complement a substantial amount of prior work. In this chapter we discuss the prior work and highlight their lim-itations that we address. These related studies are organized into three main categories according to the three main projects discussed in this dissertation.
2.1
Building Systems for Measuring Mobile Performance
Many previous studies attempt to improve our visibility into and understanding of mo-bile network performance. We broadly categorize them in to research platforms, platforms deployed by network operators, and measurement apps.
Existing research platforms.There are many successful testbeds deployed such as Planet-Lab [142], RIPE Atlas [154], and BISMark [170], and in our first project (i.e., Mobilyzer), we uses M-Lab [120] servers as targets for many measurement tests. These are general-purpose experimentation platforms that require deployment of infrastructure and do not operate in the mobile environment. These systems are insufficient alone for understanding mobile networks because mobile networks generally use firewall/NATs [179].
Our first project shares many goals with Dasu [157], but differ fundamentally in that properly characterizing network performance in mobile environment requires different strategies than in the wired/broadband environment due to scarce resources and
measure-ment interference. Seattle [63] is a general-purpose platform that supports deploying code on Android devices, and it shares many goals withMobilyzer. It does not provide network measurement isolation, but many of its device management and security features can be integrated intoMobilyzer.
View from operators. Operators and manufacturers such as AT&T and Alcatel-Lucent have deployed in-network monitoring devices that passively capture a detailed view of network flows traversing their mobile infrastructure [73, 53]. Several studies use these passive measurements to understand network traffic generated by subscriber devices, with important applications to traffic engineering, performance characterization and se-curity [87, 146, 181, 53, 175, 115, 155]. However, this approach does not allow the carrier to understand the performance experienced at the mobile device. For example, when the throughput for a network flow suddenly changes, it is difficult to infer from passive mea-surements alone whether it is due to wireless congestion, signal strength, and/or simply normal application behavior.
Existing measurement apps. Motivating the need for a mobile measurement library, sev-eral academic, governmental and commercial mobile performance measurement tools have been released recently. The FCC released a network measurement app [83] to characterize mobile broadband in the US but the system is closed and data is not publicly available. Sev-eral commercial apps measure mobile Internet performance by collecting measurements such as ping latency and throughput [167, 64, 136]. However, because the source code is closed, the methodology is under-specified, and the datasets tightly controlled, it is difficult for the research community and end-users to draw sound conclusions. Further, these tests are generated on-demand by end-users, creating a strong selection bias in the data, as users may be more likely to run tests when they experience problems.
A number of research projects use apps to gather network measurements from hundreds or thousands of mobile devices [164, 97, 143, 112, 162, 161, 123, 126]. Such measure-ments reveal information not visible from passive in-network measuremeasure-ments, such as radio
state, signal strength and the interaction between content providers and network infrastruc-ture [188, 180, 101, 164]. Further, these measurements reveal information across carriers, allowing researchers to understand different ISP network policies and performance [179]. Such one-off studies provide a useful snapshot of mobile networks, but they do not support longitudinal studies that inform how mobile network performance, reliability and policy changes over time, nor do they support targeted measurements that are required to under-stand the underlying reasons for observed network behavior.
Our first project is also motivated by other efforts in building measurement libraries, especially on mobile platforms. For example, Insight [139] and AppInsight [152] offer platforms for instrumenting and measuring application performance, rather than network measurements.
2.2
Studies on Mobile Multipath
In this section, we discuss prior work on mobile multipath in four categories.
Performance Characterization of Mobile Multipath. Although the potentials of mobile multipath have been known for a long time [55], it has recently become a hot research topic as fueled by smartphones and MPTCP. Chen et al. [70] studied performance of MPTCP over 3G/4G and WiFi. A similar studied was performed by Denget al. [77] to compare the performance between single-path and multipath. Both studies focus on file download using controlled experiments. Hanet al. [92] investigated how MPTCP helps improve web performance by in-lab experiments. They found SPDY [41] better interacts with multipath compared to HTTP/1.1, due to multiplexing. We make a further step by proposing a flex-ible transport-layer multiplexing infrastructure for multipath, which provides considerably more benefits than application-layer multiplexing does.
De Conincket al. [72] conducted a measurement study of MPTCP involving 12 mobile users. They focus on transport layer characteristics of MPTCP such as RTT, retransmission, and reinjection. In contrast, our user study focuses not only on MPTCP itself, but also on
the cross-layer interactions. We also combine passive and active measurements in our study to get a thorough understanding of applications’ performance and energy utilization in the wild.
Multipath Energy. Some studies also examined the energy aspect of multipath. Nikaet al. [130] characterized energy and performance of multipath in outdoor environments. Very recently, Lim et al. [172] improves MPTCP to make it energy-aware. Peng et al. [140] also proposes algorithms that tradeoff throughput performance and energy consumption for MPTCP. We leveraged the multipath power models derived by some of these work, and use them to characterize multipath energy consumption in real-world.
Applications of Mobile Multipath. Besides improving existing applications’ perfor-mance, MPTCP provides opportunities for enabling new use cases. Mobile Kibbutz [129] is a system allowing nearby users share their links with each other via multiple shorter range wireless links. MSPlayer [71] is a YouTube client that fetches multiple video sources over multipath to improve video experience. Croitoruet al.[74] leveraged MPTCP to achieve seamless mobility in WiFi by letting a client connect to multiple APs on the same channel. Our work complements these specific systems by characterizing and improving MPTCP itself. There are other systems dealing with multiple interfaces in general, such as energy-efficient interface selection [141] and utilization of concurrent WiFi APs [165].
2.3
Studies on QoE Inference
There has been a rich body of literature that studies QoS and QoE measurements. In this section, we summarize related work that leverage predictive models to estimating QoE within the network.
QoE Predictive Models. There is a rich body of work that leverages predictive models to estimating video QoE within the network [159, 66, 106]. Schatzet al.[159] presented methods to estimate the number of stalling events and their duration for YouTube using network level measurements. Casaset al. [66] presented YOUQMON, which can detect
stalling events in YouTube video stream by analyzing the traffic collected in 3G core net-work, and then map it to MOS.Compared to these video streaming specific methods, our proposed modeling is more broadly applicable to a wide range of apps and QoE metrics. The closest work to ours is Prometheus [51], which estimates app QoE using passive net-work measurement, and then uses linear regression to map netnet-work traffic features to the binary classification of QoE. In contrast, we argue that the QoS-to-QoE mapping maynot be linear, due to (1) the complex interaction between app protocol and network conditions, and (2) the non-linear relationship between QoS metrics (e.g.,bandwidth) and user satisfac-tion [108]. Moreover, to gather training data for predicsatisfac-tion, Prometheus relies on passive measurement of QoS from real mobile devices, while we propose an offline sampling tech-nique that efficiently samples QoS values close to the boundary of different QoE classes. ExBox [67] is a QoE-aware admission control mechanism for WiFi networks that leverages IQX hypothesis model [84] to estimate QoE of incoming flows and then classifies them as admissible or non-admissible.
QoE Aware Traffic Management. Traffic prioritization is a known technique to mitigate in-network bufferbloat [128, 99, 90]. Prioritizing traffic from certain applications using per-class queuing is also recommended by IETF as one of the best practices for active queue management on network devices [56]. As a part of IEEE 802.11e [19] standard, Wire-less Multimedia (WMM) service is proposed and supported by commercial WiFi routers to classify and prioritize the traffic of certain types of apps. However, it requires end-device input and classification. In fact WMM service has been always enabled in all our exper-iments. Bozkurt et al. [60] and Martin et al. [119] propose traffic management schemes for home networks that rely on users’ preference and apps’ input, respectively, to prior-itize the traffic. Jiang et al. [102] propose a network paradigm where apps and network providers can collaborate by exchanging information such as QoE data. In comparison to these approaches, our proposed traffic management framework is designed for unmodified and unaware apps,i.e., it does not need to communicate with end-host and it does not
re-quire users’ input. It relies on the QoS-to-QoE models to determine whether a usage traffic is latency sensitive and should be prioritized. Several prior efforts focus on the problem of bandwidth allocationfor various type of apps, specifically video traffic. FESTIVE [104] is a client side solution which provides a trade-off between fairness, stability and efficiency. Q-Point [79] and QFF [86] are SDN-based approaches to address fairness and maximize aggregated QoE of multiple competing clients simultaneously watching video. In compar-ison with these approaches that focus on a single type of app, our bandwidth allocation technique can be applied to different types of bandwidth intensive apps. As a practical QoE-aware traffic management framework, we cover all types of apps, and classify and allocate the resources with respect to their QoS-to-QoE model. Bozkurtet al.[60] present Contextual Router for home networks, which incorporates users’ preferences and exist-ing app QoE models to prioritize traffic and determine bandwidth allocations, respectively. Martinet al.[119] propose a traffic prioritization approach for home routers that relies on apps’ hint to prioritize certain flows. Jianget al.[102] propose a network paradigm where application and network provides can collaborate by exchanging information such as QoE data. In comparison to these approaches, our proposed traffic management framework is designed for unmodified and unaware apps, i.e., it does not need to communicate with end-host and does not require users’ input.
CHAPTER III
Mobile Network Performance from User Devices: A
Longitudinal, Multidimensional Analysis
3.1
Introduction
Cellular networks are the fastest growing, most popular and least understood Inter-net systems. A particularly difficult challenge in this environment is capturing a view of network performance that is representative of conditions at end user devices. A number of factors frustrate our ability to capture this view. For instance, carriers enforce different poli-cies depending on the traffic types or geographic/social characteristics of different locations such as population [164, 173], causing user perceived performance to differ from advertised performance for access technologies. Other environmental factors have a significant impact on performance, including device model [97], mobility [118], network load [173], packet size [105, 116] and MAC-layer scheduling [118].
To account for various factors impacting Internet performance in mobile networks, we need pervasive network monitoring that samples a variety of devices across carriers, access technologies, locations and over time. This work takes a first look at such a view using data collected from controlled measurement experiments in 144 carriers during 17 months, comprising 11 cellular network technologies. We use this data to identify the patterns, trends, anomalies, and evolution of cellular networks’ performance.
This study demonstrates that characterizing and understanding the performance in to-day’s cellular networks is far from trivial. We find that all carriers exhibit significant ance in end-to-end performance in terms of latency and throughput. To explain this vari-ance, we investigate geographic and temporal properties of network performance. While we find that these properties account for some differences in performance, importantly we observe that performance is inherently unstable, with some carriers providing relatively more or less predictable performance. Last, we identify alternative sources of variance in performance that include routing and signal strength. An important open question is how to design a measurement platform that allows us to understand reasons behind most observed performance differences.
Our study differs from previous related work in that our study is longitudinal, continu-ous, pervasive and gathered from mobile devices using controlled experiments. In contrast, some related work [175, 115, 155] passively collected network traffic from cellular network infrastructure, using one month of data or less. These studies tend to be limited to a single carrier, hampering our ability to conduct meaningful comparisons across carriers. Other work collected network performance data at mobile devices [78, 164, 82], but did not use controlled experiments to capture a continuous view of performance.
Roadmap. We describe our methodology and dataset in §3.2, then present our findings regarding network performance across different network technologies, carriers, locations, and times in §3.3.1, §3.3.2, and §3.3.3 respectively. Then we study the root causes for performance degradation in§3.3.4 and conclude in§3.4.
3.2
Methodology and Dataset
In this chapter, we study cellular network performance using a broad longitudinal view of network behavior impacting user-perceived performance. To this end, we consider HTTP GET throughput, round trip time latency from ping, and DNS lookup time as end-to-end performance metrics. In addition to gathering raw performance data, we annotate our
mea-surements with path information gathered from traceroute, the identify of the device’s car-rier, its cellular network technology, signal strength, location and timestamp.
We focus on performance from mobile devices to Google, a large, popular content provider. We argue that Google is an ideal target for network measurements because it is highly available and well provisioned, making it easier to isolate network performance to cell networks vs. Google’s network. Focusing on these measurements, we identify the performance impact of carrier, network technology, location and time. To reason about the root cause behind performance changes, we use path information, DNS mappings and signal strength readings.
Our data is collected by two Android apps using a nearly identical codebase, Speedome-ter and Mobiperf.1 Speedometer is an internal Android app developed by Google and
de-ployed on hundreds of volunteer devices, mainly owned by Google employees. As such, the bulk of our dataset2is biased toward locations where Google employees live and work.
Speedometer collected the following measurements from 2011-10 to 2013-2 (17 months): 6.6M ping RTTs towww.google.com(each sample consists of 10 consecutive probes), 1.7M HTTP GETs to measure TCP throughput using a 224KB file hosted on a Google server, 0.4M UDP burst samples for measuring packet loss rate, 0.8M DNS resolutions of
google.com, and 0.8M traceroute (without hop RTTs) from 144 carriers and 9 network technologies. The dataset includes≈4-5 measurements per minute. Each measurement is annotated with device model, coarse-grained location information (k-anonymized latitude and longitude), timestamp, carrier, and network type.3 All users consented to participate in
the measurement study; the anonymization process is explained in the dataset’s README file. Because of anonymization, the number of users who participated in data collection is unknown.
We augment the Speedometer dataset with 11 months of data collected by Mobiperf.
1http://www.mobiperf.com/
2This dataset is publicly available at https://storage.cloud.google.com/speedometer 3https://github.com/Mobiperf/Speedometer
Table 3.1: Number of Measurement and Carriers for the Network Technologies
HSPA HSDPA UMTS EDGE GPRS LTE EVDO eHRPD 1xRTT # of Measurements 439K 2326K 563K 506K 58K 1460K 2183K 301K 68K
# of Carriers 50 111 96 85 48 7 8 2 3
Mobiperf conducts a superset of measurements in Speedometer, and notably adds signal strength information. The number of measurements collected by Mobiperf for each task ranges from 17K (HTTP GET) to 58K (ping RTT test) from 71 carriers. We use Mobiperf data to study the impact of signal strength on measurement results. Table 3.1 shows the number of measurements collected from the most frequently seen 9 network technologies (ordered by peak speed) for both GSM and CDMA technologies in the combined datasets.
3.3
Data Analysis
3.3.1 Performance across carriers
This section investigates the performance of five access technologies for each of sev-eral carriers. Our goal is to understand how observed performance matches with expecta-tions across access technologies, and how variable this performance is across carriers. In Fig. 3.1, we plot percentile distributions (P5, P25, median, P75, and P95) of the latency and throughput of 9 carriers from Asia, America, Europe, and Australia. We select these carriers based on their geographic locations and relatively large data sample sizes. One of the key observations is that performance varies significantly across carriers and access technologies; further, the range of values is also relatively large.
For carriers that have high latency, we use traceroute data to investigate if the cause is inefficient routes to Google [190]. However, approximately half of the carriers such as SFR (French Carrier) and Swisscom have direct peering points with Google, making this unlikely to be the cause for high latency.
For carriers such as AT&T, T-Mobile US, and Airtel (India), we observe high variability in latency. In the following subsections, we investigate whether this is explained by regional
100 1000
T-Mobile AT&T YesOptusSwisscom Vodafone(IE)NTT DoCoMoSFR SK TelecomEmobile
Ping RTT (ms) GPRS EDGE UMTS HSDPA HSPA (a) Ping RTT 10 100 1000
T-Mobile AT&T YesOptusSwisscom Vodafone(IE)NTT DoCoMoSFR SK TelecomEmobile
HTTP Throughput (Kbps) GPRS EDGE UMTS HSDPA HSPA
(b) HTTP GET throughput for downloading a 224KB file
Figure 3.1: Throughput and latency across access technology and carriers.
differences, time-of-day effects and/or other factors.
Surprisingly, we do not observe significant latency differences across access technolo-gies for some carriers. For example, the latency of UMTS, HSDPA, and HSPA in Emobile (Ireland), SK Telecom (Korea), and Swisscom are almost equal. Users in these networks
may not see noticeable differences in performance for delay-sensitive applications when upgrading to newer technologies.
In Fig. 3.1b, we plot HTTP throughput for downloading a 224KB file from a Google domain. Compared to ping RTT, the difference between the throughput of carriers is rela-tively smaller, indicating that the high variability in ping RTTs is often amortized over the duration of a transfer.
Note that the throughput for UMTS, HSDPA, and HSPA are almost identical. This occurs because the flow size is not sufficiently large to saturate the link for high-capacity technologies. This indicates a need for better low-cost techniques to estimate available ca-pacity in such networks [96]. However, the figure shows significant performance difference between GPRS/EDGE and other access technologies.
We observe that lower latency is generally correlated with higher HTTP GET through-put, but this depends on the carrier. We quantify this using the correlation coefficient be-tween HTTP throughput and ping RTT for specific carrier and network type. The strongest correlation coefficient observed was for Verizon LTE users with −0.53 and lowest was −0.01for T-Mobile HSDPA users, using one-hour buckets.
Having observed significant differences in performance within and between carriers, we now investigate some of the potential factors behind this variability.
3.3.2 Performance across different locations
We now investigate the impact of geography on network performance. We focus on four major US carriers in three US regions where our dataset is densest (New York, Seat-tle, and Bay Area). Each of these carriers exhibits different topologies (Internet egress, Google ingress and ASes between) in different regions, potentially leading to performance differences in each region.
Despite the variety in network topologies, we surprisingly find that for AT&T, T-Mobile, and Sprint, both of the latency and throughput were similar in these three
20 30 40 50 60 70 80 90 100 110
Oct 30 Nov 19 Dec 09 Dec 29 Jan 18 Feb 07 Feb 27 Mar 18 Apr 07 Apr 27 May 17 Jun 06
Ping RTT (ms)
Mean and Standard Error
Time (Days) 2011-2012 Bay Area
Seattle New York
Figure 3.2: Verizon LTE Ping RTT in Different Locations
tions. However, for Verizon, we observe different LTE performance in New York, Seattle, and Bay Area. Fig. 3.2 plots these latencies over time, and clearly show that the RTT la-tency for the Bay Area is lower than New York and Seattle areas. HTTP throughput in these regions exhibit similar patterns.
We use DNS data in the Seattle area and observe that 97% of DNS requests for
google.com resolve to an IP for a server in the Los Angeles area instead of Seattle, in part explaining the gap in latency between the two regions. For the NY area, our mea-surements did not provide enough geographic information to understand whether increased latency was due to path inefficiencies.
The key takeaway from this section is that geography alone doesn’t explain the variance in performance observed in the previous section; however, for one carrier (Verizon), it ex-plains some of it. Further, we observe that each region experiences changes in performance independently – the correlation of performance across regions for each carrier is negligibly small. Last, when correlating ping RTT and HTTP GET throughput within each region, we find higher correlations than carrier-wide correlations presented in the previous section. This further suggests that performance is affected by location.
3.3.3 Performance over time
We now analyze how performance depends on time – both in terms of time-of-day effects and the stability of measurement performance over time. These properties allow us to identify when to measure the network (e.g.,during known busy hours) and whennotto measure (e.g., at ten minute intervals), thus allowing us to efficiently allocate the limited measurement resources that users provide.
3.3.3.1 Time-of-day and long-term trends
Fig. 3.3 plots HTTP throughput for four major carriers in the US. As expected, through-put decreases (and variance tends to increase) during the busy hours for mobile usage (8AM to 7PM), likely due to higher load on the network. Interestingly, different carriers experi-ence minimum throughput at different times. T-Mobile and AT&T reach their minimum throughput at 1PM and 5PM, respectively; Sprint experiences minimum performance at 9PM and Verizon, two troughs occur at 8AM and 9PM. Last, these carriers experience different relative variations in performance during busy hours: AT&T and Sprint through-put drops by approximately a third during busy hours while Verizon drops by 25%, and T-Mobile by 16%.
Next, we investigate the long-term performance trends over the duration of our study, allowing us to tell if new cellular technologies and infrastructure are keeping pace with increased mobile Internet usage. Specifically, we look at the change in throughput and latency of carriers through time over consecutive days for each network technology they support in different areas. We did not observe improvement; despite technology upgrades, performance is highly variable over time and there is no statistically significant change during the observation period.
600 700 800 900 1000 1100 1200 1300 1400 0 2 4 6 8 10 12 14 16 18 20 22 24
HTTP Throughput (Kbps), Mean and Standard Error
Local Time from 0 (00:00) to 24 (24:00)
AT&T HSDPA Sprint EVDO_A T-Mobile HSDPA Verizon EVDO_A
Figure 3.3: Time of day pattern of HTTP throughput 0.1 0.2 0.3 0.4 0.5 0.6 0.7 0.8 0.9 1 3 6 9 12 15 18 21 24 27 30 33 36 Error (%)
Sampling Period (hour)
Verizon, LTE, BayArea Sprint, EVDOA, Seattle Sprint, EVDOA, BayArea T-Mobile, HSDPA, BayArea
Figure 3.4: Weighted Moving Average Error (Median Ping RTT,W = 2)
3.3.3.2 Stability of performance
The predictability and stability of network performance are important not only for users, who are often frustrated more by variations in performance than the average value, but also for determining how and when to conduct measurements for future experiments. In this section, we compute stability using a weighted moving average and autocorrelation.
First, we group the data into 1-hour buckets (to obtain a sufficiently large sample size). Then for each bucket, we use either the median or 5th percentile latency. We compute the moving average error for different window sizes and sampling periods.
We compute the moving average error as follows: for a window sizeW, we predict the next data point on that series by computing moving average for the previous consecutive
W points. For eachW and sampling period (e.g.,everyN hours forN = 1,2,3, . . .), we compute the average over different offsets.
Fig. 3.4 plots the average error for all data points with windows size of2and different sampling periods for median ping RTT (results with larger window sizes of 3, 4, and 5 are similar). We observe that prediction accuracy varies significantly by carrier, with Verizon and Sprint in the Bay Area being relatively predictable, and T-Mobile and Sprint in Seattle being relatively unpredictable. Also, for all of these carriers, prediction accuracy is best when looking at the most recent data (one hour sampling period) and error tends to in-crease with longer durations, with the exception of 24hr (day) and 168hrs (week) sampling
periods, which are local minima. The results from autocorrelation are similar.
These predictability results indicate that despite the large overall variance in cellular network performance, there are regions and time scales over which performance is rela-tively predictable, depending on the carrier. Importantly, we can use this information to inform the design of measurement system that uses prediction to minimize probes that would provide redundant results. For instance, if we subsample every other value (i.e., 50% sampling rate) in the Verizon LTE ping data in the Bay Area (which has the lowest error in the full sample), the distribution of latencies is nearly identical.
3.3.4 Performance Degradation: Root Causes
We now use our measurements to identify the reasons for persistent performance degra-dation observed in consecutive days. We focus on cases where the issue affects both ping RTT and HTTP throughput.
3.3.4.1 Inefficient paths
A reason for performance degradation is inefficient paths. Zarifis et al [188] provide a detailed taxonomy and analysis of path inflation in mobile networks; here we focus on their time evolution and constrain our analysis to only those cases where both latency and throughput were impacted.
For example, we observe an increase in ping RTT in T-Mobile’s Bay Area HSDPA network from Nov 12, 2011 to Dec 10, 2011. Using DNS lookups, we find that clients previously sent to Mountain View were being sent to Seattle, with the additional delay explained by path inflation (Fig. 3.5a). After Dec 10, clients are again directed toward Mountain View.
We also observed a high-latency event for T-Mobile’s Seattle HSDPA network in Seat-tle (Fig. 3.5b). Prior to the event, traceroutes indicate that traffic from T-Mobile ingresses into Level 3 in Seattle, then enters Google’s network. After Feb 15, traffic from these
0 200 400 600 800 1000 1200 1400 1600 1800 22
Oct Oct29 Nov05 Nov12 Nov19 Nov26 Dec03 Dec10 Dec17 Dec24
70 80 90 100 110 120 130 140 150 # of Measurements Median Ping RTT (ms) Time (day) - 2011 Mountain View Seattle Ping RTT (a) 40 60 80 100 120 140 160 11 12 13 14 16 17 18 19 20 21 22 Median Ping RTT (ms)
Time (day) - Feb 2012
Seattle (25-50-75) Los Angeles (25-50-75) (b) 11 12 13 14 15 16 17 18 05
Nov Nov12 Nov19 Nov26 Dec03 Dec10 Dec17 Dec24 Dec31 Jan07
30 40 50 60 70 80 # of Hops Median Ping RTT (ms) Time (day) - 2011 Ping RTT Hops (c)
Figure 3.5: Performance Degradation in: (a)T-Mobile HSDPA network in Bay Area due to server selection flapping from Bay Area to Seattle (b)T-Mobile HSDPA network in Seattle due to change in ingress point of transit AS between T-Mobile and Google (c) Verizon LTE network in Bay Area.
scribers ingressed into Level 3 at a peering point in Los Angeles before entering Google’s network. After Feb 20, routing returns back to its previous state (ingress and egress point in Seattle area) and the median RTT decreases to its previous value, strongly implying that the change in performance was due to the topology change.
In Fig. 3.5c, we observe that ping RTT and the number of traceroute hops increases for Verizon LTE users in the Bay Area. Previously, clients were sent to a Google frontend in the Bay Area; after the change clients are sent to the same Google ingress point, but then traffic is sent to a frontend in Seattle (leading to≈30%higher latency).
In this section we show that fixed-line inefficiencies can significantly impact the per-formance of LTE and HSDPA networks. For these newer technologies, since the RTT is lower, the impact of inefficient routes is even relatively higher (around80%increase in the RTT of T-Mobile HSDPA in Seattle).
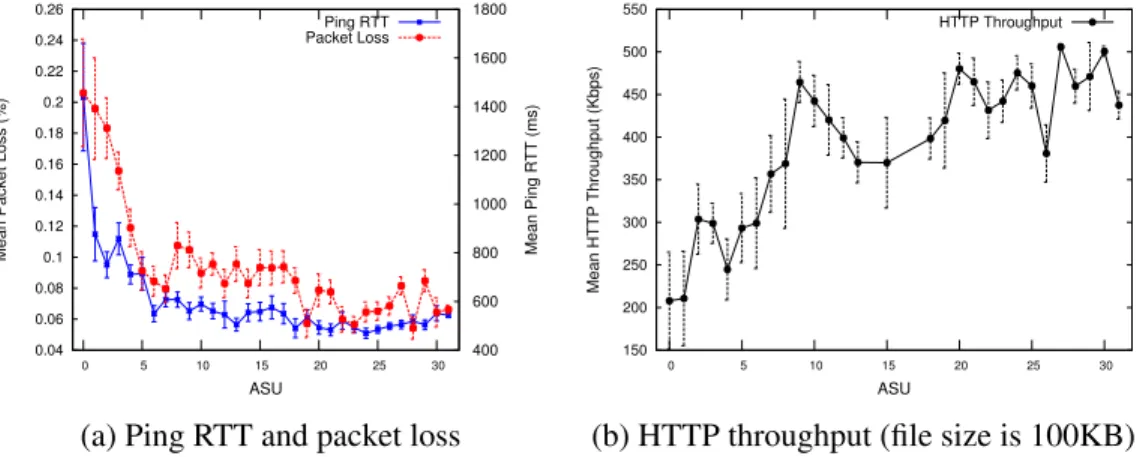
0.04 0.06 0.08 0.1 0.12 0.14 0.16 0.18 0.2 0.22 0.24 0.26 0 5 10 15 20 25 30 400 600 800 1000 1200 1400 1600 1800
Mean Packet Loss (%) Mean Ping RTT (ms)
ASU
Ping RTT Packet Loss
(a) Ping RTT and packet loss
150 200 250 300 350 400 450 500 550 0 5 10 15 20 25 30 Mean HTTP Throughput (Kbps) ASU HTTP Throughput
(b) HTTP throughput (file size is 100KB)
Figure 3.6: Impact of signal strength on latency, packet loss, and throughput.
3.3.4.2 Signal strength
It is well known that weak signal strength reduces channel efficiency for wireless communication; therefore, it is important to account for this when interpreting measure-ments. Using Mobiperf clients, we gather network measurements annotated with the signal strength, in Arbitrary Strength Units (ASUs),4 reported during the probes and determine
the impact of signal strength on performance.
Fig. 3.6 shows how three performance metrics vary with ASU values for AT&T HSDPA users in Seattle. The figures indicate high packet loss, latency and low throughput for ASU values between 0 and 8 (confirming the results in [160]); at larger ASU values that increase in signal strength has less impact on performance. These results indicate that accounting for signal strength is critically important for properly interpreting measurement results. For example, when measuring a carrier’s capacity, it is important to do such tests in regions with high signal strength.
3.4
Conclusion
In this chapter, we took a first look at end-to-end performance as seen from mobile de-vices, using a dataset of scheduled network measurements spanning more than 100 carriers
4Android shows zero signal bar for the ASU values between 0 and 2 and full signal bars when ASU value
over 17 months. We find that there are significant performance differences across carriers, access technologies, geographic regions and over time; however, we emphasize that these variations themselves are not uniform, making network performance difficult to diagnose. Using supplemental measurements such as DNS lookups and traceroutes, we identified the reasons behind persistent performance problems. Further, we examined the stability of network performance, which can help inform efficient scheduling of future network mea-surements. Overall, we find that performance in cell networks is not improving on average, suggesting the need for more monitoring and diagnosis. As part of our future work, we are investigating how to automatically detect persistent performance problems in real time, gather additional network measurements to explain them and provide this information to carriers and end users automatically.
CHAPTER IV
Mobilyzer: An Open Platform for Controllable Mobile
Network Measurements
4.1
Introduction
Given the tremendous growth in cellular data traffic, it is increasingly important to im-prove the availability, performance and reliability of the mobile Internet. To adequately address these challenges, we ideally would be able to collect network measurement data from any mobile device on any network at any time. With this information, users could evaluate the service they are paying for, carriers could study the factors impacting perfor-mance and detect problems causing degradation, and application developers could tune and improve their service. Many of these optimizations can be performed dynamically when data are available in real time.
Despite a need for performance improvement and policy transparency in this space [83, 137], researchers currently still struggle to measure, analyze and optimize mobile networks. Mobile Internet performance characterization is a challenging problem due to a wide vari-ety of factors that interact and jointly affect user experience. For example, the performance that a user receives from an application can depend on the device’s available hardware resources, radio’s network state, the network access technology used, contention for the wireless medium, distance from cell towers, session initiation overhead, congestion at
vari-ous gateways and the overhead of executing code at the communicating endpoints. Further, this performance can change over time and as the user moves with the mobile device. Other challenges include resource constraints (data and power) on mobile platforms in addition to interference affecting measurements.
This problem has not gone unnoticed by researchers, operators and providers. A num-ber of small testbeds and user studies have enabled progress in the face of these chal-lenges [111, 46, 37, 65, 166], but with limited scope, duration, coverage and generality. We argue that previous work suffers from three key limitations that hamper their success. First, these individual solutions do not scale: each individual app or measurement plat-form is inherently limited to the population of participating users running a single piece of software. Second, each solution isinconsistentandinflexiblein the set of network measure-ments it supports and the contextual information describing the experimental environment, making it difficult to ensure scientific rigor and to merge disparate datasets. Third, these solutions areuncoordinatedin how they conduct network measurements: multiple apps can wastefully measure the same property independently or, worse, interfere with each other by running measurements at the same time from the same device.
Instead of proliferating apps that conduct independent network measurements in in-consistent ways, we argue that there should be a common measurement service that apps include in their code. Toward this goal, we designed and builtMobilyzer, a unified platform for conducting network measurements in the mobile environment. Our system is designed around three key principles:
1. Measurement isolation: Network measurements from mobile devices require tightly controlled access to the network interface to provide isolation from competing flows that impact measurement results.
2. Global coordination: Uncoordinated measurements from individual devices have limited scalability and effectiveness, so we provide a global view of available devices and their resources as a first-class service to support efficient and flexible
measure-ments without overloading any device or network.
3. Incentives for researchers and developers: Instead of focusing on a single “killer app” to obtain a large user base, we distribute the platform as a library to include in any new or existing app. Developers and researchers who write apps needing network measurement benefit from reduced operational cost and coding/debugging effort when using our library, and are given network measurement resources across all Mobilyzer devices in proportion to the number of users they convince to install theirMobilyzer-enabled apps.
This chapter answers key questions of how to (1) design a system that efficiently pro-vides controllable and accurate network measurements in the mobile environment, and (2) leverage crowdsourcing to enable measurement studies previously infeasible in mobile net-works.
Mobilyzer provides an API for issuing network measurements using a standard suite of tools, and manages measurement deployment and data collection from participating de-vices. Each device runs a measurement scheduler that receives measurement requests and gives experiments explicit control over the context in which a measurement runs. A cloud-based global manager dynamically deploys measurement experiments to devices according to available resources, device properties and prior measurement results.
Mobilyzeris currently deployed as a library that can be included in Android apps, and a cloud-based Google App Engine service for managing measurements across participating devices. Mobilyzer supports standard implementations of useful measurement primitives such as ping, traceroute, DNS lookups, HTTP GET, TCP throughput, and the like. These rich set of measurement primitives support experiments traditionally popular in fixed-line networks, such as mapping Internet paths (via traceroute), measuring and comparing per-formance for different destinations, and understanding broadband availability. We also support advanced application-layer and cellular-specific measurements, such as inferring RRC timers, measuring Video QoE, and breaking down Web page load time into its
con-stituent dominant components.
Our design supports a constrained form of programmable measurements: an experi-ment may consist of sequential and/or concurrent measureexperi-ments, where the execution of subsequent measurements can depend on the results of prior results and contextual infor-mation (e.g.,signal strength or location). We demonstrate the flexibility of thesecompound measurementsusing several experiments as ca