DOES 3D GIS PROVIDE A DIFFERENT INSIGHT THAN 2D?
Karel Jedli
č
ka, Pavel Hájek
Affiliations:
Department of Geomatics, University od West Bohemia, Univerztiní 8, Plzeň, Czechia,
[email protected], [email protected]
Abstract
The third dimension in GIS is popping up everywhere nowadays. When somebody sees a perspective (or even full 3D visualization) of 3D geographical data, his or her first reaction is usually very positive. However, after a second look or a longer work with the 3D GIS, the user sometimes realizes no or minimal added value, accompanied by unsolicited complexity caused by the need to handle 3D data on a 2D screen (or on some 3D portraying device in general).
The contribution aims to present outputs from a deployed online questionnaire, which dealt with comparison of solving tasks based 2D or 3D visualization of data. Based on such outputs we provide several best practices examples consisting of workshops and tutorials, how to work with 3D geographic data, followed by examples of projects’ outputs dealing with 3D geographical data. The pros and cons of such use cases are then discussed. We focused on cases where the use of the third coordinate adds value comparing to two-dimensional geographic data, their analysis, and visualization.
Keywords: 3D GIS, use cases, 3D and 2D comparison, hs layers ng, openlayers, cesium
1.
INTRODUCTION
A discussion about using 2D or 3D GIS and 2D and 3D maps for different purposes is live and still ongoing these days because an advantage of handling data in three dimensions can be used in various important topics such as urban planning (Popelka (2018), Ying et al. (2012)), 3D cadastre (Ying et al. (2012), van Oosterom (2013), FIG (2018), Janečka & Bobíková (2018)) or Building Information Management (Biljecki et al. (2014, 2015)).
A general overview of 3D GIS regarding data collecting, data modeling, data storing, data structures, and data usage within 3D GIS is described extensively in Jedlička (2018). An overview of virtual 3D maps, their definitions, their creation workflow, and their cartographic principles was depicted in Hájek et al. (2016). A methodology and description
of experiments for evaluation of such cartographic principles were incorporated in Hájek et al. (2018). Particular
geospatial tasks regarding the usability of 2D and/or 3D maps for their successful solving were conducted by an online
questionnaire depicted in Hájek et al. (2018), while some particular general results from such a questionnaire are depicted further in this paper. Based on such experiences, we finally describe and shortly evaluate best practices examples, which we have experience with for the last several years.
2.
EXPERIMENTAL COMPARISON OF 2D AND 3D MAP REPRESENTATION
There already exist related works dealing with research on 3D representations or comparing 2D/3D representations of geographical features in a field of cartography using respondents. Each of them is somehow dealing with particular tasks for the respondents, where questions for respondents are asked and answers are responded on a base of the
displayed situation. Each of the studies deals with a particular topic of research. For example, Bleisch & Dykes (2015)
handled tasks dealing with quantitative data and its location and altitude-related situations on a base of 2D or
perspective representation of such data. Popelka & Doležalová (2016) were dealing with an influence of 2D/3D environment on a size determination of objects. Liu et al. (2017) dealt with an influence of a 3D representation of
solved using either 2D or 3D representation of reality in maps. Such experiments were dealing with solving
thematically related tasks such as “finding a particular type of building”, “object size (area) estimating”, “finding an object which is higher/lower than another one”, or “comparing of 2D and 3D point/line/polygon representation of
objects and their recognition by a user”. The experiments were deployed using an online questionnaire, where six
thematic experiments were incorporated for both 2D and 3D variants of a task.
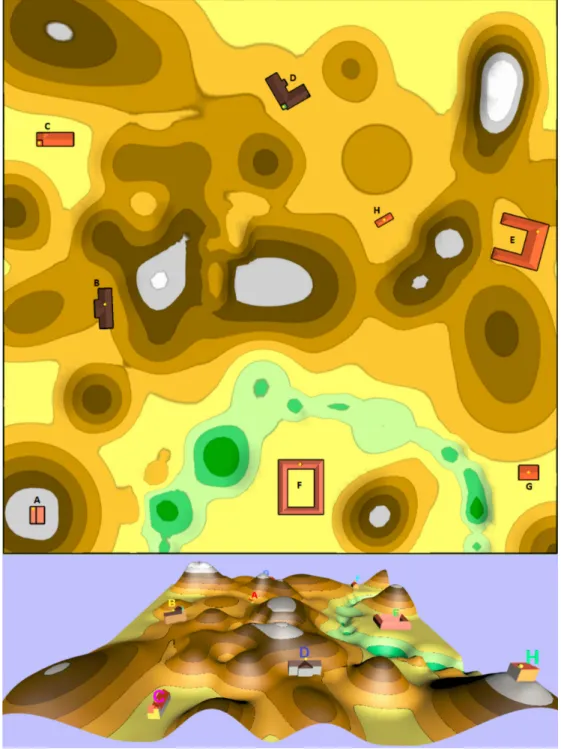
As a particular example of such a task, see figure 1. The task portrayed there deals with a question “Which combination of buildings has direct visibility, respectively between their peaks defined by yellow dots?” The upper part is showing the 2D variant of the task, the lower part is showing the 3D variant of the experiment.
Figure 1. An example of a 2D and 3D version of an experiment dealing with visibility.
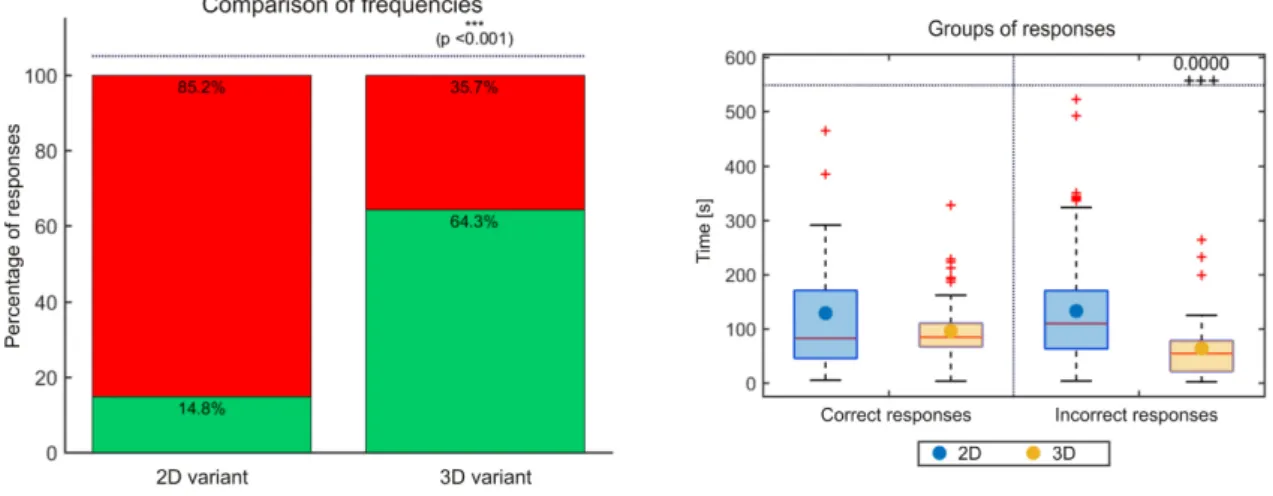
The results for the statistical evaluation of the mentioned task is depicted in figure 2 below. The left side of the figure 2 depicts frequencies of correct answers (green column) and false answers (red column) for both 2D and 3D variant of the task - in this example the null hypothesis of the agreement of the percentage frequencies of correct answers in favor of
the alternative hypothesis at the level of significance of 5% was rejected. This means that the respondents were statistically significantly more successful in solving the 3D variant of the experiment than in its 2D variant. The right side of the figure 2 shows boxplot visualization of time and correctness of all answers of this task - in this example any answer provided within 2D variant of the task took significantly longer than any answer within 3D variant of the task (for the incorrect answers the time is even statistically longer).
Figure 2. Results for statistical evaluation of a visibility decision task.
After a thorough evaluation of all the questions in the conducted questionnaire (see details in Hájek & Čada (2018)), the
finding can be synthetized in the following bullets:
● The purpose of the map and the choice of an appropriate form of its representation is key for proper communication between the map and the reader;
● The cartographic representation of objects in the map plays a key role in their recognition by the map reader; ● There are tasks that can be solved more successfully by the map reader on a 2D variant of the map (e.g.
determining the area in 2D), as well as there are tasks that can be solved by the map reader more successfully on a 3D variant of the map (e.g. direct visibility);
● However, there are tasks that do not depend on the selected 2D or 3D variant (e.g. find buildings of a selected
category) and it is necessary to add semantic information about the object to the map;
● In virtual 3D maps, the 3D representation of real objects around us is more natural for human perception than
their abstract form;
● For virtual 3Ds, 3D display of abstract phenomena (e.g. statistical data) is less suitable, in this case, a 2D variant of the map is a more suitable basis for displaying such information. However, it is possible to find a 3D representation of abstract phenomena that is suitable for virtual 3D maps and is beneficial (e.g. spatial propagation of noise, fumes, etc.).
In general, we can say that, it was proved by the questionnaire mentioned above, that the 3D map visualization as a part of a 3D GIS solution has its own added values.
The next chapter describes our experiences with the 3D GIS and 3D visualization of objects and features by describing particular examples of workshops, tutorials and projects, in which authors of this paper were involved. And these examples are followed by our explanation, why we find 3D representation of data useful for the particular example.
3.
BEST PRACTICES EXAMPLES
This chapter deals with authors’ experiences with 3D data, 3D GIS and 3D or perspective visualization (on a monitor
screen). There is a section of workshops and tutorials followed by a section about the projects, in which we were
involved.
For each workshop or project (let's call them activities in general), there is a brief overview of its topic, followed by a
representative figure for getting an idea, how the outcome of the workshop or project looks like. Nevertheless, there is also to the activity’s web page, in order to provide more comprehensive information to the reader of this contribution
and possibly a link for a short movie showing a 3D visualization of data, where available. Each activity is concluded by
a summary of used technologies, Described project are then also provided with pros and cons of the used technology,
approach and/or a way of visualization, depending the particular activity described.
It is also worth to note that a majority of the following examples (and much more) is also referenced at following URL’s: http://kgm.zcu.cz/3dgis, respectively http://kgm.zcu.cz/3dgis/examples
3.1.
Workshops and tutorials
This is a list of workshops and tutorials focused on various topics related to three dimensional GIS. These workshops were presented on various occasions, such as conferences or invited lectures at extraneous universities.
Multi LOD 3D visualization in the Web Environment
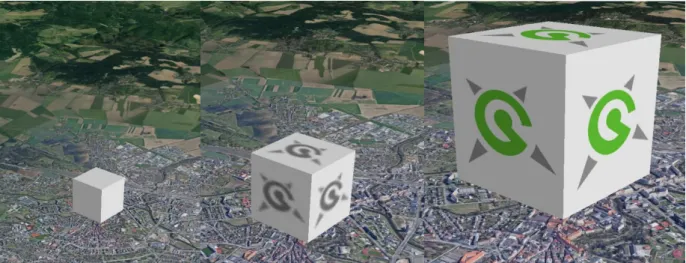
Workshop participants get a short introduction about the 3D visualization techniques for big data applicable in the web environment and then participants learn how to create their own 3D scene with a 3D cube using multiple levels of
details principle from CityGML standard and embedded in a web page. A visualization of a 3D cube using level of
details principle is described in figure 3.
Figure 3. An example of 3D visualization using level of details principle.
Workshop link: http://old.gis.zcu.cz/projekty/3DGIS/MultiLOD/
Technologies used:
• Text editor for editing addressed languages such as HTML, KML and WebGL,
• Web browser for visualization 3D data in WebGL
• Google Earth Plug-in for web browser or Google Earth Desktop for visualization 3D data in KML
Goal: Demonstration of the difference of level of detail concept in 3D and in 3D. Providing easy, step to step guide for
getting started with a multi LOD 3D visualization in the Web Environment, using simple tools and general web browser.
Export of semantically rich models from SketchUp to CityGML
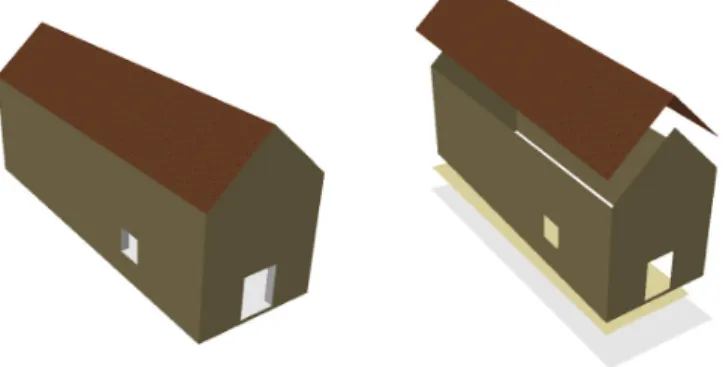
This workshop stressed the importance of semantically rich 3D models. The participants of the workshop get the theory needed and then follows a tutorial to create a 3D model of a simple building in popular 3D software SketchUp. Then
they tagg each part of the building model by prescribed attributes of CityGML (roof, wall, ground, inner wall, ceiling,
floor) using a SketchUp Extension. Finally they convert the data in ArcGIS geodatabase - a suitable GIS representation. See result in figure 4.
Workshop video can be found at https://bit.ly/SketchUp2GIS_video, the presentation here https://bit.ly/SketchUp2GIS.
Figure 4. Comparison of uncategorized (left) and categorized (right) model
Technologies used:
• SketchUp for 3D model creation
• City GML Export Plugin to create CityGML file of a building/bridge/tunnel from an appropriately categorized
SkechUp model.(https://github.com/smrcek/SU_CityGML_ExportPlugin/wiki)
• Data Interoperability for ArcGIS - to convert citygml to Esr Geodatabase
• ArcGIS - to browse the final result
Goal: demonstration of creation of semantically rich models and their import into GIS
Analysis in 3D
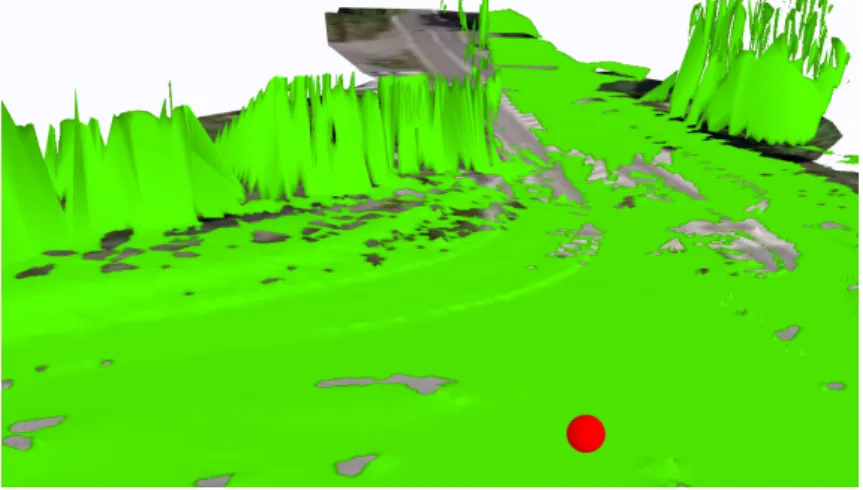
This workshop presents 3D analytical techniques in ArcGIS and describes a way, how the data has to be prepared to enable the analysis. Only techniques working with 3D geometry are presented, namely Visibility, SkyLine, SkyLine Barrier, SkyLine Graph, Inside 3D (see fig X.), Is Closed 3D, Enclose MultiPatch, Inside 3D, Buffer 3D, Intersect 3D,
Difference 3D, Sun Shadow Volume and Near 3D. The important difference between 2D and 3D analysis can be spotted at https://bit.ly/3DVisibilityatJunction. It shows driver’s visibility conditions using 3D analysis. Red point
shows a car entering a junction. Green areas shows the driver’s view. It is clearly visible that vertical obstacles play a crucial role in the visibility analysis – see fig. 6.
Figure 5. Results of the Inside 3D operation
Figure 5.Driver’s (red point) visibility conditions using 3D analysis
A video from the workshop can be found at https://bit.ly/AnalyzyVe3D. Technologies used: ArcGIS with 3D Analyst extension Goal: demonstration of 3D analytical functionality of GIS
3.2.
Projects
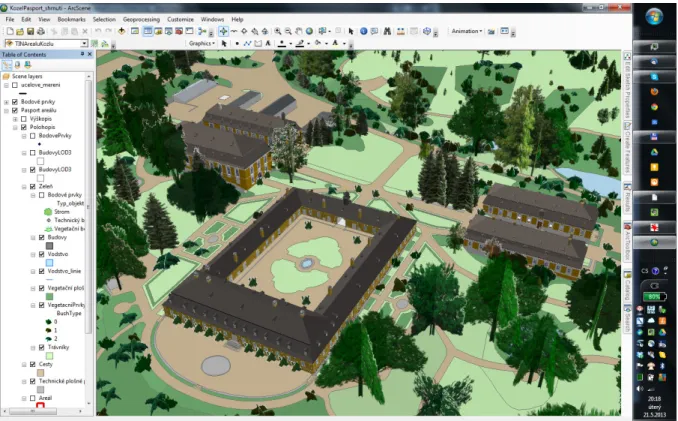
Spatially oriented register of Cultural Heritage - Castle Kozel Case Study
Kozel Chateau is a digital playground and a very first 3D project (http://old.gis.zcu.cz/projekty/Kozel/) of our 3D GIS team. The 3D model (https://bit.ly/KozelExteriors) consists of visualization of chateau exteriors, in particular it portrays detailed terrain, land use, buildings with windows, doors and facade relief, forests and freestanding trees, bushes, etc, see fig. S. Buildings models were created by 3D editing tools in SketchUp and converted to Geodatabase using
CityGML SketchUp plugin and ArcGIS Data Interoperability Extension. The chateau chapel is modelled including
interior (CityGML LOD4), according to techniques described Export of semantically rich models from SketchUp to CityGML chapter. Elements of the chapel model contains unique identifiers in order to be connectable to the Czech spatial database of immovable heritage maintained by National Heritage Institute. Moreover each tree portrayed in the model is connected to MyTrees database ( https://www.treeworks.co.uk/our-technology/mytrees-tree-management-database/).
Figure 7. Visualization of Chateau Kozel exteriors
Technologies used:
• Creation of 3D models - SketchUp by Trimble Inc.
• Visualization of 3D models - ArcGIS and ArcGIS Online. Pros:
• 3D representation of object of interest are interesting to the general public from the point of view of attractivity of such objects,
• and they serve as a reference for Content Management System in order to retrieve interesting information
about the chosen object. Cons:
• Loading of the virtual 3D scene via internet can take longer time due to the size of the 3D models visualized,
while at the moment the model is visualized as whole.
Further reading in Jedlička et al. (2013).
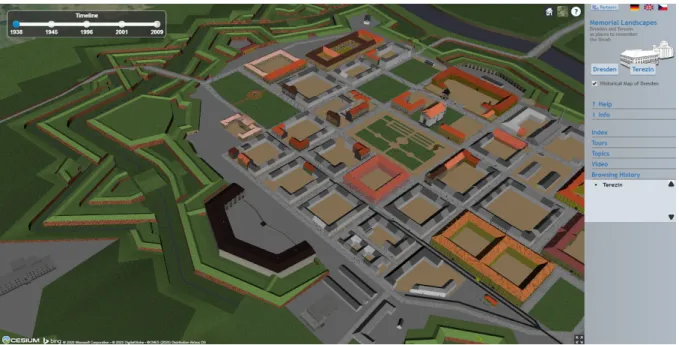
Memorial Landscapes Dresden and Terezín as places to remember the Shoah
The project “Landscape of memory. Dresden and Terezín as places of memories on Shoah” had the main goal to
develop and populate a data model suitable for 3D visualization of large-volume spatial data (the whole area of the
Terezín town in the state of art of 1944) together with related descriptive data. An overview of the Main Fortress of Terezín visualized by Cesium.js is depicted in figure 8.
Figure 8. 3D visualization of the Main Fortress of Terezín. Links: Video (https://www.youtube.com/watch?v=JhgmwNDW45s), project www.gepam.eu Technologies used:
• Creation of 3D models - SketchUp by Trimble Inc.
• Visualization of 3D models / data format used
o originally Google Earth plug-in for Web browsers using Keyhole Markup Language (KML) data format of 3D models with active Level of Details (LoD) principle for visualization (the plugin’s API
expired at the end of 2016),
o at the moment Cesium.js JavaScript library using GL Transmission Format (glTF) data format of 3D models displaying just the most detailed models’ LoD.
Pros:
• 3D representation of object of interest are interesting to the general public from the point of view of attractivity
of such objects,
• they also serve as a presentation of the historical resemblance of the objects of interest, while some of them
exist anymore,
• and they serve as a reference for Content Management System in order to retrieve interesting information
about the chosen object. Cons:
• Loading of the virtual 3D scene via internet can take longer time due to the size of the 3D models visualized,
while at the moment the model is visualized as whole (previous version of the model was related on Level of
Detail principle in order to speed up the loading of models, but the technology of the platform had changed and so the visualization of the model had to be changed).
For further information about the project itself, see Hájek et al.(2013), Hájek et al. (2015)
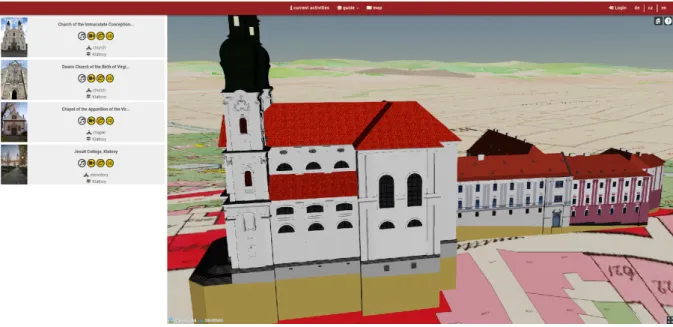
Peregrinus Silva Bohemica (Pavel)
In project “Peregrinus Silva Bohemica – Multimedia and digital tourist guidance for cross border historic routes in the
Bavarian-Bohemian forest”, there was a multimedia digital travel guide created, in order to make the historical-cultural
landscape more attractive for tourists not only through virtual 3D maps but also through 3D printed models of objects of
interest. It contains cultural heritage sites important for tourists and especially for pilgrims on a part of pilgrim ways
between Bavaria and Bohemia. An example visualization of a virtual 3D map using Cesium.js for visualization is showing particular historical buildings of Church of the Immaculate Conception of Virgin Mary and St. Ignatius and
Figure 9: 3D visualization of important historical buildings in Klatovy. Links: project https://peregrinus.online/
Technologies used:
• Creation of 3D models - SketchUp by Trimble Inc., Blender by Blender Foundation
• Visualization of 3D models / data format used - Cesium.js JavaScript library using GL Transmission Format
(glTF) data format of 3D models. Pros:
• 3D representation of object of interest are interesting to the general public from the point of view of attractivity
of such objects,
• they also serve as a preservation of the historical resemblance of the objects of interest,
• and they serve as a reference for Content Management System in order to retrieve interesting information about the chosen object.
Cons:
• Loading of the virtual 3D scene via internet can take longer time due to the size of the 3D models visualized. For further information about the project itself, see Kepka Vichrová et al. (2017), Kepka Vichrová et al. (2020).
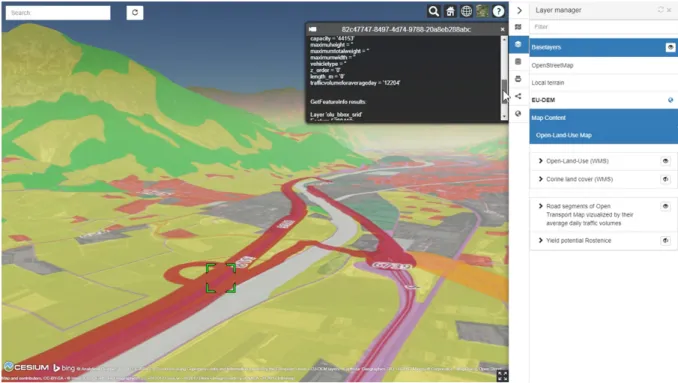
Perspective visualization of Big Data on top of terrain
Three large datasets: Open Land Use (OLU), Smart Points of Interest (SPOI) and Open Transport Map (OTM) have
been integrated into one web application (https://app.hslayers.org/3d-olu/) in order to test visualization of Big Data on
terrain in a Perspective visualization. Check https://www.plan4all.eu/open-data/ for details about the data. The visualization portrays a web map service (WMS) of OLU segmented by regions - where only the regions in the field of vision are loaded. SPOI (described in Vohnout et al. 2014)and OTM (more about in Jedlička et al. 2016) follow the same “field of vision” principle, but these datasets are not optimized. Thus a user can compare the reaction time (also can be checked at this presentation video: https://bit.ly/3D_OLU). Figure 10. shows the application with OLU and OTM
Figure 10. A web application showing visualization of OLU and OTM.
Technologies used:
• Library HS Layers NG (https://ng.hslayers.org/), a customized version of Open Layers library
https://openlayers.org/. Pros:
• a proof of concept that visualization of Big Data is possible in 3D and via internet.
Cons:
• Loading of the virtual 3D scene via internet can take longer time due to the size of the data visualized. For further information about the project see Jedlička & Charvát (2018) or CHarvát et al. (2018).
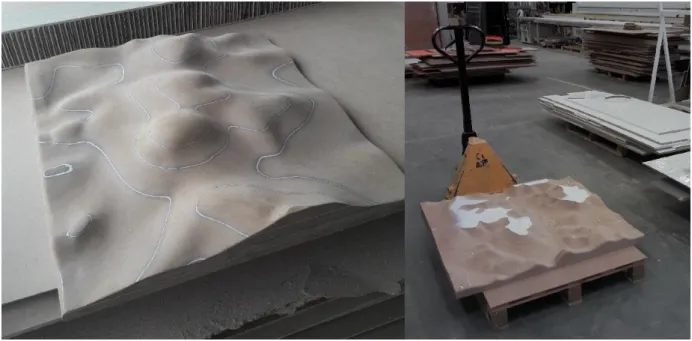
3D Map of Šumava Mountains
Physical 3D model of the Šumava Mountains and Bavarian Forest of size 12 x 5 meters. See first tiles milled in
hardboard in figure 11. This project is ongoing, the physical 3D model is not ready yet. But it should contain a 3D representation of the crossborder mountains of Czech and Bavaria with a topography represented as colorful layers
overlying the terrain itself. On top of that, there should be little off-scale 3D models of important places of interest such as watchtowers or churches placed on the terrain.
Figure 11. Prototype 1x1 meter tiles milled into hardboard
Technologies used:
• Creation of the terrain model - Quantum GIS (QGIS) for downloading EU-DEM terrain data, CATIA and Siemens NX for data preparation to be turned into 1 x 1 meters blocks using CNC technology
• Topography data - QGIS and OpenStreetMap data
Pros:
• Physical 3D model of the area enabling users/visitors to have a good impression about the area of interest
Cons:
• Physical, but not touchable 3D model of the area
4.
DISCUSSION AND CONCLUSION
This paper deals with a question “Does 3D GIS provide a different insight than 2D?” The paper firstly described fundamental outcomes from a deployed questionnaire regarding solving geospatial tasks using 2D or 3D representation
of objects. It concludes, that 3D representation of data is handful, where the third dimension comes with an added value
for “reading a map”, but is not that beneficial, where the third dimension of data restricts obtaining information from a map or 3D visualization.
Next, this paper described experiences of the authors by showing and evaluating best practices examples, where using 3D data handling, 3D GIS and 3D visualization comes handy. The best practices examples were divided into two main
groups, workshops run by the authors of this contribution and projects, where the authors were involved.
This paper tent to show, that 3D GIS in general can be helpful not only for visualization of objects and features, but also
for serving as a database for data retrieving or for making geodata more attractive for general public.
5.
ACKNOWLEDGEMENTS
The work on Traffic Modeller and the authorship of this contribution was supported byMinistry of Education, Youth and Sports of the Czech Republic, project PUNTIS (LO1506) under the program NPU I.
6.
BIOGRAPHY
Karel Jedlička: The theoretical background of Karel's research lies in modeling, analysis, and even simulation using multidimensional (geographic) data structures. In particular, Karel actively
researches on 3D and 4D aspects of Geographical Information Systems. Karel focuses on influence on
transport to the city life, by designing and developing interactive traffic models for Digital twins of
Smart cities. Karel has been leveraging his skills in various EUprojects since 2007.Karel usually acts as a leader of small research or technical team in the project.
Pavel Hájek is a researcher and a lecturer at the Department of Geomatics. He participated in several EU projects such as OpenTransportNet, GEPAM, Peregrinus Silva Bohemica or EUXDAT. His focus was mainly on data modelling, assembling and gathering. Research activities: Geographic Information Systems (GIS), multidimensional data modelling – especially 3D data handling, cartography and
visualisation, 3D GIS/CAD/BIM.
7.
REFERENCES
Biljecki, F., Ledoux, H., Stoter, J., Zhao, J. (2014). Formalisation of the Level of Detail in 3D City Modelling. Computers, Environment and Urban Systems, 48, p.1–15.
Biljecki, F., Stoter, J., Ledoux, H., Zlatanova, S., Çöltekin, A. (2015). Applications of 3D City Models: State of the Art Review. In ISPRS International Journal of Geo-Information, 4(4), 2842-2889. doi:10.3390/ijgi4042842.
Bleisch, S, Dykes, J. (2015) Quantitative Data Graphics in 3D Desktop-Based Virtual Environments–an Evaluation. International Journal of Digital Earth, 8 (8), p.623-639.
FIG (2018). Best Practices 3D Cadastres. Extended version. Editor: Peter van Oosterom. ISBN 978-87-92853-64-6. International Federation of Surveyors FIG, Copenhagen, Denmark http://www.fig.net/news/news_2018/04_FIGPub_3DCad.asp.
Hájek, P., Čada, V. (2018) Virtuální 3D mapy z pohledu kartografie (VIRTUAL 3D MAPS FROM A CARTOGRAPHY POINT OF VIEW), PhD thesis, 219 pp. Available at <http://bit.ly/HajekDSP>, [in Czech]
Hájek, P., Jedlička, K.., Čada, V. (2018) Proposal of experiments for evaluation of cartographic principles on virtual 3D maps of urban areas. In 7th International Conference on Cartography and GIS Proceedings, Vol. 1 and Vol. 2. Sofia: Bulgarian Cartographic Association, 2018. s. 481-489., ISSN: 1314-0604
Hájek, P., Jedlička, K., Čada, V. (2016) Principles of Cartographic Design for 3D Maps – Focused on Urban Areas, 6th International Conference on Cartography and GIS 2016 Proceedings, Vol. 1 and Vol. 2. Sofia, Bulgaria: Bulgarian Cartographic Association, 2016. s. 297-307, ISSN: 1314-0604.
Hájek, P., Jedlička, K., Kepka, M., Fiala, R., Vichrová, M., Janečka, K., Čada, V. (2015) 3D Cartography as a Platform for Remindering Important Historical Events: The Example of the Terezín Memorial. In Modern Trends in Cartography. the Netherlands: Springer International Publishing, 2015. pp. 425-437. ISBN: 978-3-319-07925-7, ISSN: 1863-2246.
Hájek, P. ., Jedlička, K. ., Vichrová, M. ., Fiala, R. (2013) Conceptual approach of information rich 3D model about the Terezín Memorial. Geoinformatics FCE CTU, 2013, roč. 11, č. Neuveden, s. 49-62. ISSN: 1802-2669
Herman, L., Stachoň, Z. (2016) Comparison for User Performance with Interactive and Static 3D Visualization – Pilot Study, In The International Archives of the Photogrammetry, Remote Sensing and Spatial Information Sciences, Volume XLI-B2, 2016 XXIII ISPRS Congress, 12–19 July 2016, Prague, Czech Republic.
Charvat, K., Junior, K. C., Reznik, T., Lukas, V., Jedlicka, K., Palma, R., & Berzins, R. (2018, July). Advanced visualisation of big data for agriculture as part of databio development. In IGARSS 2018-2018 IEEE International Geoscience and Remote Sensing Symposium (pp. 415-418). IEEE.
Janečka, K., Bobíková, D. (2018) Registering the underground objects in the 3D cadastre: A case study of wine cellar located in the vineyard area Tokaj. Acta Montanistica Slovaca, Vol. 23, Issue 3, pp. 260-270. ISSN: 1335-1788.
Jedlička, K., & Charvát, K. (2018, May). Visualisation of Big Data in Agriculture and Rural Development. In 2018 IST-Africa Week Conference (IST-Africa) (pp. Page-1). IEEE.
Jedlička, K.., Čerba, O., Hájek, P. (2013) Creation of information-rich 3D model in Geographic Information System - Case Study at the Castle Kozel. In Informatics, Geoinformatics and Remote Sensing, Conference Proceedings volume I. Sofia: STEF92 Technology Ltd., 2013. s. 685-692. ISBN: 978-954-91818-9-0 , ISSN: 1314-2704
Jedlička, K., Hájek, P., Cada, V., Martolos, J., Šťastný, J., Beran, D., ... & Kozhukh, D. (2016, May). Open transport map—Routable OpenStreetMap. In 2016 IST-Africa Week Conference (pp. 1-11). IEEE.
Kepka Vichrová, M., Fiala, R., Hájek, P., Kepka, M., Dudáček, O., Čerba, O., Čada, V., Dorner, W., Vondráček, P. (2017) Peregrinus Silva Bohemica – cartographic and historical heritage along the ways of Silva Bohemica. In 12th Digital Approaches to Cartographic Heritage Conference Proceedings 2017. Laboratory of Cartography & Geographical Analysis, Aristotle University of Thessaloniki, 2017. s. 210-218., ISSN: 2459-3893
Kepka Vichrová, M., Hájek, P., Kepka, M., Fiegler, L., Juha, M., Dorner, W., Fiala, R. (2020) Current Digital Travel Guide of Peregrinus Silva Bohemica project. In ACIT 2020 - Proceedings. Deggendorf, GERMANY, 16-18 September 2020 (In print) Liu, B., Dong, W., Meng, L. (2017) Using Eye Tracking to Explore the Guidance and Constancy of Visual Variables in 3D Visualization, In ISPRS International Journal of Geo-Information 2017, 6(9), 274; doi:10.3390/ijgi6090274
Petrovič, D., Mašera, P. (2006) ANALYSIS OF USER’S RESPONSE ON 3D CARTOGRAPHIC PRESENTATIONS. Available at <http://www.mountaincartography.org/publications/papers/papers_bohinj_06/16_Petrovic_Masera.pdf>, [cit. 2017-11-22]
Popelka, S. (2018). Eye-Tracking Evaluation of Non-Photorealistic Maps of Cities and Photo-Realistic Visualization of an Extinct Village. In R. A. White, A. Coltekin, & R. R. Hoffman (Eds.), Remote Sensing and Cognition Human Factors in Image Interpretation (pp. 87-110). Boca Raton, FL: CRC Press.
Popelka, S., Dolezalova, J. (2016) Differences between 2D map and virtual globe containing point symbols – an eye-tracking study, Geoconference on Informatics, Geoinformatics and Remote Sensing, Vol III, pp. 175-182, doi:10.5593/sgem2016B23
van Oosterom, P. (2013). Research and development in 3D cadastres. Computers, Environment and Urban System, 40, p.1–6. Vohnout, P., Cerba, O., Kafka, S., Fryml, J., Krivanek, Z., & Holy, S. (2014, May). SmartTouristData approach for connecting local and global tourist information systems. In 2014 IST-Africa Conference Proceedings (pp. 1-6). IEEE.