Measuring the Ability of Score Distributions to
Model Relevance
Ronan Cummins
Department of Information Technology National University of Ireland, Galway
Abstract. Modelling the score distribution of documents returned from any information retrieval (IR) system is of both theoretical and practical importance. The goal of which is to be able to infer relevant and non-relevant documents based on their score to some degree of confidence. In this paper, we show how the performance of mixtures of score dis-tributions can be compared using inference of query performance as a measure ofutility. We (1) outline methods which can directly calculate average precision from the parameters of a mixture distribution. We (2) empirically evaluate a number of mixtures for the task of inferring query performance, and show that the log-normal mixture can model more relevance information compared to other possible mixtures. Finally, (3) we perform an empirical analysis of the mixtures using the recall-fallout convexity hypothesis.
1
Introduction
Analysing the document scores returned from information retrieval (IR) systems is a very useful, yet challenging problem. Work in this area can be dated back to the early days of IR [16]. Modelling the document scores returned for different queries (and from different systems) is an important task because it has been noticed that the distribution of relevant document scores is different than that of non-relevant document scores. For example, if given the entire score distribu-tion (SD) returned from a system, the distribudistribu-tion of relevant documents could be accurately determined, it would be particularly useful for automatic query performance prediction and/or meta-search (fusion) tasks [8, 4]. Regardless, the problem of correctly modelling the distribution of relevant and non-relevant doc-uments remains an open, and theoretically important, area in IR.
Over the last decade, the predominant distributions [1] for modelling rele-vant and non-relerele-vant document scores have been a normal and an exponential respectively. There has been relatively little justification as to why relevant and non-relevant document scores should be drawn from two different families of distributions. Nevertheless, these distributions have best fit the data for many years now. More recently, it has been suggested that the normal-exponential mixture is not theoretically valid under certain assumptions [14], and in fact, a
more theoretically valid approach might be to model the scores using two gamma distributions [9].
This paper deals with determining thebest distribution for use in a mixture model by using the inference of performance (i.e. average precision) as a measure of utility, when relevance information is available. While the task of inferring average precision might be viewed as only one measure ofutility, it is one of the most important tasks in IR. This measure of utility is very important as it is linked to a model’s ability to accurately model the relevance contained within, and is not only of practical concern but is of theoretical importance. We show that the log-normal distribution is the best distribution to use in a mixture model of score distributions for both goodness-of-fit andutilty.
The remainder of the paper is organised as follows: Section 2 reviews related work on modelling document score distributions. Section 3 outlines four mixture distributions used in this paper, before the formulae for calculating the average precision from a mixture model are introduced. Section 4 presents empirical re-sults comparing the four mixture models for a number of metrics when relevance information is known. Section 5 presents an empirical analysis of the four mix-tures based on Robertson’s recall-fallout convexity hypothesis. Finally, section 6 outlines our conclusions and future work.
2
Related Research
In this section, we review related work in document score distributions.
2.1 Related Work
Early work into SD modeling has shown that the distribution of relevant doc-uments somewhat follows a normal curve [16]. Approaches over the years have tried various curves and ‘fits’ to try and uncover the underlying distributions. More recent work has shown that modelling relevant and non-relevant document scores using a normal and exponential distribution respectively, fits for the scores at the head of the ranked list (i.e. top 1000 documents) [1]. Indeed, this has been the predominant trend over recent years [14].
Others have addressed more theoretical aspects of the underlying distribu-tions, and have developed hypotheses under which certain distributions can be theoretically rejected [14]. The aforementioned work develops a recall-fallout hy-pothesis which states that the recall-fallout curve for good systems should be upper convex and has shown that if the probability ranking principle [13] holds, then certain distributions should be rejected on theoretical grounds. Further work [2] has hypothesised that a theoretically valid distribution must be able to approach the Dirac delta function (i.e. it must be able to approach an impulse under which the entire mass of documents can reside).
Some of the theoretical problems associated with the infinite support that some distributions allow were addressed recently [1] using truncated forms of distributions. Some novel approaches [10] to modelling the score distribution
have used multiple normal distributions for the relevant documents and a gamma distribution of the non-relevant ones. This approach uses these distributions because they are a good ‘fit’ given the data. Important work in analysing the generation process (i.e. ranking functions) of document scores and their resultant distributions has also been conducted [9]. On a practical note, research has been conducted to use the score distributions for data fusion [12] and score threshold optimisation [1].
2.2 Contributions
This work has a number of contributions. Firstly we show how average precision can be inferred from a mixture distribution. Secondly, we conduct an extensive evaluation of several mixture models for a number of metrics (one of which is the task of inferring average precision accurately), and advocate the use of the log-normal model in particular. Interestingly, we show that the best method of estimating parameters for the task of inferring average precision, is the method of moments (MME), rather than maximum likelihood estimates (MLE). Finally, we show that the despite its superior performance the log-normal mixture does not adhere to Robertson’s recall-fallout convexity hypothesis as well as the gamma mixture.
3
Models
In this section, we present four mixture distributions used in this paper to model the scores of both relevant and non-relevant documents.
3.1 Assumptions and Restrictions
Consider an IR system that retrieves a returned set ofNdocuments, and thusN scores given a query (Q). Firstly, we assume that an IR system ranks documents independently of each other, in accordance with the probability ranking principle (PRP) [13]. While this may not be true for certain systems (e.g. for those that wish to promote diversity), it is a widely held principle in IR. Secondly, we assume a binary view of relevance. While score distributions can be modelled as mixtures of a multiple of differently graded relevance distributions, this work only models a binary view of relevance.
We used the following two criteria to select the distributions that are pre-sented in section 3.2. Firstly, under on the strong SD hypothesis [2], the distri-bution of both relevant and non-relevant documents should be able to approach Dirac’s delta function (these distributions are valid under that hypothesis). And secondly, there is no theoretically valid reason why relevant and non-relevant documents should be drawn from two different families of distributions, given that the document score of relevant and non-relevant documents is generated using the same process (ranking function) within an IR system.
3.2 Mixture Distributions
The distributions that we consider are the normal distribution (N), the expo-nential distribution (E), the log-normal distribution (L), and the gamma distri-bution (G) [11]. For most of the mixtures outlined in this section both relevant and non-relevant documents are modelled using the same distribution. We only include the normal-exponential (N1E0) mixture as it has been used in many
studies to model score distributions for various tasks. Therefore, the next step is to outline the mixture model that can be used in conjunction with any dis-tribution. For most mixtures, we model both sets of documents using the same distribution, whereP(s|1) is the pdf (probability density function) for the scores (s) of relevant documents, andP(s|0) is the pdf for the scores of non-relevant documents. Therefore, similar to previous approaches, the document score dis-tribution can be thought of as a mixture of relevant and non-relevant documents as follows:
P(s) = (λ)·P(s|1) + (1−λ)·P(s|0) (1) where λ= R
N is the proportion of relevant documentsR in the entire returned setN. In practice, no form of document score normalisation is necessarily needed for the upper limit for any of the distributions. Although, negative values are not supported for the log-normal or gamma distributions, for the information retrieval models used in this work, the issue of supporting negative scores is not a problem in practice1.
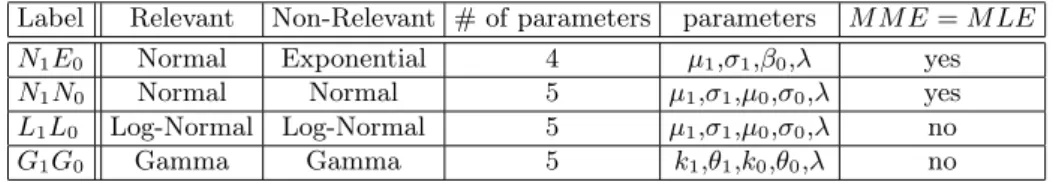
In this paper, we study four mixtures. Table 1 outlines the mixtures and the parameters that need to be estimated for each model. For the parameters of each model, we use the subscript 1 to imply that the parameter is used with the distribution of relevant document scores, whereas we use the subscript 0 to imply that the parameter is used with the distribution of non-relevant document scores. For three of the mixtures, there are a total of five parameters (i.e. the mixture parameter, two parameters to model the relevant scores and two parameters to model the non-relevant scores), while the normal-exponential model (N1E0)
has only four parameters. This is important for comparison purposes, as models (and distributions) with more parameters have more flexibility in modelling the observed data. Therefore, some models may have less flexible in terms of their ability to model scores from different systems. Although we have included the normal-exponential (N1E0) model in this study, it is in the authors opinion that
document scores of relevant and non-relevant documents should not be drawn from two different families of distribution. For theN1E0andN1N0mixtures, the
MME (method of moments estimates) and MLE (maximum likelihood) estimates are equivalent. However, for theL1L0 andG1G0 mixtures, the MME and MLE
estimates will lead to different parameter settings. 1
The occurrence of negative score can easily be overcome in practice by simply shifting all scores by some constant factor. In theory, as scores are generated from term-frequency evidence (bounded by zero), there are some arguments as to why negative scores should not occur in an IR model.
Table 1.Composition of Mixtures
Label Relevant Non-Relevant # of parameters parameters M M E=M LE
N1E0 Normal Exponential 4 µ1,σ1,β0,λ yes
N1N0 Normal Normal 5 µ1,σ1,µ0,σ0,λ yes
L1L0 Log-Normal Log-Normal 5 µ1,σ1,µ0,σ0,λ no
G1G0 Gamma Gamma 5 k1,θ1,k0,θ0,λ no
3.3 Inferring Average Precision
In this section, we will show how average precision (a standard metric for the effectiveness of a query) can be calculated directly from the mixture of continuous distributions. Firstly, it is worth noting that average precision is an informative measure. As average precision can be viewed geometrically as the area under the precision-recall curve [3]2, we know that it summarises the performance over
a large portion of the ranked list, and therefore, conveys a broad view of the effectiveness of a query. Secondly, it is a stable measure [5], and is probably the most prevalent metric of both query and system performance used in IR literature. The interested reader is referred to research which strongly outlines the theoretical importance of average precision [15].
As recall is the proportion of relevant returned documents compared to the entire number of relevant documents, the recall at score s can be defined as follows: recall(s) = Z ∞ s λ·P(s|1)·ds λ = Z ∞ s P(s|1)·ds (2) which is the cumulative density function (cdf) of the distribution of relevant documents (viewed from ∞). Under the distributions outlined earlier for our model, we know that recall(s) will vary between 0 and 1, (i.e. when s = 0, recall(s) = 1 as ensured by the cdf). Similarly, the precision ats(the proportion of relevant returned documents over the number of returned documents) can be defined as follows: precision(s) = R∞ s λ·P(s|1) R∞ s (λ)·P(s|1) + (1−λ)·P(s|0) (3) Now that we can calculate the precision and recall at any scores in the range [0 :∞], we can create a precision-recall curve. Furthermore, as average precision can be estimated geometrically by the area under the precision-recall curve [3], the average precision (avg.prec) of a query can be calculated as follows:
avg.prec() =
Z 1 0
precision(s)·dr(s) (4)
2
Preliminary experiments have shown that the linear correlation between the actual average precision and the area under the interpolated precision-recall curve is greater than 0.95
wherer(s) =recall(s) which is in the range [0:1]. This formulation is an elegant and intuitive way of calculating average precision using the score distributions. As these expressions are not closed-form, they can be calculated using relatively simple geometric numerical integration methods.
4
Mixture Performance
In this section we perform a comparative analysis of the four mixture models across a number of different IR models (i.e. vector space, classic probabilistic, language model, learned model, and axiomatic model). First, however, we will motivate our choice of comparison metrics.
4.1 Goodness-of-Fit, Correlation, and RMSE
Usually, the performance of a mixture model is determined by how well the model
‘fits’ actual data. For different fields of study and for different problems, differ-ent metrics may be applicable. Usually,goodness-of-fit tests (e.g. Kolmogorov-Smirnov test) are used to either accept or reject certain models as a ‘good fit’. However, in IR, it is well-known that documents, and therefore document scores, at the head of a ranked list are more important than those further down the list
3. These goodness-of-fit tests do not make a distinction between observations
(i.e. scores) at various locations and they do not measure the amount of relevant information that can be correctly maintained in the model.
We propose that better mixture models are better able to model the infor-mation regarding relevance. An intuitive way of measuring this is by trying to infer the average precision of a query using the model (and its known param-eters). Average precision is a natural candidate for capturing the performance (as discussed earlier). Therefore, over a set of topics, the correlation between the inferred average precision from the mixture model and the actual average preci-sion of the query from the IR system, gives us a measure of how much relevance information is contained in each model. From an information theoretic point of view, it also gives us an indication of how much relevance information is lost when modelling each ranking with a particular mixture model.
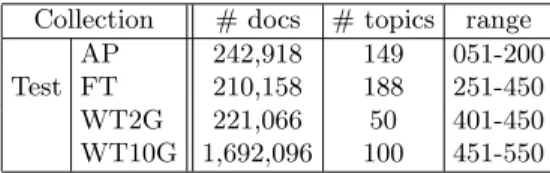
Table 2.Test Collection Details Collection # docs # topics range
AP 242,918 149 051-200
Test FT 210,158 188 251-450 WT2G 221,066 50 401-450 WT10G 1,692,096 100 451-550
3
Looking at only a part of the ranked list (e.g. documents up to rank 1000) does not effectively solve this problem.
4.2 Comparative Analysis
We now compare the four mixture models introduced earlier (i.e. Table 1) over a range of IR systems and settings. Different distributions may better be able to model different IR systems and so for a broader comparison, we compared the four mixtures across five IR models. We chose the vector space model using pivoted document normalisation (PIV) [7], the probablistic model (BM25) [7], a language modelling (LM) approach (Jelinek-Mercer smoothing) [17], a learned approach (ES) [6], and the axiomatic approach (F2EXP) [7], as these represent a broad range of classical and more modern ranking functions. Table 2 shows the test collections used in this research.
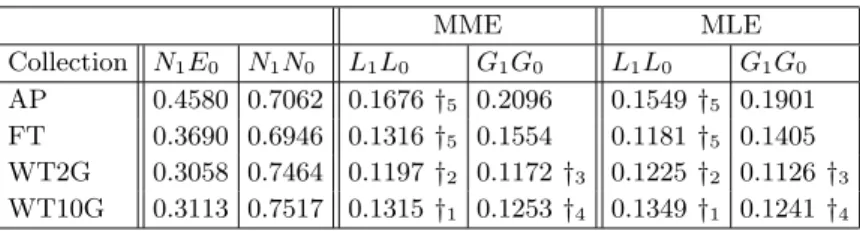
Goodness-of-fit Table 3 shows the Kolmgorov-Smifnoff D-statistic4 (a
mea-sure ofgoodness-of-fit) on each of the collections averaged over the five systems. The D-statistic measures the maximum distance between the cumulative den-sity function of the theoretical distribution (i.e. one of the mixtures) and the empirical distribution (i.e. the actual scores). Firstly, we can see that Table 3 shows that the log-normal model has a significantly5 better fit compared to the
gamma model on two collections for the entire returned set of document scores. The results also show that the log-normal models fits non-web collections very well, but the gamma model has a better fit for some IR systems on web col-lections. The normal-exponential model is the third best model in terms of fit, while the normal-normal model is particularly poor. We can also see from Table 3 that the MLE parameter estimation technique provides better fits, in general, than MME.
Table 3. Average Kolmgorov-Smifnoff D-statistic for queries across all systems for title queries using entire returned set of document scores
MME MLE Collection N1E0 N1N0 L1L0 G1G0 L1L0 G1G0 AP 0.4580 0.7062 0.1676†5 0.2096 0.1549†5 0.1901 FT 0.3690 0.6946 0.1316†5 0.1554 0.1181†5 0.1405 WT2G 0.3058 0.7464 0.1197†2 0.1172†3 0.1225†2 0.1126†3 WT10G 0.3113 0.7517 0.1315†1 0.1253†4 0.1349†1 0.1241†4 4
As the parameters of the model are estimated from the observed samples, the critical values of the Kolmgorov-Smifnoff test are invalid. However, we use the D-statistic as a relative measure to compare the mixtures, and not as a statistical test to accept or reject the validity of the distribution.
5
†x denotes that the statistic is significantly lower than the next best model using the same parameter estimation technique forxof the five systems.
Table 4.Average Spearman (and Pearson in parentheses) correlation between mixture model’s inferred average precision and actual average precision across five IR systems for title queries using entire returned set of documents
MME MLE Mixture N1E0 N1N0 L1L0 G1G0 L1L0 G1G0 AP 0.47 (0.26) 0.56 (0.32) 0.89(0.84) 0.84 (0.76) 0.80 (0.71) 0.77 (0.66) FT 0.33 (0.24) 0.55 (0.30) 0.89(0.81) 0.86 (0.75) 0.83 (0.75) 0.80 (0.67) WT2G 0.45 (0.32) 0.49 (0.35) 0.83(0.83) 0.81 (0.81) 0.72 (0.67) 0.73 (0.70) WT10G 0.39 (0.33) 0.40 (0.07) 0.74(0.61) 0.66 (0.55) 0.62 (0.46) 0.58 (0.44)
Correlations and RMSE Now we analyse the amount of relevance informa-tion that can be correctly contained within each mixture model across the five IR systems using correlation measures. Using the MME and MLE approaches we can estimate the five parameters in each mixture model assuming relevance information is known (i.e. labelled data). We then compare the correlation of the inferred average precision (calculated from equation 4) for the mixture model with the actual average precision from the IR system in question.
Table 4 shows the average Spearman and Pearson correlation of the four mixture models averaged across the five systems6. Firstly, it is worth noting that
the correlation coefficients for some of the mixtures are quite high, indicating that much of the information regarding average precision (relevance) are correctly modeled by some of the mixtures. We can also see that the mixture model comprised of a normal and exponential (i.e. the predominant model over the last decade) is the lowest performing model of the four that we have studied. The normal-normal model outperforms the exponential-normal model in terms of utility despite having a worse fit (see Table 3). In general, we can also see that the log-normal mixture model tends to outperform the gamma model across a variety of settings and parameter estimation techniques (i.e. for both MME and MLE estimates). In general, the results show that the log-normal model is the more general and consistent model for preserving relevance information across a variety of IR systems.
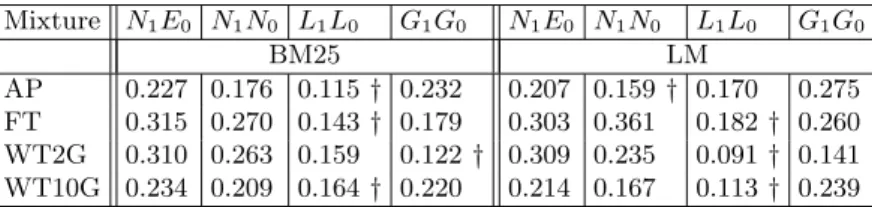
Table 5 shows theroot mean squared error (RMSE)7of the inferred average
precision compared to the actual average precision for a set of queries for both the BM25 and LM systems (the other systems tested showed comparable results). We can see that the actual average precision predicted by the log-normal model is closer to the true average precision. While the RMSE is not of major importance in terms of the predictive quality of a model, it does inform us that the raw output of the log-normal mixture model is closer to the actual average precision
6
The bold font indicates that the average correlation is higher than the next highest across all five systems. Statistical tests do not show any difference between the top two performing mixture models. Statistical tests do show a higher correlation for the gamma and log-normal models compared to the other mixtures.
7
The†denotes that the reduced error is significant compared to the gamma mixture. A Wilcoxon ranked sign test at the 0.01 level was used.
of a query. The RMSE results of all other IR systems are comparatively similar to those in Table 5. One reason for this error is that the formulae given for inferring average precision from score distributions (Section 3.3) will actually over-estimate the actual average precision value on TREC data due to the fact that recall is calculated as the number of relevant documents in the returned set, rather than the total number of relevant documents in the collection.
Table 5.RMSE of Inferred Average Precision (using MME) compared to two System’s (BM25 and LM) Actual Average Precison for title queries using entire returned set of document scores Mixture N1E0 N1N0 L1L0 G1G0 N1E0 N1N0 L1L0 G1G0 BM25 LM AP 0.227 0.176 0.115† 0.232 0.207 0.159† 0.170 0.275 FT 0.315 0.270 0.143† 0.179 0.303 0.361 0.182† 0.260 WT2G 0.310 0.263 0.159 0.122† 0.309 0.235 0.091† 0.141 WT10G 0.234 0.209 0.164† 0.220 0.214 0.167 0.113† 0.239
MME vs MLE Another interesting point is that the MME approach to param-eter estimation consistently outperforms the MLE approach in terms of utility
(i.e. for the task of inferring performance as measured by the correlations in Table 4). However, when all sample observations are treated equally (as for
goodness-of-fit tests), the D-statistic in Table 3 shows that models derived from MLE are closer to the observed samples. This provides further proof that the correlation coefficients andgoodness of fittests measure different aspects. As we are dealing with IR systems, and models of relevance, we argue that a standard measure ofutility is more apt.
5
Recall-Fallout Convexity Analysis
Of the mixtures studied in this paper, we have empirically determined that the mixture of two log-normals is one of the better mixtures for modelling document scores for a number evaluation metrics. Furthermore, our results suggest that it is very robust and can accurately model rankings returned from many systems. However, it is unclear if this mixture adheres to useful theoretical properties. In this section, we analyse all of the mixtures using the recall-fallout convexity hypothesis [14]. Interestingly, we show that the gamma mixture violates the recall-fallout hypothesis less often than the log-normal mixture near the head of the ranked list (i.e. where it is more important).
5.1 Locating Points of Non-Convexity
The recall-fallout hypothesis states that as we traverse a ranked-list, the recall should always be greater than fallout. This seems theoretically justifiable, as
IR systems should at least provide a better than random ranking. Therefore, when modelling document rankings as continuous distributions, the recall-fallout hypothesis can be more formally stated as R∞
s P(s|1)·ds >
R∞
s P(s|0)·dsfor all s. A detailed analysis of the recall-fallout convexity hypothesis for all of the mixtures studied in this paper (except the two log-normal mixture) can be found in the original work [14]. Using notation similar to the original work, the convexity condition that must be satisfied to ensure that recall is greater than fallout for all scores, can be written as follows:
g1(s)> g0(s) (5) where g(s) = 1 f(s) df(s) ds (6)
where f(s) is the probability density function of a particular distribution. Now assuming this hypothesis to be valid, it would be interesting to see how closely the better mixture models adhere it.
Gamma Mixture Therefore, asg(s) = ((k−1)/s)−1/θfor the gamma mixture [14], the score at which the condition is violated is found by simplifying the following: k1−1 s − 1 θ1 =k0−1 s − 1 θ0 (7) which simplifies to s= θ1θ0k0−θ1θ0k1 θ1−θ0 (8) We can see that ifθ1=θ0, there are no roots for s, and so no violations occur.
Furthermore, ifk1=k0,s= 0 and so, the violation occurs at the point at which
both recall and fallout are 1 (which is acceptable). For the two-gamma mixture, ifs >0, the violation occurs at a score that can be encountered by the mixture, otherwise the violation does not occur.
Log-Normal Mixture For the log-normal mixtureg(s) = (µ−log(s)−σ2)/(s·σ2),
and therefore, the score at which the convexity condition is violated is found at: s=e(µ1σ 2 0−µ0σ 2 1)/(σ 2 0−σ 2 1) (9)
by following a similar simplification process as the gamma mixture. We can see that ifσ1=σ0, the function has no roots, and therefore, no violations (similar to
the normal distribution [14]). If the variances are not exactly equal, a violation of the convexity condition, will occur at a score above zero. The score at which a violation occurs can be translated to a point of recall using equation (2).
5.2 Empirical Results and Discussion
We analysed the four mixtures models by calculating the points of recall at which the convexity condition was violated for each query on the test collections. It is reasonable to assume that a violation at the head (i.e. low point of recall) of the ranked list is more serious than if it occurs at high recall. However, if the convexity condition is violated at a score that is rarely, or never, encountered by an IR metric (at high recall), it is deemed less serious. Table 6 reports the average point of recall at which a violation of the convexity condition occurs for a set of queries averaged across the five IR systems. The results in Table 6 are from the four models when using MME as the parameter estimation technique. In general, we can see that the two-gamma model is the more theoretically sound as violations occur, on average, at a higher point of recall (e.g. at a lower scores). Surprisingly, violations occur at a low point of recall for the log-normal model (even lower than the two-normal model), which suggests that it is theo-retically less sound that either the two-gamma model or the two-normal model. The exponential-normal mixture has violations at both ends of the relevant dis-tribution (i.e. both high and low recall) 100% of the time, and therefore, we can see from Table 6 that the violations occur very early on in the ranking (i.e. low point of recall). The results from Table 6 confirm previous analysis [14] with regard to many of these models.
The average results across the five IR systems in Table 6 are highly represen-tative of each individual system. More work is needed to understand the reasons for the apparent shortcoming in the theoretical behaviour of the two log-normal model (especially as it outperforms other mixtures in terms of goodness-of-fit
andutility).
Table 6.Average recall at which convexity violations occur for different models Mixture N1E0 N1N0 L1L0 G1G0 AP 0.001 0.401 0.178 0.540 FT 0.003 0.309 0.199 0.556 WT2G 0.000 0.236 0.159 0.695 WT10G 0.000 0.309 0.147 0.594
6
Conclusion
In this work, we have performed a comparative analysis of different distributions that comprise mixtures for document score distributions in IR systems. We have determined that the log-normal distribution is the best performing model in terms of both its accuracy in inferring average precision, and itsgoodness-of-fit. The log-normal model has been used in relatively few practical works. Interest-ingly, we have shown despite its good performance the log-normal model is the-oretically less sound than the two-gamma model towards the head of a ranking.
Interesting future work would be to create mixture models that unconditionally adhere to the recall-fallout convexity hypothesis (e.g. by ensuring σ1 =σ0 for
the two log-normal model) and then compare theutility of those valid models.
References
1. Avi Arampatzis, Jaap Kamps, and Stephen Robertson. Where to stop reading a ranked list?: threshold optimization using truncated score distributions. InSIGIR, pages 524–531, 2009.
2. Avi Arampatzis and Stephen Robertson. Modeling score distributions in informa-tion retrieval. Inf. Retr., 14(1):26–46, 2011.
3. Javed A. Aslam and Emine Yilmaz. A geometric interpretation and analysis of r-precision. InCIKM, pages 664–671, 2005.
4. Christoph Baumgarten. A probabilistic solution to the selection and fusion problem in distributed information retrieval. InACM SIGIR conference on Research and development in information retrieval, SIGIR ’99, pages 246–253, New York, NY, USA, 1999. ACM.
5. Chris Buckley and Ellen M. Voorhees. Evaluating evaluation measure stability. In SIGIR, pages 33–40, 2000.
6. Ronan Cummins and Colm O’Riordan. Learning in a pairwise term-term proximity framework for information retrieval. InSIGIR, pages 251–258, 2009.
7. Hui Fang and ChengXiang Zhai. An exploration of axiomatic approaches to infor-mation retrieval. InSIGIR, pages 480–487, 2005.
8. Ben He and Iadh Ounis. Query performance prediction. Inf. Syst., 31(7):585–594, 2006.
9. Evangelos Kanoulas, Keshi Dai, Virgiliu Pavlu, and Javed A. Aslam. Score distri-bution models: assumptions, intuition, and robustness to score manipulation. In SIGIR, pages 242–249, 2010.
10. Evangelos Kanoulas, Virgiliu Pavlu, Keshi Dai, and Javed A. Aslam. Modeling the score distributions of relevant and non-relevant documents. InICTIR, pages 152–163, 2009.
11. N Hastings M Evans and B Peacock. Statistical distributions, third edition. Mea-surement Science and Technology, 12(1):117, 2001.
12. R. Manmatha, T. Rath, and F. Feng. Modeling score distributions for combining the outputs of search engines. In Proceedings of the 24th annual international ACM SIGIR conference on Research and development in information retrieval, SIGIR ’01, pages 267–275, New York, NY, USA, 2001. ACM.
13. C. J. Van Rijsbergen. Information Retrieval. Butterworth-Heinemann, Newton, MA, USA, 2nd edition, 1979.
14. Stephen Robertson. On score distributions and relevance. InProceedings of the 29th European conference on IR research, ECIR’07, pages 40–51, Berlin, Heidelberg, 2007. Springer-Verlag.
15. Stephen E. Robertson, Evangelos Kanoulas, and Emine Yilmaz. Extending average precision to graded relevance judgments. In Proceeding of the 33rd international ACM SIGIR conference on Research and development in information retrieval, SIGIR ’10, pages 603–610, New York, NY, USA, 2010. ACM.
16. John A. Swets. Information retrieval systems. Science, 141(3577):245–250, 1963. 17. Chengxiang Zhai and John Lafferty. A study of smoothing methods for language
models applied to information retrieval. ACM Trans. Inf. Syst., 22:179–214, April 2004.