Sequence analysis
Accurate estimation of isoelectric point of
protein and peptide based on amino
acid sequences
Enrique Audain
1, Yassel Ramos
2, Henning Hermjakob
3,
Darren R. Flower
4and Yasset Perez-Riverol
3,*
1
Department of Proteomics, Center of Molecular Immunology,
2Department of Proteomics, Center for Genetic
Engineering and Biotechnology, Ciudad de la Habana, Cuba,
3Department European Molecular Biology Laboratory,
European Bioinformatics Institute (EMBL-EBI), Wellcome Trust Genome Campus, Hinxton, Cambridge, CB10 1SD,
UK and
4School of Life and Health Sciences, Aston University, Aston Triangle, Birmingham, B4 7ET, UK
*To whom correspondence should be addressed. Associate Editor: Burkhard Rost
Received on June 30, 2015; revised on October 16, 2015; accepted on November 10, 2015
Abstract
Motivation:
In any macromolecular polyprotic system—for example protein, DNA or RNA—the
iso-electric point—commonly referred to as the pI—can be defined as the point of singularity in a
titra-tion curve, corresponding to the solutitra-tion pH value at which the net overall surface charge—and
thus the electrophoretic mobility—of the ampholyte sums to zero. Different modern analytical
bio-chemistry and proteomics methods depend on the isoelectric point as a principal feature for
pro-tein and peptide characterization. Propro-tein separation by isoelectric point is a critical part of 2-D gel
electrophoresis, a key precursor of proteomics, where discrete spots can be digested in-gel, and
proteins subsequently identified by analytical mass spectrometry. Peptide fractionation according
to their pI
is also widely used in current proteomics sample preparation procedures previous to the
LC-MS/MS analysis. Therefore accurate theoretical prediction of pI
would expedite such analysis.
While such pI
calculation is widely used, it remains largely untested, motivating our efforts to
benchmark pI
prediction methods.
Results:
Using data from the database PIP-DB and one publically available dataset as our reference
gold standard, we have undertaken the benchmarking of pI
calculation methods. We find that
methods vary in their accuracy and are highly sensitive to the choice of basis set. The
machine-learning algorithms, especially the SVM-based algorithm, showed a superior performance when
studying peptide mixtures. In general, learning-based pI
prediction methods (such as Cofactor,
SVM and Branca) require a large training dataset and their resulting performance will strongly
depend of the quality of that data. In contrast with Iterative methods, machine-learning algorithms
have the advantage of being able to add new features to improve the accuracy of prediction.
Contact: [email protected]
Availability and Implementation:
The software and data are freely available at https://github.com/
ypriverol/pIR.
Supplementary information:
Supplementary data
are available at
Bioinformatics
online.
VCThe Author 2015. Published by Oxford University Press. 821
This is an Open Access article distributed under the terms of the Creative Commons Attribution License (http://creativecommons.org/licenses/by/4.0/), which permits unrestricted reuse, distribution, and reproduction in any medium, provided the original work is properly cited.
doi: 10.1093/bioinformatics/btv674 Advance Access Publication Date: 14 November 2015 Original Paper
1 Introduction
In a titration curve, the isoelectric point (pI) is the value at which the overall net surface charge of a macromolecular polyprotic spe-cies equals zero. Protein pIvalues are amongst the most widely determined and widely reported quantities in all of biochemistry and proteomics. The pIis obtained as essentially incidental informa-tion during isoelectric focusing (IEF) experiments, free flow electro-phoresis (FFE), capillary electroelectro-phoresis, and in-gel electroelectro-phoresis experiments using IPG strips (Audain et al., 2014; Ramos et al., 2008). Electrophoresis-based separation of proteins and peptides in both free-flow and gel systems has been adapted to a wide variety of proteomics platforms in order to reduce the complexity of the studied proteome (Ramoset al., 2008, 2011). In addition to the resolution and dynamic range of the fractionation technique, com-bining the electrophoretic separation of proteins with mass spec-trometry analysis provides an orthogonal analytical method for improving protein identification in different workflows ( Perez-Riverolet al., 2013).
Assuming a protein to be denatured, theoretical calculation of the pIis typically rapid, requiring only the sequence as input (Cargileet al., 2004). Most techniques exploit tabulated pKavalues for the different ionizable amino acid residues; such values are assumed to be constant regardless of structural context (Maldonadoet al., 2010). Many au-thors have reported different values for the pKas of protein side chains and most of them are derived from measurements of side chains in iso-lated amino acids or from model compounds; as well as values derived from ionizable side chainsin situ (Bjellqvist et al., 1993; Lengqvist et al., 2011). As many such alternative theoretical methods have been proposed, the calculation of protein pI values is in urgent need of benchmarking, since its accuracy remains largely untested. Extant com-parison has been exiguous, using very small datasets (Patrickios and Yamasaki, 1995), peptides rather than proteins (Cargileet al., 2004;
Lengqvistet al., 2011) or has reported poor accuracy (Henriksson et al., 1995;Patrickios and Yamasaki, 1995).
We have previously described the database PIP-DB (Bunkute et al., 2015), a collection of proteins, with associated experimentally determined pIvalues, as collated from the literature (Bunkuteet al., 2015). In this paper, we use PIP-DB as a gold standard reference for comparison, and describe the benchmarking of protein pI predic-tion. We also include a peptide dataset to evaluate the performance of pIprediction methods when estimating peptide pIs, due to the im-portance of properly assessing the accuracy of such prediction. As previously we combine different methods with different parameter values. Specifically, we evaluated five isoelectric point prediction al-gorithms: Iterative (Maldonado et al., 2010; Patrickios and Yamasaki, 1995), Bjellquivst (Bjellqvistet al., 1993;Cargileet al., 2008), Cofactor (Cargile et al., 2008), SVM (Perez-Riverolet al., 2012) and Branca (Brancaet al., 2014); using, where appropriate, a set of alternate values for ionizable amino acid side chain pKas.
2 Methods
Five different isoelectric point prediction algorithms were evaluated: Iterative (Maldonadoet al., 2010;Patrickios and Yamasaki, 1995), Bjellquivst (Bjellqvist et al., 1993; Cargile et al., 2008), Cofactor (Cargileet al., 2008), SVM (Perez-Riverolet al., 2012) and Branca (Brancaet al., 2014). The iterative model only considers the contri-bution of individual pKavalues to the Henderson-Hasselbach equa-tion (Patrickios and Yamasaki, 1995). The Bjellquivst (Bjellqvist et al., 1993) algorithm is based on determining the pKadifferences between closely related amino acids, and it was the first algorithm
to propose a different pKavalue depending on the amino acid pos-ition in the sequence. The Cofactor algorithm (Cargileet al., 2008) accounts for the effect of adjacent amino acids63 residues away from a charged aspartic or glutamic acid and the C-terminus, as well as applying a correction term to the corresponding pKa values. Perez-Riverol and co-workers (Perez-Riverolet al., 2012) proposed a support vector machine approach to predict the isoelectric point of peptides in electrophoretic experiments based on amino acid se-quences and AAIndex properties. The Branca method (Brancaet al., 2014) uses pKavalue correction considering the influence of neigh-boring ionizable groups up to six residues away, multiplying each correction factor by the charged fraction of the neighboring ioniz-able group before applying it to the initial pKavalue. It also intro-duces the use of a statistical correction factor that depends on the number and type (Asp or Glu) of carboxylic acid side chains in the sequence.
Different pKa values were evaluated for each method: for the iterative algorithm we include multiple pKasets reported previously (Supplementary Information, Table 1). The Bjellquivst method was evaluated using different pKacorrection factors for C- and N-terminus (Calibrated (Gauciet al., 2008), Expasy (Gasteigeret al., 2003), Skoog and default (Bjellqvistet al., 1993)). The algorithms Cofactor and SVM were evaluated using the default values reported in the corresponding publications. The Branca algorithm was used with the flagpKconstants_plainset, and without considering add-itional chemical modification in the polypeptide sequence (for ex-ample, peptides derivatized with iTRAQ or TMT reagents). Detailed information of each estimation method can be found in
Supplementary Information S1.
2.1 pIR R-package
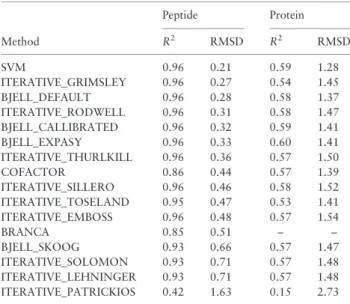
To facilitate analysis of isoelectric point prediction for peptides and proteins, an R package (pIR) was developed using standard best practices for bioinformatics software development (Leprevostet al., 2014;Perez-Riverolet al., 2014). It provides several datasets used in Table 1.Benchmark statistics for peptides and protein
Peptide Protein Method R2 RMSD R2 RMSD SVM 0.96 0.21 0.59 1.28 ITERATIVE_GRIMSLEY 0.96 0.27 0.54 1.45 BJELL_DEFAULT 0.96 0.28 0.58 1.37 ITERATIVE_RODWELL 0.96 0.31 0.58 1.47 BJELL_CALLIBRATED 0.96 0.32 0.59 1.41 BJELL_EXPASY 0.96 0.33 0.60 1.41 ITERATIVE_THURLKILL 0.96 0.36 0.57 1.50 COFACTOR 0.86 0.44 0.57 1.39 ITERATIVE_SILLERO 0.96 0.46 0.58 1.52 ITERATIVE_TOSELAND 0.95 0.47 0.53 1.41 ITERATIVE_EMBOSS 0.96 0.48 0.57 1.54 BRANCA 0.85 0.51 – – BJELL_SKOOG 0.93 0.66 0.57 1.47 ITERATIVE_SOLOMON 0.93 0.71 0.57 1.48 ITERATIVE_LEHNINGER 0.93 0.71 0.57 1.48 ITERATIVE_PATRICKIOS 0.42 1.63 0.15 2.73
Pearson correlation (R2) and root-mean-square deviation (RMSD) for
methods and each pKaset. The best combination (higherR2and low RMSD)
was obtained using the support vector machine algorithm for peptides, and the Bjellquivst algorithm with the Expasy pKaset for proteins.
the current study with the corresponding experimental and predicted isoelectric point values. It also provides a framework for reprodu-cible analysis, allowing correlation and RMSD analysis of the predicted values; plot visualization and data processing (outlier removal, null value detection). pIR was implemented in R ver-sion 2.13.0 and is available from URL: https://github.com/ypri verol/pIR.
2.2 Datasets
For the protein analysis, PIP-DB (Bunkuteet al., 2015) (version 1.0), which contains curated protein pIliterature data, was used to deter-mine the accuracy of isoelectric point calculation. All proteins where sequence data was available were retrieved from PIP-DB with the corresponding experimental isoelectric point.
For the peptide analysis, a previously published dataset was used (Helleret al., 2005). We utilized the PeptideProphet score to filter out low-confidence peptides from the dataset. In summary, a cellular extract of Drosophila Kc167 cells was fractionated in an isoelectric focusing Off-GEL device using 15 fractions. The tryptic proteome is separated using the isoelectric point and the experimentally derived pIvalues are reported with the final results. The identified peptides were analyzed with two different database search engines, namely PHENYX and SEQUEST, together with PeptideProphet, which is a popular post-processing peptide identification tool: a final list of 6529 peptides were used for the present study (Helleret al., 2005).
In addition, we have analyzed the impact of common post-transla-tional modifications on isoelectric point estimation using a third data-set, as published previously byGauciet al. (2008). This experimental dataset was obtained using online TiO2 enrichment in combination with in-gel peptide IEF of aZebrafishembryo lysate. It contains sub-populations of phosphorylated and N-terminal acetylated peptides whit the corresponding experimental pIvalues associated.
3 Results
3.1 Isoelectric point estimation of protein sequences
Initially, PIP-DB (Bunkuteet al., 2015) was divided into two subsets: proteins with several experimental pIvalues and proteins with a single experimental pI value (called unique proteins hereafter). Figure 1
shows the protein distribution by isoelectric point for both sets. The second group (proteins with only one pIvalue) contains 1066 pro-teins, most of which are from acid fractions (pH range 3.0–6.0).
As PIP-DB contains legacy data, not all entries were deemed use-ful. Initially, we isolated entries with a single measured isoelectric point rather than entries with multiple pIvalues or a range of values. Estimation of theoretical pIvalues was undertaken on the unique protein subset. Pearson correlation coefficients and root-mean square deviation (RMSD) values were used to evaluate the perform-ance of the methods in predicting pI.
Table 1summarizes the correlation coefficients and RMSD values achieved for each evaluated algorithm. The overall correlation between the experimental and theoretical pIvalues varied betweenR2¼0.60 (Bjellquivst—Expasy pKa set) andR2¼0.15 (Iterative-Patrickios pKa set). The lowest RMSD value was for the SVM algorithm (RMSD¼1.28). Most of the algorithms performed poorly when pre-dicting protein pI, with a correlation coefficient between 0.55 and 0.58.
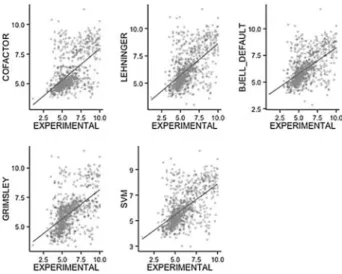
Figure 2shows the correlation between the experimental value and the predicted values for five different methods. The correlation in the basic fractions (pI>7.5) is inferior compared to the complete dataset. Compared to previous studies with peptides (Perez-Riverol et al., 2012), the best correlation is obtained in the neutral range (5.0–7.0 pH) where fewer proteins are observed. Interestingly, the algorithms based on machine learning techniques, such as those of Cargile et al. (Cofactor) and Perez-Riverolet al.(SVM), show a similar correlation compared with the Iterative and Bjellquivst methods: 0.58 and 0.57. These results are consistent with the nature of machine learning algo-rithms, such as support vector machines and genetic algoalgo-rithms, which depend critically on the quality and size of training datasets (Larranaga et al., 2006;Perez-Riverolet al., 2012).
These algorithms were developed for peptide-mixture prediction where a large number of peptides can be used to train the model (Perez-Riverolet al., 2012). The recently developed Branca algo-rithm cannot be used to compute protein isoelectric points as it was only optimized for peptides with K or R at their C-terminus: it fails for proteins that do not have a basic C-terminus. This low correl-ation between experimental and predicted values demonstrated that only certain of the algorithms could be used forin silicostudies of the isoelectric point distribution in proteomes, such as those byWu et al. (2006)andCarugo (2007).
Fig. 1.Composition of isoelectric points from PIP-DB (2675 proteins) for the two datasets: unique proteins (proteins with only one isoelectric point value, 1066 proteins); and non-unique proteins (proteins with two or more pI experi-mental values, 1609). The chart shows the protein number versus pH distribu-tion for both subsets (pH range 3.0–10)
Fig. 2.Experimental versus theoretical isoelectric point of proteins from PID-DB. Five different combinations of methods and pKavalues and algorithms were used. Thex-axis corresponds to the experimental isoelectric point range of 3–10 and they-axis is the corresponding calculated values
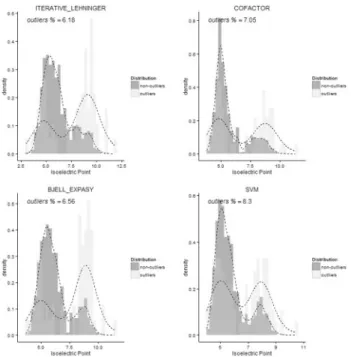
Figure 3shows the distribution of experimental isoelectric points and predicted distributions for several algorithms. The distribution of the experimental values only shows similarity to the theoretical distribution of the SVM (Perez-Riverol et al., 2012), Bjellquivst (Bjellqvistet al., 1993) and Iterative (with Lehninger pKaset) algo-rithms. We explored the correlation between the theoretical and ex-perimental isoelectric point of proteins for the complete PIP-DB database (Supplementary Information S2, Fig. 1) using four pKasets (DEFAUT, Expasy, CALIBRATED and SKOOG). The correlation for the CALIBRATED and ExpasypKsets is negative (R2¼ 0.017) for the entire PIP-DB. In contrast to peptides, over 50% of the pro-teins in our dataset have more than one experimental pI(Table 2), making it difficult to study this property properly, due to the historic use of poor analytical methods, together with protein denaturation and fragmentation (Ramoset al., 2012).
A potential use of pIprediction algorithms is the possibility to detect outliers from experimental data and detect possible incorrect assign-ment at the protein and peptide level (Perez-Riverolet al., 2011). The number of outliers also can be use as quality assessment metric of the separation technique (Ramoset al., 2011). If the algorithm is more ac-curate it tends to predict more outliers and possible false-positive identi-fications assignments.Figure 4shows the distribution of outliers and non-outliers, of four of the pIalgorithms under study. The SVM-based algorithm proposed by Perez-Riverol and co-workers in 2012 predicted the percentage of outliers, especially in the neutral and basic regions, where the method out-performs the other algorithms.
3.2 Isoelectric point estimation of peptide sequences
Results seen for the peptide dataset are markedly different: a high cor-relation was observed for most methods (Table 1). Although the top seven methods all show the same correlationR2¼0.96, the best result
is the SVM method (Perez-Riverolet al., 2012) which has the lowest RMSD (0.21).Figure 5shows the average pIand standard deviation from IEF fractions from the peptide dataset analyzed. The largest stand-ard deviation was found in the 5–7 pIrange. The best correlation is always observed in the acid fractions (Fig. 4). In this region, most of the Fig. 3.Distribution of isoelectric point for different methods and the
experi-mental distribution. They-axis is the number of proteins for the correspond-ing isoelectric point value (x-axis)
Table 2.Protein occurrence in PIP-DB
Occurrences 1 2 3 4 5 6 7 8 9 10 11 12 13 15 >15
Number of proteins
1042 183 81 41 30 21 14 8 4 5 3 3 2 1 8
Over 50% of proteins are found with at least 2 experimental isoelectric point value associated.
Fig. 4.Distribution of outliers and non-outliers populations of the PIPDB por-tion evaluated. An outliers is defined if: Abs(pIexperimental– pItheoretical)SD (pItheoretical)
Fig. 5.Experimental versus theoretical isoelectric point for 11 different pep-tide fractions of an OFF-GEL electrophoresis experiment (Heller dataset)
methods generated a good estimate for the peptides, with a pIbetween 4.0 and 5.0,where the lowest RMSD was obtained. Similar to the results obtained on PIP-DB analysis, the Iterative method used with the Patrickios pKaset fails fully in the complete dataset.
The Bjellquivst algorithm shows a higher number of outliers (black dots) in the basic fractions compare with the SVM algorithm (Supplementary Information S2, Fig. 2). Outlier (peptide with devi-ant pI) detection is highly dependent on both the accuracy of the pI estimation and the quality of the electrophoretic experiment (Ramos et al., 2011). Predicted pIs can be applied to remove less likely iden-tified peptides and to curate the final protein identification result lists in a shotgun proteomics experiment (Perez-Riverol et al., 2011). Importantly an outlier may not necessarily imply an estima-tion error, but may indicate the presence of one or more posttransla-tional modifications (Lengqvistet al., 2011).
Interestingly, no major changes in the correlation values are observed when different pKa sets are used with the Bjellqvist method, 0.95–0.96; this suggests that most of the pKas values pub-lished after Bjellqvist (Bjellqvistet al., 1993) only perform better in certain analytical settings (Table 1). A similar trend is observed for the Iterative method; this again suggests that none of the sets of pKa values is optimal or is necessarily superior to any other, and in most cases different pKavalues should be used for different calculations. The cofactor method (Fig. 4) performs more poorly than most of the algorithms as it was designed to study acid fractions only (Cargile et al., 2008). The recent Branca algorithm also exhibited a poor per-formance on this dataset (R2¼0.85,Table 1). It was also designed and trained to study peptides in acid fractions by adding corrections to the original pKasets proposed by Bjellquivst. For this reason, in basic ranges the algorithm has a low correlation coefficient and a high RMSD value (Fig. 4).
In contrast, other methods such as SVM, Bjellqvist and Iterative (with certain pKasets) show better behavior throughout the frac-tions analyzed. The confidence intervals indicating the ability to pre-dict near to an ideal performance (pIexperimentalversus pIpredicted) are closest for these last algorithms.
3.3 Isoelectric point estimation of modified peptides
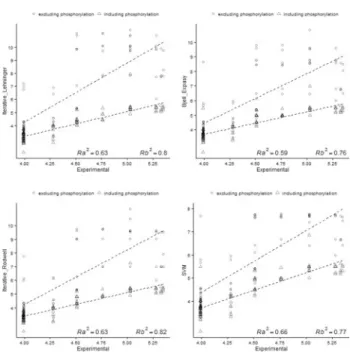
Post-translational and experimentally induced peptide modifications can shift peptide pI compared to the values estimated for the unmodified sequence in two ways: (i) by introducing charged groups or (ii) by neutralizing charged groups (Ramoset al., 2011). The re-sults presented in Section 3.2, show for most of the algorithms, a good correlation between the predicted and experimental pIvalues of peptides on a ‘non-modified’ dataset. However, an extended ana-lysis taking into account post-translational modifications such as phosphorylation and N-terminal acetylation will provide a more ac-curate representation of a real electrophoretic experiment.Figures 6
and7show the experimental pIvalues versus the predicted phos-phopeptide and acetylated peptide pIand also the non-modified variants for several pI algorithms, with a previously reported dataset (Gauciet al., 2008). The best correlation was obtained when the modification was considered during the estimation of the theoretical pI, increasing the correlation from 0.4 to 0.9 for most of the algorithms (Supplementary Information S3), demonstrating the dramatic effect of post-translational modifications on pI estimation.
When the N-terminus of a peptide is acetylated, a positive charge is lost, decreasing the overall charge of the peptide (Gauciet al., 2008;Lengqvistet al., 2011). Correspondingly, phosphorylation af-fects the charge of a peptide by adding a negatively charged group
(Halligan, 2009;Ramoset al., 2011).Figure 7shows that the im-pact of acetylation is more predominant to phosphorylation, making results poorer if acetylation is not take into account. If those PTMs are not considered during predictions andin silicostudies, the final results can be completely different to the real experiment, especially, Fig. 6.Correlation between predicted pIversus experimental pI.The plots show the correlation obtained if Phosphorylation is exclude (*) or include (D) in the pIcalculation.RaandRbdenote the correlation coefficients excluding and including the modification in the estimation respectively. The pKaand pKbvalues of 1.2 and 6.5 for phosphorylation S and T were used to consider the phosphorylation effect in the pIestimation
Fig. 7.Correlation between predicted pIversus experimental pI.The plots show the correlation obtained if N-terminal acetylation is exclude (*) or in-clude (D) in the pIcalculation.RaandRbdenote the correlation coefficients excluding and including the modification in the estimation respectively. The pIof the N-terminal acetylated peptides was calculated by omitting the pK values of the N-terminal residue in the peptide sequence
the acetylation due the distribution of Lysine and N-terminally in tryptic proteomes (Perez-Riverolet al., 2011).
4 Discussion
Our benchmarking comparison constitutes a strong blind test, since no method is in any way optimized for this particular data set and all the proteins and corresponding isoelectric points were collected from different sources and correspond to distinct analytical settings. The present study demonstrates that the algorithms from Bjellqvist et al.and Perez-Riverolet al.represent the most accurate algorithms overall for computing protein isoelectric points. The results also demonstrate that when other pKasets are employed no significant differences were seen for the Bjellqvistet al.approach, and most of the small differences observed can be related to specific analytical conditions specific to the experiment. The poor performance of all evaluated algorithms for the single value protein dataset is alarming. There are several possible explanations for this behaviour. The data-set was evaluated using a variety of methods over many decades. Thus the intrinsic variation will arise both from true biological vari-ation (the presence of unknown processed or truncated proteins or proteins with charged post-translational modifications, etc.) and other errors introduced by a gallimaufry of different experimental protocols, each with distinct and incommensurable calibration. The low correlation between experimental and predicted values throws serious doubt on the veracity of many theoretical studies of isoelec-tric point distributions in whole proteomes, such as the studies by
Wuet al. (2006)andCarugo (2007), and any arguments made on that basis. An alternative exegesis posits that PIP-DB must contain a large number of annotation errors, as introduced during database construction, which seriously contaminates the result. This is clearly possible, if highly unlikely.
In IEF gels or SDS-PAGE experiments, it is common to find the same polypeptide instance through multiple experimental fractions, due to diffusion phenomena, or from uneven cutting during band excision across of the gel. In addition, the peptides or proteins could have precipitated out of solution during migration from the well to the appropriate pH in the gel.
Possible aggregation and degradation could contribute to en-hance inappropriate focalization, making it difficult to correctly in-terpret the results obtained. It has also been shown that not only the amino acid composition but also its subsequent modification can in-fluence the accurate estimation of the isoelectric point, e.g. common modifications such as phosphorylation and acetylation which might lead to the shielding of surface charges (as previously described in Section 3.3). PIP-DB illustrates this complex scenario as shown in theTable 3. It contains multiple proteins that may be ‘detectable’ in both acid and basic region, showing a wide focalization zone. Most pIprediction methods do not take into account such ‘artifacts’ and will thus fail to make accurate estimates.
These results also highlight the need for a complete and customiz-able tool that can provide all availcustomiz-able algorithms and pKasets for iso-electric point analysis. The machine-learning algorithms, especially the SVM-based algorithm, showed a superior performance when studying peptide mixtures. In general, learning-based pI prediction methods (such as Cofactor, SVM and Branca) require a large training dataset and their resulting performance will strongly depend of the quality of that data. Even though Cofactor and Branca algorithms are based on learning approaches, it is not possible to retrain these algorithms with different datasets. In this sense, the SVM approach shows more ‘flexibil-ity’ in pIcomputation, and this feature can improve prediction accur-acy. In contrast with Iterative methods, machine-learning algorithms
have the advantage of being able to add new features to improve predic-tion. Considering the amount of pKasets reported to date, use of the Iterative approach provides a good opportunity to find some variant that fits well with particular experimental conditions. In the near future, new algorithms and bioinformatics tools should be able to provide a way of choosing different pKasets and thus obtain more accurate pre-diction for a given analytical setting. The SVM and Cofactor methods should only be used where a high number of sequences are studied and can thus be used to train the algorithms. We observed notable fluctu-ations in pIpredictions for Iterative methods on a small dataset, show-ing this method to be sensitive to small changes in the amino acid pKa values used. Moreover, the algorithm fails when certain pKavalues are missing. We envisage that more algorithms based on machine learning, including new additional features, should be explored allowing the de-velopment of fast, accurate and reliable pIcalculation algorithms for use in future protein and peptide proteomic analysis.
Funding
Y.P-R. is supported by the BBSRC ‘PROCESS’ grant [BB/K01997X/1]. Conflict of Interest: none declared.
References
Audain,E.et al. (2014) A survey of molecular descriptors used in mass spec-trometry based proteomics.Curr. Top. Med. Chem.,14, 388–397. Bjellqvist,B.et al. (1993) The focusing positions of polypeptides in
immobi-lized pH gradients can be predicted from their amino acid sequences. Electrophoresis,14, 1023–1031.
Branca,R.M.et al. (2014) HiRIEF LC-MS enables deep proteome coverage and unbiased proteogenomics.Nat. Methods,11, 59–62.
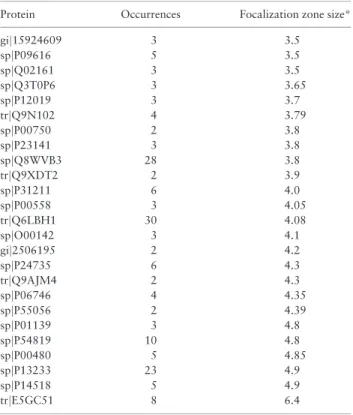
Table 3. Proteins with a wide focalization zone in PIP-DB
Protein Occurrences Focalization zone size*
gij15924609 3 3.5 spjP09616 5 3.5 spjQ02161 3 3.5 spjQ3T0P6 3 3.65 spjP12019 3 3.7 trjQ9N102 4 3.79 spjP00750 2 3.8 spjP23141 3 3.8 spjQ8WVB3 28 3.8 trjQ9XDT2 2 3.9 spjP31211 6 4.0 spjP00558 3 4.05 trjQ6LBH1 30 4.08 spjO00142 3 4.1 gij2506195 2 4.2 spjP24735 6 4.3 trjQ9AJM4 2 4.3 spjP06746 4 4.35 spjP55056 2 4.39 spjP01139 3 4.8 spjP54819 10 4.8 spjP00480 5 4.85 spjP13233 23 4.9 spjP14518 5 4.9 trjE5GC51 8 6.4
* Defined by the difference between the maximal and minimal pI experi-mental value found for the protein in PIP-DB.
Bunkute,E. et al. (2015) PIP-DB: the Protein Isoelectric Point database. Bioinformatics,31, 295–296.
Cargile,B.J.et al. (2004) Gel based isoelectric focusing of peptides and the utility of isoelectric point in protein identification.J. Proteome Res.,3, 112–119. Cargile,B.J. et al. (2008) Calculation of the isoelectric point of tryptic
peptides in the pH 3.5–4.5 range based on adjacent amino acid effects. Electrophoresis,29, 2768–2778.
Carugo,O. (2007) Isoelectric points of multi-domain proteins. Bioinformation,2, 101–104.
Gauci,S.et al. (2008) A versatile peptide pI calculator for phosphorylated and N-terminal acetylated peptides experimentally tested using peptide isoelec-tric focusing.Proteomics,8, 4898–4906.
Halligan,B.D. (2009) ProMoST: a tool for calculating the pI and molecular mass of phosphorylated and modified proteins on two-dimensional gels. Methods Mol. Biol.,527, 283–298, ix.
Heller,M.et al. (2005) Added value for tandem mass spectrometry shotgun proteomics data validation through isoelectric focusing of peptides, J Proteome Res.,4, 2273–2282.
Henriksson,G.et al. (1995) Calculation of the isoelectric points of native pro-teins with spreading of pKa values.Electrophoresis,16, 1377–1380. Larranaga,P. et al. (2006) Machine learning in bioinformatics. Brief
Bioinform.,7, 86–112.
Lengqvist,J.et al. (2011) Observed peptide pI and retention time shifts as a re-sult of post-translational modifications in multidimensional separations using narrow-range IPG-IEF.Amino Acids,40, 697–711.
Leprevost,F.V.et al. (2014) On best practices in the development of bioinfor-matics software.Front. Genet.,5.
Maldonado,A.A.et al. (2010) Isoelectric point, electric charge, and nomencla-ture of the acid-base residues of proteins. Biochem. Mol. Biol. Educ. Bimonthly Publ. Int. Union Biochem. Mol. Biol.,38, 230–237.
Patrickios,C.S. and Yamasaki,E.N. (1995) Polypeptide amino acid compos-ition and isoelectric point. II. Comparison between experiment and theory. Anal. Biochem.,231, 82–91.
Perez-Riverol,Y.et al. (2012) Isoelectric point optimization using peptide descrip-tors and support vector machines.J. Proteomics,75, 2269–2274.
Perez-Riverol,Y.et al. (2013) Computational proteomics pitfalls and challenges: HavanaBioinfo 2012 workshop report.J. Proteomics,87, 134–138. Perez-Riverol,Y. et al. (2011) In silico analysis of accurate proteomics,
complemented by selective isolation of peptides. J. Proteomics, 74, 2071–2082.
Perez-Riverol,Y.et al. (2012) A parallel systematic-Monte Carlo algorithm for exploring conformational space.Curr. Top. Med. Chem.,12, 1790–1796. Perez-Riverol,Y.et al. (2014) Open source libraries and frameworks for mass
spectrometry based proteomics: a developer’s perspective. Biochim. Biophys. Acta,1844, 63–76.
Ramos,Y.et al. (2012) Peptide fractionation by SDS-free polyacrylamide gel electrophoresis for proteomic analysis via DF-PAGE.Methods Mol. Biol.,
869, 197–204.
Ramos,Y.et al. (2011) Peptide fractionation by acid pH SDS-free electrophor-esis.Electrophoresis,32, 1323–1326.
Ramos,Y.et al. (2008) Proteomics based on peptide fractionation by SDS-free PAGE.J. Proteome Res.,7, 2427–2434.
Wu,S.et al. (2006) Multi-modality of pI distribution in whole proteome. Proteomics,6, 449–455.