Ha, M-H and Yang, Z
Comparative analysis of port performance indicators: Independency and interdependency
http://researchonline.ljmu.ac.uk/id/eprint/7225/
Article
LJMU has developed LJMU Research Online for users to access the research output of the University more effectively. Copyright © and Moral Rights for the papers on this site are retained by the individual authors and/or other copyright owners. Users may download and/or print one copy of any article(s) in LJMU Research Online to facilitate their private study or for non-commercial research. You may not engage in further distribution of the material or use it for any profit-making activities or any commercial gain.
The version presented here may differ from the published version or from the version of the record. Please see the repository URL above for details on accessing the published version and note that access may require a subscription.
For more information please contact [email protected]
http://researchonline.ljmu.ac.uk/
Citation (please note it is advisable to refer to the publisher’s version if you intend to cite from this work)
Ha, M-H and Yang, Z (2017) Comparative analysis of port performance indicators: Independency and interdependency. Transportation Research Part A: Policy and Practice, 103. pp. 264-278. ISSN 0965-8564
Comparative analysis of port performance indicators: independency and
interdependency
Min-Ho Ha1, Zaili Yang1*
1Liverpool Logistics Offshore and Marine Research Institute (LOOM), Liverpool John Moores
University
Abstract
Port performance measurement (PPM) and comparison research, presenting a multiple criteria decision making (MCDM) issue in nature, has been intensively conducted by researchers from both decision science on modelling and port studies from empirical perspectives. Assigning an appropriate weight to each defined port performance indicator (PPI) is essential for rational decision and precise performance measurement. However, PPIs are often presented in a hierarchy, having the interdependency among them ignored. It causes concerns on the accuracy of PPIs’ weight allocation and arguments on the performance measurement results, revealing a significant research gap to be addressed. As far as MCDM modelling is concerned, the importance of criteria has been studied utilising either absolute or relative comparisons, while the calculation of their importance also takes into account both independency and interdependency factors. However, there is lack of empirical studies in the literature to provide supporting evidence to distinguish the different impacts of the two factors. This study aims to compare the analysis of PPIs importance when taking into account their independent relationship using an analytic hierarchy process (AHP) and their interdependent relationship using a decision making trial and evaluation laboratory (DEMATEL) incorporating an analytic network process (ANP), respectively. The same domain experts are invited to evaluate the importance of the defined PPIs based on both approaches. The results demonstrate that a similar variance of relative importance across the PPIs but a clear difference on their importance scores and ranking. As a result, the results make contributions to fulfil the research gap on consideration of interdependency among PPIs in PPM and on the provision of convincing empirical evidence to highlight the impact of interdependency of criteria on MCDM modelling. Another practical significance draw from this study is that use of DEMATEL can aid port stakeholders to make more rational decision as to whether the interdependency among PPIs should be taken into account in PPM and/or port choice.
1. Introduction
Container ports are playing a pivotal role in facilitating global logistics and supply chains. In the era of global supply chains, the port industry has however been facing the challenges, arising on the one hand from the different interests of port stakeholders and on the other hand from the increasingly competitive business environments. Conflicts of interests between the
stakeholders require one (of them) to interpret the others’ assertiveness rightly by delivering mutual benefits to all related parties. Consequently, the analysis of their interests and needs on various dimensions of port activities becomes essential. The process of the analysis is in nature a multiple criteria decision making (MCDM) problem that involves multiple criteria of both quantitative and qualitative features.
The literature with regard to the methods of weighting criteria in the context of MCDM has been carefully reviewed, including the studies such as Gabus and Fontela, 1973; Saaty, 1980; Hwang and Yoon, 1981; Saaty, 1996; Chen, 2000; Yang, 2001; Liou et al., 2007; Wang and Chang, 2007; Shieh et al., 2008; Chen and Chen, 2010; Najmi and Makui, 2010; Yang et al., 2011; Buyukozkan and Cifci, 2012. Using absolute or relative comparisons, the weights can be assigned to each criterion. In the weight assignments, the criteria in a MCDM problem are considered independently or interdependently. The former is formed as a linear hierarchy whilst the latter is demonstrated as a non-linear network. Although many MCDM problems have been studied using both approaches, it is not true that one always presents better results than another (Satty 2001), requiring more evidence obtained from empirical studies. Meantime, it has been widely recognised but not well addressed yet that despite many advanced approaches in MCDM, scholars and practitioners have done little on the comparative analysis of independency and interdependency among criteria to provide empirical evidence to assess the influence of their interdependency. Furthermore, based on the search on Web of Science, in all the relevant papers dealing with “port choice”, “port selection”, and “port competitiveness”, the factors/attributes influencing decision making have been considered independently (Yeo et al., 2014), although the existence of the interdependency among the factors has been widely recognised (Lee et al., 2013). To address this research need and also fulfil the gap on PPIs’ independency study in port studies, this study uses an analytic hierarchy process (AHP) to conduct independent weight assignments, while applying a decision making trial and evaluation laboratory (DEMATEL) incorporating an analytic network process (ANP) to catch interdependent features between the criteria. The use of the hybrid of DEMATEL and ANP in this study is because of their capability of dealing with (1) complex decision problems, (2) both quantitative and qualitative PPIs and (3) group decision-making with a relatively small sample size for analysis (Shieh et al., 2010; Buyukozkan and Cifci, 2012; Ha et al., 2017). Furthermore, using DEMATEL to screen significant interdependency among the PPIs can avoid costly and time-consuming data collection when requiring various types of questionnaire surveys, while having ANP to quantify the interdependency based on its sound mathematics and psychology leads to improved judgements reliability. The same group of domain experts are invited to evaluate the importance of PPIs based on both approaches of AHP only and the hybrid of DEMATEL and ANP. The comparative analysis provides the stakeholders especially for ports (i.e. terminal operators, port authorities) with valuable insights to prioritise investment for competitiveness improvement by adjusting their strategies based on the relative importance of criteria.
In the next section, theoretical background of the AHP, DEMATEL and ANP as well as their associated calculation algorithms are introduced. In section 3, the selection of port performance indicators (PPIs) is carefully described. In section 4, the process of analysing the relative importance of the PPIs obtained by AHP and DEMATEL-ANP is presented in Section 5. It is
complemented by the detailed comparative analysis with respect to the most important PPIs from the two approaches and provides useful practical guides for the development of investment strategies. Section 6 concludes the paper with its insights and limitations.
2. Methodology
2.1. The use of AHP to PPIs’ independency
The AHP introduced by Satty (1980) assumes independence of one cluster from another but it does not allow for feedbacks between clusters in a hierarchy (Saaty, 2001). Accordingly, the hierarchy is a simple structure to decompose a complex problem through identifying unidirectional cause effect explanations with a linear chain (Saaty and Takizawa, 1986). This tool is useful for dealing with MCDM problems and aids decision makers to capture both subjective and objective aspects of a decision (Saaty, 2001). The decision is made based on scores obtained by pairwise comparisons between the criteria, in other words, the higher the score is, the more important the criterion.
In this study, the relative weights of the independent PPIs at the same level can be obtained using pair-wise comparisons. A number of selected experts are approached to respond to a question such as “which PPI should be emphasized more in a port performance management (PPM), and how much more?” A series of pairwise comparisons are developed based on the Saaty’s nine-point scale ranging from 1 (equal) to 9 (extreme). Then, the local weights of PPIs can be obtained by following Eqs. (1)-(3) (Satty, 1980). Let 𝑒𝑖𝑗𝑙 be the relative importance judgement on the pair of PPIs 𝑃𝑖 and 𝑃𝑗(𝑖, 𝑗 = 1,2, … . . 𝑛) by 𝑙th expert. Then, the aggregated weight comparison between 𝑃𝑖 and 𝑃𝑗 by 𝑚 experts (𝑙 ∈ 𝑚) can be obtained by Eq. (1).
𝑒𝑖𝑗 =
1
𝑚 (𝑒𝑖𝑗1 + ⋯ + 𝑒𝑖𝑗𝑙 + ⋯ + 𝑒𝑖𝑗𝑚) (1)
Next, the synthesised 𝑖𝑡ℎ criterion weight comparison between 𝑃𝑖 and 𝑃𝑗 by 𝑚 experts can be calculated using Eq. (2).
𝑤𝑖= 1 𝑛∑ ( 𝑒𝑖𝑗 ∑𝑛𝑖=1𝑒𝑖𝑗 ) 𝑛 𝑗=1 ∑ 𝑤𝑖 𝑛 𝑖=1 = 1 (2)
Lastly, another critical characteristic of the AHP is the consistency of the pairwise judgements by calculating a Consistency Ratio (CR) in Eq. (3). When the value of CR is greater than 0.1, an inconsistency in the pairwise judgements appears and the experts need to revise their pairwise judgements. Therefore, the judgements should inform an acceptable level with the CR of 0.10 or less. In Eq. (3), CI is consistency index, 𝜆𝑚𝑎𝑥 is the principal eigenvalue of
the comparison matrix, RI is average random index and 𝑛 is the number of PPIs. 𝐶𝐼 =𝜆𝑚𝑎𝑥−𝑛 𝑛−1 𝐶𝑅 = 𝐶𝐼 𝑅𝐼(𝑅𝑎𝑛𝑑𝑜𝑚 𝑐𝑜𝑛𝑠𝑖𝑠𝑡𝑒𝑛𝑐𝑦 𝑖𝑛𝑑𝑒𝑥) 𝜆𝑚𝑎𝑥 = ∑ ∑𝑛𝑖=1𝑤𝑤𝑖𝑒𝑗𝑖 𝑗 𝑛 𝑗=1 𝑛 (3)
It is noteworthy that the weights obtained are local weights at the same level. In multi-level structures, further computation needs to be conducted to obtain normalised weights of the bottom level PPIs by multiplying the weights of their parent PPIs at the upper level in the hierarchy.
The usage of this tool is enormous across different disciplines, including those in the maritime and port sectors such as shipping company performance assessment (Chou and Liang, 2001), port selection (Lirn et al., 2004), port competitiveness (Song and Yeo, 2004), port’s political risk assessment (Tsai and Su, 2005), ship registry selection (Celik et al, 2009). Chou and Liang (2001) employed AHP to construct subjective weights of all criteria and sub-criteria for shipping company performance evaluation. In Song and Yeo (2004), the competitiveness of eight Chinese ports was evaluated using AHP in terms of their competitiveness on four criteria including cargo volume, port facility, port location and service level. Tsai and Su investigated the political risk of 5 major Asian ports with respect to both micro and macro risk factors and the risk level of the ports was obtained by AHP calculations. Celik et al. (2009) utilised AHP to model the shipping registry selection and the model was applied in Turkish maritime industry. All the above research considered the criteria to be independent even though some of the criteria are recognised to be closely inter-related, which as a result could delivery error-prone results.
2.2. The use of DEMATEL and ANP to model PPIs’ interdependency
Many complex decision problems need to be explained through a network structure because they involve various interplays and interdependences within a cluster and between clusters at the same level or different levels (Saaty, 2001). Given this complexity, decision makers may require an essential understanding of the cause-effect relationship between the criteria (Chen and Chen 2010). A network structure is a special case of a hierarchy which allows for feedbacks between clusters. As shown in Fig. 1, both a linear hierarchy and a non-linear network allow for inner dependence between elements within a cluster, but a non-linear network makes it possible to identify and analyse interdependency both within a cluster and between clusters (Saaty, 2001). The former is called an inner dependence and the latter is called an outer dependence, respectively.
We use a hybrid approach by incorporating DEMATEL in ANP to determine interdependent weights between PPIs in PPM. An integrated method of DEMATEL and ANP has been proven to be a successful tool for measuring dependence and feedbacks among elements in complex decision problems through various applications such as airline safety measurement (Liou et al., 2007), service quality (Shieh et al., 2010), supply chain performance (Najmi and Makui, 2010), innovation operation (Chen and Chen, 2010) and green suppliers selection (Buyukozkan and Cifci, 2012). However, its feasibility in modelling PPM has not been investigated yet. More importantly, its influence on accuracy of PPM compared to the case in which PPIs are treated independently has not been analysed, often leaving port stakeholders to make irrational investment strategies in a situation where the PPIs are of high interdependency.
In this study, the DEMATEL is first used to identify whether there are significant interdependent relationships among the PPIs while the ANP is then applied to determine the
intensity of the relationships among the PPIs from a quantitative perspective. Here if the result from the initial DEMATEL analysis showed insignificant interdependency among the investigated PPIs, then the AHP approach described in Section 2.1 is used.
Note: Cluster N (𝐶𝑁, N=1,2,3) includes its associated elements (𝑒𝑁1, 𝑒𝑁2, 𝑒𝑁𝑛𝑁)
Fig. 1. Structural difference between a hierarchy and a network model 2.2.1. DEMATEL to identify interrelations among the PPIs
The DEMATEL approach was introduced by the Science and Human Affairs Program of the Battelle Memorial Institute in Geneva Research Centre between 1972 and 1976 for investigating and solving the complicated and intertwined social problems (Wu et al., 2010). The method is a structural modelling approach, which can divide the criteria into the cause and effect groups. Based on the directed graph, known as digraph, it makes it possible to demonstrate the directed relationships and interdependency of the criteria (Liou et al., 2007; Buyukozkan and Cifci, 2012). In addition, the digraph enables stakeholders to predict management behaviour and business and financial strategies of a firm, by taking into account interdependent influences among the criteria (Lee and Lin, 2013).
Using the DEMATEL in the context of PPIs, suppose a set of 𝑛 basic PPIs as 𝑆 = {𝑥1 𝑥2 … 𝑥𝑖 … 𝑥𝑛−1 𝑥𝑛 }, in which 𝑥𝑖 is 𝑖𝑡ℎ indicator of basic PPIs (𝑖 = 1 … or 𝑛) and 𝑆 represents the associated upper level PPI of all 𝑥𝑖. The relations among the PPIs can be computed as follows.
Step 1: obtain an initial direct-relation matrix 𝑍.
The initial direct-relation matrix 𝑍 is an average 𝑛 × 𝑛 matrix constructed by pair-wise comparisons in terms of directions and strength of influences between PPIs. The pair-wise comparison scale for this study is ranged from 0 to 4 representing ‘0 (no influence)’, ‘1 (low influence)’, ‘2 (medium influence), ‘3 (high influence)’ and ‘4 (very high influence)’, respectively. As shown in Eq. (4), the initial direct-relation matrix 𝑍 = [𝑧𝑖𝑗]𝑛×𝑛, where 𝑧𝑖𝑗 is denoted as an average direct-relation value of 𝑥𝑖𝑗 and all principal diagonal 𝑧𝑖𝑗 (𝑖 = 𝑗) are
equal to zero, 𝑋𝑘 = [𝑥𝑖𝑗𝑘] is an expert judgement on causal relationship between 𝑥𝑖𝑗 by the
𝑘𝑡ℎ expert.
𝑍 = [𝑧𝑖𝑗]𝑛×𝑛= 𝑚1 ∑𝑚𝑘=1𝑥𝑖𝑗𝑘, i, j = 1…n (4)
Step 2: calculate a normalised direct-relation matrix 𝐷. Cluster 1 Cluster 2 Cluster 3 A linear hierarchy Cluster 1 Cluster 2 A non-linear Cluster 3 Inner dependence Outer dependence
The normalised direct-relation matrix 𝐷 = [𝑑𝑖𝑗]𝑛×𝑛, where the value of each PPI in matrix 𝐷 is 0 ≤ 𝑑𝑖𝑗 ≤ 1, can be obtained through following Eq. (5). In order to obtain a coefficient
𝑠, the maximum value of the sum of each row and column is used. 𝐷 = 𝑠 · 𝑍 𝑜𝑟 [𝑑𝑖𝑗]𝑛×𝑛 = 𝑠 · [𝑧𝑖𝑗]𝑛×𝑛, 𝑠 > 0 𝑠 = 𝑚𝑖𝑛 [ 1 𝑚𝑎𝑥1 ≤ 𝑖 ≤ 𝑛 ∑𝑛 𝑧𝑖𝑗 𝑗=1 , 1 𝑚𝑎𝑥1 ≤ 𝑖 ≤ 𝑛 ∑𝑛 𝑧𝑖𝑗 𝑖=1 ] 𝑖, 𝑗 = 1, 2, … . , 𝑛 (5)
Step 3: obtain a total-relation matrix 𝑇 and its sum of rows and columns.
The total-relation matrix 𝑇 is obtained by operation of the normalised direct-relation matrix 𝐷 using Eq. (6), in which 𝐼 is denoted as the identity matrix. In Eq. (7), 𝑅𝑖 and 𝐶𝑗
denote the sum of rows and columns in the matrix 𝑇 respectively, in which 𝑡𝑖𝑗 indicating the interdependent value of each pair of the investigated PPIs. Furthermore, the horizontal axis value 𝑝𝑟𝑖+ called ‘‘Prominence’’ indicates how crucial the 𝑖𝑡ℎ PPI is, whist the vertical axis value 𝑝𝑟𝑖− called “Relation” makes the PPI classified into the cause and effect group. When the value of 𝑝𝑟𝑖− is positive, the PPI is classified into the cause group, whereas the value of 𝑝𝑟𝑖− is negative, the PPI is grouped into the effect group.
𝑇 = lim 𝑚=∞(𝐷 1+ 𝐷2+ ⋯ + 𝐷𝑚) = ∑∞ 𝐷𝑖 𝑚=1 = 𝐷(𝐼 − 𝐷)−1 (6) 𝑅𝑖 = ∑𝑛 𝑡𝑖𝑗 𝑗=1 , 𝐶𝑗 = ∑𝑛𝑖=1𝑡𝑖𝑗 (i, 𝑗 = 1, 2, … . . , 𝑛) 𝑝𝑟𝑖+ = 𝑅 𝑖 + 𝐶𝑖 𝑝𝑟𝑖− = 𝑅𝑖 − 𝐶𝑖 (7)
Step 4: obtain a threshold value (α) and construct a digraph.
The threshold value is obtained by either subjective judgement by experts (Liou et al, 2007) or mathematical equation (Shieh et al, 2010). The aim of setting a threshold value (α) is to filter and eliminate the PPIs that have trivial influence on others in the matrix 𝑇. In this paper, the threshold value is computed by the average value of 𝑡𝑖𝑗, where 𝑁 indicates the total number of elements (𝑖 × 𝑗). Only the PPIs whose influence values of 𝑡𝑖𝑗 are higher than the threshold value can be chosen and converted into a causal relationship diagram (digraph).
𝛼 =∑ ∑ 𝑡𝑖𝑗 𝑛 𝑗=1 𝑛 𝑖=1 𝑁 (8)
2.2.2. ANP to determine PPIs’ interdependency weights
After identifying interdependent relationships between the PPIs, the ANP method is used to obtain the final adjusted weights (i.e. global weights). The ANP is a relative method developed on the basis of the AHP to solve the case of dependence and feedbacks among the criteria/alternatives (Saaty, 1996). Unlike the AHP, the ANP allows interaction and feedbacks both between clusters (outer dependence) and within cluster (inner dependence) (Saaty 2001). The former is interaction between the elements in the different clusters whilst the latter is the influence between elements in the same cluster. Another feature of the ANP is to generalise a super-matrix, the partitioned matrix constituted by a set of sub-matrix indicates interdependent relationships between the clusters in decision networks (Saaty 2001). The super-matrix (unweighted super-matrix) of the non-liner network structure in Fig. 1 can be expressed as
𝑊 = [
𝑊11 𝑊12 𝑊13
𝑊21 𝑊22 0
0 𝑊32 0
]
where 𝑊12 is a matrix that demonstrates the weights of cluster 1 with respect to cluster 2, 𝑊21 is the weights of cluster 2 with respect to cluster 1, and both 𝑊11 and 𝑊22 are denoted as the inner dependence and feedbacks within the cluster 1 and cluster 2, respectively, and so on. It is noteworthy that the unweighted super matrix (𝑊𝑁𝑁) includes their associated elements’ unweighted super-matrix. Thus, the i, j block of the matrix (𝑊𝑁𝑁) is given by
𝑊𝑖𝑗 = [ 𝑤𝑖1(𝑗1) 𝑤𝑖1(𝑗2) 𝑤𝑖2(𝑗1) 𝑤𝑖2(𝑗2) … 𝑤𝑖1(𝑗𝑛𝑗) … 𝑤𝑖2(𝑗𝑛𝑗) … . … 𝑤𝑖𝑛(𝑗1)𝑖 𝑤𝑖𝑛(𝑗2)𝑖 … .. … 𝑤𝑖𝑛(𝑗𝑛𝑗𝑖) ]
Then, a weighted super-matrix 𝑤𝐴𝑁𝑃 can be obtained through multiplying the partitioned matrix 𝐵 (=𝑊𝑖𝑗) in unweighted super matrix by their associated cluster weights 𝑤𝑖 (Saaty,
2001).
𝑤𝐴𝑁𝑃 = 𝐵𝑤𝑖 (9)
The pair-wise comparisons to obtain the matrix (𝐵) and 𝑤𝑖 are conducted based on the digraph of DEMATEL. Surveys are carried out in a form of questions, for example, such as “which PPI influences on PPI 1 more: PPI 2 or PPI 3? and how much more?” A series of pairwise comparisons are based on Saaty’s nine-point scale ranging from 1 (equal) to 9 (extreme). By repeating this process, a number of comparison matrices can be formed, which can identify the relative impacts of the principal-PPIs’ interdependency. The weights derived from pairwise comparisons are entered as the elements of columns of the matrix 𝐵. Then, a weighted supper-matrix can be normalised by setting all columns sum to unity. The sum of the probabilities of all states can be equal to one. Last, the limit supper matrix can be obtained by raising the weighted super-matrix to limiting powers using 𝑊∞ = lim
𝑘→∞𝑊
𝑘 until the column
of numbers is the same for every column. The values in column represent the global weights of the associated PPIs.
3. Identification of Port performance indicators
The PPIs for “overall container PPM” are identified in Ha et al. (2017). The potential PPIs which are mostly crucially used for measuring port performance were identified through industrial best practices and the broad areas of literature on port and shipping, logistic and supply chain management (SCM), and strategic management. In addition, we investigated crucial interests in major container ports by researching their missions, visions, goals, and objectives and discussed the found PPIs with port stakeholders. Previous studies suggested that port performance should come across the range of port activities to cope with new evolutionary changes (Marlow and Paixão Casaca, 2003; Bichou, 2006; Brooks 2006; Woo et al. 2011; Ri os and de Souse, 2014) and PPIs should allow the ports to measure and communicate their impacts on both its efficiency (De Oliveira and Cariou, 2015) and external society, economy
and environment (ESPO, 2010) as well as to be consistent with their goals (Kaplan and Norton, 2004). Sepcifically speaking, the selection of PPIs in this work was conducted through literature review and industrial practices in a pre-selection phase and then the Delphi technique based on semi-structured interviews was applied to assess the suitability of the potential indicators and to test the feasibility of the selected indicators (Okoli and Pawlowski, 2004). The aim of the semi-structured interviews in this study is to identify appropriate PPIs for PPM, and to verify whether the PPIs appropriately represent their associated upper-level PPIs. In other words, this survey is to investigate whether the PPIs can signify a number of properties such as their usability, adaptability and relevance to port stakeholders for PPM. The PPIs selection process is described as follows.
• Using purposive and snowball samplings (Saunders et al., 2012), we contacted 25 experts (i.e. terminal operators, shipping lines, logistics service providers, port authority/government and academia) to ask them to participate in the interviews. 9 experts (2 experts in each group except for port authority/government) replied the consent letters, but in order for fair representation from each group we invited 1 expert in government. They1 include (1) 6 industrial experts who have been working in the shipping and port industries for more than 15 years with PhD (1 expert from a shipping line), MSc (3 experts from a terminal operator, a shipping line and a forwarder) and BA (1 from a terminal operator and a forwarder, respectively) degrees; (2) 2 professors who have more than 15 years teaching and research experience in the port area; (3) 2 experts from government/port authorities (1 department manager and 1 managing director) who have been working for port logistics authorties. The list of potential PPIs and an information sheet that described the definitions of PPIs and calculations for quantitative PPIs were provided to each interviewee at least a week in advance before commencing the interviews. For example, ‘ship load rate denotes a rate of handling container volume per vessel capacity over a certain period of time. This PPI is a ratio of the combined two indicators of a container throughput volume and an average vessel capacity and can be calculated as the container throughput volume divided by the average vessel capacity’. The interviews were undertaken for 1 month between March and April in 2014.
• Before asking the related questions, we explained the relevant issues such as overlap among the PPIs. For example, some PPIs (i.e. vessel working time at berth, throughput/number of cranes, labour productivitcy, vessel turnaround, vessel waiting time, truck turnaround, container dwell time) have been used to measure port productivity (i.e. UNCTAD, 1976; De monie, 1987; Tongzon, 1995a; Tongzon, 1995b; Cullinane et al., 2006; Brooks, 2007), while PPIs of the similar nature (i.e. availability and capability of employees, capability of dockworkers, speed of stevedores’ cargo loading/unloading,
1 A panel of ten experts is invited to evaluate the importance of PPIs based on both approaches. The applied methods in this study require various types of questionnaire surveys to evaluate the importance of PPIs in multi-level structures (please refer to Section 4). According to authors’ experience on relevant research approaches, the judgements using pairwise comparisons demand high level of evaluators’ logical thinking driven from well understandings of research aim, process and each individual PPI and its upper level PPI. The judgements by the panel of experts throughout this research deliver reliable results with the CR of 0.10 or less so that authors can avoid costly and time-consuming data collection.
timely vessel turnaround, timeliness of maritime services) have also used to measure service quality (Marlow and Paixão, 2003; Woo et al., 2011; Brooks and Schellinck, 2013). These duplicate PPIs need to be clarified and classified appropriately to represent their associated upper-level indicators. In addition, we also take into account the collectability of the data because the performance of quantitative PPIs are evaluated using a number of quantitative data that are confidential and sensitive for terminal operators. • The majority of the experts commented on all dimensions for the validation of the PPI network construction. Through several iterations and feedbacks, some PPIs were modified, removed, divided or combined to one delegate PPI from the duplicated and correlated PPIs. For example, the sub-PPIs of the environment (EVS) were originally defined as ‘air pollution’, ‘land pollution’, ‘water pollution’, ‘energy consumption’ and ‘environment management systems’ but the majority of the panel members commented that the implementation schemes for reducing the specified sources of pollution are more important than the pollutions themselves. Furthermore, ‘throughput (TEUs)’ and ‘throughput growth (TEUs/year) are overlap. ‘Vessel calls (no. of vessels)’, ‘capacity of vessel calls (tons)’ and ‘vessel call size (tons/no. of vessels) growth’ are the same specific PPI group. ‘Vessel call size growth’ is a combined PPI of ‘vessel calls (number)’ and ‘capacity of vessel calls (tons)’. 2 interviewees preferred to use ‘throughput (TEUs)’, ‘vessel calls (number)’, ‘capacity of vessel calls (tons)’ for ‘output (OPC)’. For a longitudinal study, however, other 8 experts suggested to use ‘throughput growth (TEUs/year) and ‘vessel call size growth (tons/no. of vessels)’ to investigate the performance changes of port/terminal within different timeframes. Using a series of questions, we managed to probe deeply into the PPIs selection and understand exhaustively the answers provided.
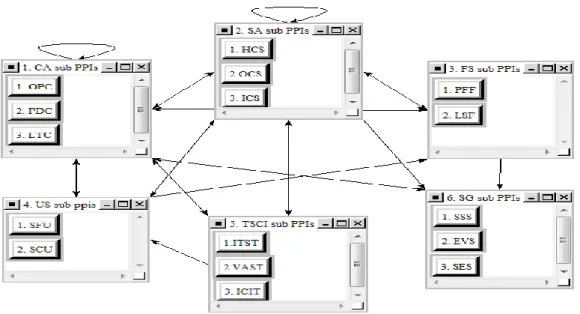
• Based on this, 60 PPIs are defined as representing indicators for container PPM under 16 principal-PPIs and 6 dimensions in Table 1. The 6 dimensions are 1) the extent to which the container port/terminal operates effectively and efficiently in its basic role regarding cargo/vessel handling (core activities, CA); 2) the extent to which the container port/terminal has reliable resources (e.g. HR and technology) in order to support core activities (supporting activities, SA); 3) the extent to which the container port/terminal indicates its financial condition (financial strength, FS); 4) the extent to which the port users are satisfied with port/terminal services delivered and service price (users satisfaction, US); 5) the extent to which the port/terminal achieves its supply chain integration (terminal supply chain integration, TSCI); 6) the extent to which the port/terminal contributes to socio-economic sustainable growth (sustainable growth, SG) (Table 1).
4. Comparisons between PPIs independency and interdependency 4.1. Evaluate PPIs’ relative weights using AHP.
The judgements of five among the ten evaluators2 have been verified with the CR of 0.10
or less by using Eq. (3). Generally, the value of CR is greater than 0.1 and the evaluators need to revise their pairwise judgements. Therefore, five judgements presenting consistent input data, which are sufficient to provide a reasonable AHP outcome (Bottani and Rizzi, 2006; Büyüközkan et al., 2012) are used to derive the weights of the criteria.
Using Eqs. (1)-(2), the weights judged by the five evaluators on the six dimensions (i.e. core activities, supporting activities, financial strength, users satisfaction, terminal supply chain integration and sustainable growth) at the second level are obtained as 0.310, 0.128, 0.151, 0.225, 0.116 and 0.07, respectively (Table 1). Core activities are considered to be the most important dimension and followed by user satisfaction, financial strength, supporting activities, terminal supply chain integration and sustainable growth. Similarly, the weights of the third-level and the bottom-third-level criteria can be obtained. It is noteworthy that the obtained weights are local weights at the same level. Further computation has been conducted to obtain normalised weights of the bottom level criteria by multiplying their local weights with the ones of their associated upper level criteria. For instance, the normalised weight of ‘throughput growth’ can be obtained as 0.055 (=0.310 (the local weight of core activities) × 0.257 (the local weight of output) × 0.696 (the local weight of throughput)).
Table 1. Port performance indicators (PPIs) and their relative weights (independency)
Local weight Global weight
Core activities (CA) 0.310
Output (OPC) 0.257
Throughput growth (OPC1) 0.696 0.055
Vessel call size growth (OPC2) 0.304 0.024
Productivity (PDC) 0.522
Ship load rate (PDC1) 0.158 0.026
Berth utilization (PDC2) 0.132 0.021 Berth occupancy (PDC3) 0.107 0.017 Crane productivity (PDC4) 0.345 0.056 Yard utilization (PDC5) 0.103 0.017 Labour productivity (PDC6) 0.155 0.025 Lead time (LTC) 0.221 Vessel turnaround (LTC1) 0.602 0.041 Truck turnaround (LTC2) 0.185 0.013
Container dwell time (LTC3) 0.213 0.015
Supporting activities (SA) 0.128
Human capital (HCS) 0.419
Knowledge and skills (HCS1) 0.246 0.013
Capabilities (HCS2) 0.243 0.013
Training and education (HCS3) 0.354 0.019
Commitment and loyalty (HCS4) 0.157 0.008
Organisation capital (OCS) 0.192
Culture (OCS1) 0.175 0.004
Leadership (OCS2) 0.296 0.007
Alignment (OCS3) 0.198 0.005
Teamwork (OCS4) 0.330 0.008
Information capital (ICS) 0.389
IT systems (ICS1) 0.364 0.018 Database (ICS2) 0.301 0.015 Networks (ICS3) 0.335 0.017 Financial strength (FS) 0.151 Profitability (PFF) 0.654 Revenue growth (PFF1) 0.318 0.031
EBIT(operating profit) margin (PFF2) 0.328 0.032
Net profit margin (PFF3) 0.354 0.035
Liquidity & Solvency (LSF) 0.346
Current ratio (LSF1) 0.342 0.018
Debt to total asset (LSF2) 0.349 0.018
Debt to equity (LSF3) 0.309 0.016
Users’ satisfaction (US) 0.225
Service fulfilment (SFU) 0.723
Overall service reliability (SFU1) 0.361 0.059
Responsiveness to special requests (SFU2) 0.147 0.024
Accuracy of documents & information (SFU3) 0.134 0.022
Incidence of cargo damage (SFU4) 0.188 0.031
Incidence of service delay (SFU5) 0.170 0.028
Service costs (SCU) 0.277
Overall service cost (SCU1) 0.549 0.034
Cargo handling charges (SCU2) 0.315 0.020
Cost of terminal ancillary services (SCU3) 0.137 0.009
Terminal supply chain integration (TSCI) 0.116
Intermodal transport systems (ITST) 0.528
Sea-side connectivity (ITST1) 0.466 0.029
Land-side connectivity (ITST2) 0.159 0.010
Reliability for multimodal operations (ITST3) 0.197 0.012
Efficiency of multimodal operations (ITST4) 0.178 0.011
Value-added services (VAST) 0.197
Facilities to add value to cargoes (VAST1) 0.369 0.008
Service adaptation to customers (VAST2) 0.172 0.004
Capacity to handle different types of cargo (VAST3) 0.262 0.006
Tailored services to customers (VAST4) 0.197 0.005
Information/communication integration (ICIT) 0.275
Integrated EDI for communication (ICIT1) 0.291 0.009
Integrated IT to share data (ICIT2) 0.261 0.008
Collaborate with Channel members for channel optimisation (ICIT3) 0.232 0.007
Latest port IT systems (ICIT4) 0.216 0.007
Sustainable growth (SG) 0.07
Safety and Security (SSS) 0.602
Identifying restricted areas and access control (SSS1) 0.298 0.013
Formal safety and security training practices (SSS2) 0.206 0.009
Adequate monitoring and threat awareness (SSS3) 0.231 0.010
Safety and security officers and facilities (SSS4) 0.265 0.011
Environment (EVS) 0.2
Carbon footprint (EVS1) 0.158 0.002
Water consumption (EVS2) 0.145 0.002
Energy consumption (EVS3) 0.248 0.003
Waste recycling (EVS4) 0.149 0.002
Environment management programmes (EVS5) 0.300 0.004
Social engagement (SES) 0.198
Employment (SES1) 0.578 0.008
Regional GDP (SES2) 0.272 0.004
Disclose of information (SES3) 0.150 0.002
4.2. Identify PPIs interdependency and evaluate their weights using DEMATEL and ANP
The same panel of ten experts took part in the survey to determine the interdependency among six dimensions. The initial direct-relation 6 × 6 𝑚𝑎𝑡𝑟𝑖𝑥 𝑍 is obtained using Eq. (4) by pairwise comparisons in terms of influences and directions as shown in Table 2. Then, the normalised direct-relation matrix 𝐷 is calculated by Eq. (5) and the total-relation matrix 𝑇
and sum of influence given and received by each category are obtained by Eqs. (6)-(7) (Table 3). A threshold value of 0.82 (=29.63 36⁄ ) is calculated using Eq. (8). According to Table 3, CA, SA and TSCI are assessed as cause factors while FS, US and SG are effect factors. Specifically speaking, CA is affected by SA, FS, US and TSCI and has an inner dependency. SA is affected by CA, FS, US and TSCI. FS is affected by CA, SA and US. US is affected by CA, SA and TSCI. TSCI is affected by CA and SA. Lastly, SG is affected by CA and SA. Based on Table 3, the ten experts are asked to determine the interdependency among the 16 principal-PPIs but eight experts3 return in this survey. The same process is carried out to obtain a direct influence matrix. The initial direct-relation 16 × 16 𝑚𝑎𝑡𝑟𝑖𝑥 𝑍 is obtained by pairwise comparisons in terms of influences and directions as shown in Table 4. It is noteworthy that zero value is given in the matrix when there are no influences involved in the investigated pairs because no pairwise comparisons are conducted. The total-relation matrix 𝑇 and sum of influence given and received by each principal-PPI are obtained and presented in Table 5. A threshold value of 0.11 (=28.99 256⁄ ) is calculated. Based on threshold value, a diagraph of the 16 principal-PPIs is presented in Fig. 2. After determining interdependent relationships between the principal-PPIs, the ANP method is used to obtain the final adjusted weights (i.e. global weights). Based on Table 5, the ten experts4 are asked to respond to questions, for
example, “which PPI influences more on ‘output’: ‘productivity’ or ‘lead-time’? and how much more?” In terms of this process, a number of comparison matrices are formed, and then an unweighted supper-matrix is obtained and presented in Table 6. By calculating the limiting power of the weighted super-matrix, a limit super-matrix is generated (Table 7). The results in the limit super-matrix is used as weights of sixteen principal-PPIs. The final step is to obtain local weights of 60 PPIs. It is noteworthy that we take into account 60 PPIs independently for the following two reasons: 1) their interdependency is modelled largely through their upper level PPIs and 2) the judgement complexity is too high to exceed the capability of the experts in this study when considering their interdependent relations. The global weights of the 60 PPIs in the bottom level can be obtained by multiplying their local weights with the normalised weights of 16 principal-PPIs (Table 8). Using an integrated method of DEMATEL and ANP, we identified 60 PPIs’ interdependency and their relative importance with success.
Table 2. The initial influence matrix (6 dimensions)
CA SA FS US TSCI SG CA 0 2.40 2.70 3.80 2.50 2.10 SA 2.30 0 2.30 2.70 2.40 2.20 FS 2.00 2.30 0 1.60 1.70 3.10 US 2.70 2.40 2.20 0 2.20 1.70 TSCI 2.20 2.20 2.10 2.20 0 1.70 SG 2.90 2.40 1.50 1.20 1.40 0
Table 3. The total influence matrix, “Prominence” and “Relation”
3 The 8 experts are 2 from terminal operators, 1from liner, 1 from forwarder, 2 from academia and 2 from port authority and government, respectively.
4 The judgements of four (1 terminal operator, 1 liner, 1 forwarder, 1 port authority) among the 10 experts have verified with the CR of 0.1 or less, which is sufficient to provide a reasonable ANP outcome (Büyüközkan et al., 2012).
CA SA FS US TSCI SG 𝑝𝑟𝑖+ 𝑝𝑟𝑖− CA 0.88 1.01 0.97 1.08 0.92 0.93 11.07 0.53 SA 0.94 0.77 0.87 0.93 0.84 0.86 10.32 0.07 FS 0.85 0.84 0.65 0.80 0.73 0.84 9.50 (0.10) US 0.92 0.89 0.83 0.74 0.80 0.80 10.08 (0.12) TSCI 0.85 0.83 0.78 0.83 0.61 0.75 9.22 0.08 SG 0.83 0.79 0.70 0.73 0.67 0.59 9.09 (0.46)
Table 4. The initial influence matrix of principal-PPIs
OPC PDC LTC HCS OCS ICS PFF LSF SFU SCU ITST VAST ICIT SSS EVS SES
CA OPC 0 2.63 2.50 2.38 2.50 2.63 2.75 2.25 2.75 3.13 2.38 2.00 2.38 2.13 1.75 1.88 PDC 3.38 0 3.25 2.75 2.75 2.63 2.63 2.25 2.75 3.00 2.50 2.00 2.25 1.75 2.00 1.75 LTC 3.00 3.13 0 2.38 2.38 2.75 2.50 2.00 3.38 2.88 2.63 1.88 2.75 2.25 2.00 1.50 SA HCS 2.50 3.00 2.75 0 0 0 2.38 2.38 2.75 2.38 2.00 2.50 2.50 2.50 2.13 1.88 OCS 2.63 2.75 2.50 0 0 0 2.63 2.13 3.00 2.25 2.13 2.25 2.50 2.13 2.00 2.00 ICS 2.88 3.25 3.50 0 0 0 2.38 2.13 2.63 2.38 2.25 2.38 2.75 2.50 1.75 1.50 FS PFF 1.88 1.88 1.88 2.13 2.13 2.13 0 0 0 0 0 0 0 2.38 2.13 3.13 LSF 1.88 1.75 1.75 2.25 2.38 2.25 0 0 0 0 0 0 0 2.13 2.75 2.50 US SFU 3.00 2.88 2.75 2.75 2.88 2.88 2.50 2.50 0 0 0 0 0 0 0 0 SCU 2.88 2.88 2.63 1.63 1.63 1.63 3.13 3.00 0 0 0 0 0 0 0 0 TSCI ITST 2.88 2.38 2.88 2.13 2.13 2.88 0 0 2.63 2.00 0 0 0 0 0 0 VAST 2.38 2.25 2.00 2.00 1.88 2.25 0 0 2.75 2.75 0 0 0 0 0 0 ICIT 2.63 2.75 3.00 2.75 2.38 3.38 0 0 2.88 2.13 0 0 0 0 0 0 SG SSS 2.25 2.50 2.75 0 0 0 0 0 0 0 0 0 0 0 0 0 EVS 1.50 1.75 1.63 0 0 0 0 0 0 0 0 0 0 0 0 0 SES 1.38 1.38 1.38 0 0 0 0 0 0 0 0 0 0 0 0 0
Table 5. The total influence matrix of principal-PPIs
OPC PDC LTC HCS OCS ICS PFF LSF SFU SCU ITST VAST ICIT SSS EVS SES
CA OPC 0.17 0.24 0.23 0.17 0.18 0.19 0.18 0.16 0.19 0.19 0.14 0.12 0.14 0.15 0.13 0.13 PDC 0.26 0.18 0.26 0.19 0.19 0.20 0.19 0.16 0.20 0.20 0.15 0.13 0.15 0.14 0.14 0.13 LTC 0.25 0.26 0.18 0.18 0.18 0.20 0.18 0.16 0.22 0.19 0.15 0.12 0.16 0.15 0.14 0.12 SA HCS 0.21 0.22 0.21 0.10 0.10 0.11 0.15 0.14 0.17 0.16 0.11 0.12 0.13 0.14 0.12 0.12 OCS 0.21 0.21 0.20 0.10 0.10 0.11 0.16 0.13 0.18 0.15 0.12 0.11 0.13 0.13 0.12 0.12 ICS 0.23 0.23 0.24 0.11 0.11 0.12 0.16 0.14 0.18 0.16 0.13 0.12 0.14 0.14 0.12 0.11 FS PFF 0.14 0.14 0.14 0.11 0.11 0.11 0.06 0.05 0.07 0.06 0.05 0.04 0.05 0.11 0.10 0.13 LSF 0.14 0.13 0.13 0.11 0.11 0.11 0.06 0.05 0.07 0.06 0.05 0.04 0.05 0.11 0.12 0.11 US SFU 0.20 0.20 0.19 0.15 0.16 0.16 0.15 0.14 0.10 0.09 0.07 0.06 0.07 0.08 0.07 0.07 SCU 0.18 0.18 0.17 0.11 0.11 0.12 0.15 0.14 0.08 0.07 0.05 0.05 0.06 0.07 0.06 0.06 TSCI ITST 0.19 0.18 0.19 0.13 0.13 0.16 0.09 0.08 0.16 0.13 0.06 0.06 0.07 0.07 0.06 0.06 VAST 0.17 0.16 0.16 0.12 0.12 0.13 0.08 0.07 0.15 0.14 0.05 0.05 0.06 0.06 0.05 0.05 ICIT 0.20 0.20 0.20 0.15 0.15 0.18 0.10 0.09 0.17 0.15 0.07 0.06 0.07 0.07 0.07 0.06 SG SSS 0.11 0.11 0.12 0.04 0.04 0.04 0.04 0.03 0.04 0.04 0.03 0.02 0.03 0.03 0.03 0.03 EVS 0.07 0.08 0.07 0.02 0.02 0.03 0.02 0.02 0.03 0.03 0.02 0.02 0.02 0.02 0.02 0.02 SES 0.06 0.06 0.06 0.02 0.02 0.02 0.02 0.02 0.02 0.02 0.02 0.01 0.02 0.02 0.01 0.01
Fig. 2. Interdependency between the 16 principal-PPIs
Table 6. Unweighted supper-matrix
CA SA FS US TSCI SG
OPC PDC LTC HCS OCS ICS PFF LSF SFU SCU ITST VAST ICIT SSS EVS SES
CA OPC 0.31 0.18 0.17 0.37 0.42 0.24 0.53 0.52 0.15 0.45 0.32 0.53 0.29 0 0 0 PDC 0.46 0.55 0.40 0.39 0.34 0.42 0.29 0.26 0.52 0.32 0.28 0.24 0.29 0 0 0 LTC 0.23 0.27 0.43 0.24 0.23 0.34 0.18 0.22 0.33 0.23 0.40 0.24 0.41 1 0 0 SA HCS 0.39 0.41 0.31 0 0 0 0 0 0.37 0.35 0.31 0.34 0.35 0 0 0 OCS 0.35 0.29 0.26 0 0 0 0 0 0.31 0.37 0.35 0.46 0.31 0 0 0 ICS 0.26 0.29 0.43 0 0 1 0 1 0.31 0.28 0.33 0.20 0.33 0 0 0 FS PFF 0.61 0.61 0.50 0.54 0.50 0.50 0 0 0.59 0.63 0 0 0 0 0 0 LSF 0.39 0.39 0.50 0.46 0.50 0.50 0 0 0.41 0.37 0 0 0 0 0 0 US SFU 0.72 0.75 0.66 0.71 0.61 0.73 0 0 0 0 0.74 0.39 0.59 0 0 0 SCU 0.28 0.25 0.34 0.29 0.39 0.27 0 0 0 0 0.26 0.61 0.41 0 0 0 TSCI ITST 0.50 0.41 0.37 0.33 0.69 0.34 0 0 0 0 0 0 0 0 0 0 VAST 0.37 0.26 0.21 0.39 0 0.20 0 0 0 0 0 0 0 0 0 0 ICIT 0.13 0.33 0.42 0.28 0.31 0.45 0 0 0 0 0 0 0 0 0 0 SG SSS 0.59 0.52 0.62 0.47 0.37 0.74 0 0 0 0 0 0 0 0 0 0 EVS 0.23 0.25 0.23 0.27 0.31 0.26 0 1 0 0 0 0 0 0 0 0 SES 0.18 0.22 0.15 0.26 0.31 0 1 0 0 0 0 0 0 0 0 0
Table 7. Limit super-matrix
CA SA FS US TSCI SG
OPC PDC LTC HCS OCS ICS PFF LSF SFU SCU ITST VAST ICIT SSS EVS SES Weight 0.12 0.14 0.12 0.06 0.05 0.10 0.08 0.06 0.10 0.05 0.03 0.02 0.02 0.02 0.02 0.02 Ranking (2) (1) (3) (8) (9) (5) (6) (7) (4) (10) (11) (15) (12) (13) (16) (14)
5. Discussion: comparing results
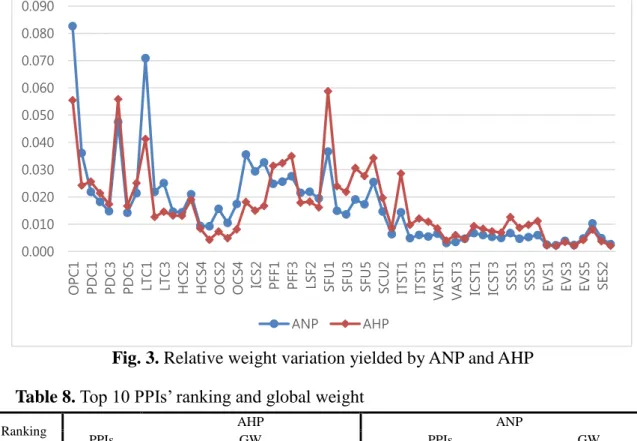
Appendix 1 shows the global weights of the bottom level PPIs yielded by AHP and ANP. The results demonstrate that a very similar trend but a clear difference in terms of the PPIs’ importance score and ranking (Figure 3). Interestingly, the similar results can be found in Yüksel and Dagdeviren (2007) that quantified a SWOT analysis in terms of weights and ranks, but different results from Lee et al. (2013) that applied the two approaches to rank critical
success factors of waterfront redevelopment.
Derived from the results of AHP, overall service reliability is the most important PPI, which has a relative importance value of 0.059, followed by crane productivity (0.056), throughput growth (0.055), vessel turnaround (0.041), net profit margin (0.035), overall service cost (0.034), operating profit margin (0.032), revenue growth (0.031), incidence of cargo damage (0.031) and seaside connectivity (0.029), as shown the top 10 highest scores in Table 8. In the contrast, waste recycling (0.002), total water consumption (0.002) and carbon footprint (0.002) under environment (EVS) are the least important PPIs. The same ranking results can be found in ANP interdependent weights: waste recycling (0.001), total water consumption (0.001) and carbon footprint (0.001). The results derived from ANP suggest that throughput growth is the most important PPI, which has a relative importance value of 0.083, followed by vessel turnaround (0.071), crane productivity (0.048), overall service reliability (0.037), vessel call size growth (0.036), IT systems (0.036), networks (0.033), database (0.029), net profit margin (0.035) and operating profit margin (0.032).
The top 10 rank PPIs in the AHP results include three PPIs under core activities (CA), three PPIs under financial strength (FS), three PPIs under users’ satisfaction (US) and one PPI under terminal supply chain integration (TSCI). On the contrary, the ANP results involve four PPIs under core activities (CA), three PPIs under supporting activities (SA), two PPIs under financial strength (FS) and one PPI under users’ satisfaction (US). In the analysis, the significant importance difference between SA and FS can be observed. A plausible explanation would be that the global weights of the PPIs in AHP are absolutely dependent on their associated upper principal-PPIs and dimensions. Accordingly, the high relative importance of three dimensions (CA, 0.310; FS, 0.151 and US, 0.225) influence more on the global weights of their associated bottom level PPIs than other three dimensions do, despite the fact that no significant weight difference between PPIs in the same cluster. However, the ANP results are mostly dependent on the results of interdependency between the principal-PPIs/dimensions. For instance, SA is an effect dimension that is affected by CA, FS, US and TSCI, at the same time SA is a cause dimension that has an effect on CA, FS, US, TSCI and SG. While FS is affected by CA, SA and US and simultaneously influences on CA, SA and SG. Hence, SA is more influential dimension than FS, representing the higher global weights of the PPIs in SA than the ones in FS in ANP analysis.
The ANP findings denote that on the one hand, the internal activities of port operators such as cargo operations in berth and yard and competency on port equipment, information technology are important criteria for PPM. On the other, the importance of the external effectiveness factor to customer satisfaction cannot be overlooked. The strong internal competency leads to the high customer’ satisfactions, which is in line with Brooks and Schellinck's (2013) argument. On top of that, the internal effectiveness factor such as financial performance is relatively crucial in both approaches.
There is no obvious trend variance of relative importance across the bottom-level PPIs, but the difference on importance values obtained by ANP and AHP (Figure 3) is clearly revealed. The ANP results on output (OPC), lead time (LTC), organisational capital (OCS) and information capital (ICS) are higher than those from AHP, while profitability (PFF), service fulfilment (SFU), service costs (SCU) and intermodal transport systems (ITST) yielded by
AHP are higher than those from ANP. Interestingly, very similar results reflect on the importance values of productivity (PDC) and human capital (HCS).
The major objective of this study is to compare the results obtained from the two methods to demonstrate the effect of interdependency among PPIs on their importance. Based on the comparisons, we note that the combined DEMATEL and ANP technique is an approach capable of providing realistic solutions to simulate the interrelationship among PPIs. The importance of criteria (i.e. GW in Table 8) drawn from the DEMATEL and ANP technique show a greater level of differentiation than those from AHP, which may help decision makers easily identify meaningful criteria for solving given problems (Lee et al., 2013). However, we suggest that the results obtained by the two approaches would provide decision makers with useful information for rationalising their investment plans. When the results are harmony, the strategic decision (e.g. investment) can be made with high confidence. When they are different, further investigation on the influence of interdependency can be taken into account to avoid the possible errors caused by a single approach (i.e. AHP). Thus, the comparative analysis between the outcomes can be used by port managers to prioritise their resource allocations in view of improving port competitiveness and stakeholders’ satisfaction.
To concrete the ANP results, it requires a sophisticated analysis in advance to identify interdependent relationships among the PPIs. As shown in Table 3, CA, SA and TSCI are assessed as cause factors while FS, US and SG are effect factors. This classification is in line with previous studies. The literature on PPM has used technical or physical container terminal specifications such as berth length, terminal area, number of crane in berth and yard, labour, transport modes’ turnaround as input data to measure efficiency and productivity of the container port industry (Tongzon, 1995; Cullinane et al., 2002; Cullinane and Wang, 2006, Talley, 2006). Tangible and intangible resources such as human resources, information/ communication technology and organisational values cannot be overlooked as cause factors to investigate firm’s performance (Bagozzi et al., 1991; Barney, 1991; Alavi et al., 2006; Albadvi
et al., 2007). Furthermore, it is empirically recognised that a higher integration between the players in supply chains leads to a higher competitiveness (Song and Panayides 2008, Panayides and Song 2009, Woo et al. 2013). Financial performance is denoted as the monetary units of tangible and intangible values yielded by a company’s core business operations and any earning from the company’s investment using resources such as land, labour and capital. Customer satisfaction can be measured by the perceived service qualities delivered by service providers. The internal and external effectiveness outcome is the results that are derived by a series of value creation activities. Such evidence further supports our findings that the CA, SA and TSCI belong to cause factors while FS and US are effect factors.
Fig. 3. Relative weight variation yielded by ANP and AHP
Table 8. Top 10 PPIs’ ranking and global weight
6. Conclusions
Modern container port systems denote sophisticated complexity and are cluster of economic activities where a number of port stakeholders provide products and services and create port values together. Given such complex port activities and operations, decision makers require to identify PPIs’ importance as a strategic tool to improve port/terminal competiveness. This study applies AHP and ANP to obtain the relative importance of PPIs, and compares their importance values and rankings, respectively. In the context of AHP technique, the importance was obtained under consideration of independency between the PPIs, while, in the ANP analysis, we took into account the PPIs’ interdependency. Based on our best knowledge, it presents the first attempt to define the importance differences between the two approaches in port performance study. Its research findings contribute to practice and research in the following ways.
First, the results can be employed as guidelines for practitioners and regulators (i.e. terminal operators, port authority and government) to rationalise their investment strategies. It helps to
0.000 0.010 0.020 0.030 0.040 0.050 0.060 0.070 0.080 0.090 OPC 1 PDC 1 PD C 3 PD C 5 LTC 1 LTC 3 H C S2 H C S4 OC S2 OC S4 IC S2 PF F1 PF F3 LS F2 SF U 1 SF U 3 SF U 5 SC U 2 ITS T1 ITS T3 V A ST1 V A ST3 IC ST1 IC ST3 SSS1 SSS3 EVS1 EVS3 EVS5 SES2 ANP AHP
Ranking AHP ANP
PPIs GW PPIs GW 1 SFU1 0.059 OPC1 0.083 2 PDC4 0.056 LTC1 0.071 3 OPC1 0.055 PDC4 0.048 4 LTC1 0.041 SFU1 0.037 5 PFF3 0.035 OPC2 0.036 6 SCU1 0.034 ICS1 0.036 7 PFF2 0.032 ICS3 0.033 8 PFF1 0.031 ICS2 0.029 9 SFU4 0.031 PFF3 0.028 10 ITST1 0.029 PFF2 0.026
clarify investment priorities for port competitiveness improvement by adjusting their strategies based on the derived importance of criteria. Due to a series of world economic recessions, container ports are facing emerging challenges in the decision making of their investment portfolios. Under the situation that resources have remained flat or even decreased, decision makers have to manage risk within their investment portfolios while considering that the economic environments present to the shipping and port industries. Secondly, a hybrid methodology using DEMATEL and ANP provides a coherent framework to define interdependent weights between the PPIs. Previous studies on port performance, port selection and port competiveness generally take into account the PPIs as independent attributes, but assuming them as independent and irrelevant to each other is not realistic in many cases to solve MCDM problems in today’s complex port activities and operations. Hence, the hybrid approach represents a new conceptual model capable of addressing interdependencies between the PPIs to assist the challenges in PPM. More importantly, the use of DEMATEL to screen PPIs of significant interdependency can reduce the high demand on research data collection in traditional ANP.
Nonetheless, this study has some limitations. First, the relative weights of criteria were obtained using a crisp AHP and ANP instead of fuzzy or interval values to deal with the uncertainty in data. Should linguistic variables for weighting process be considered in the future work, it is important to consider the use of fuzzy numbers or fuzzy AHP and ANP to reflect the uncertainty and imprecision judgements. Secondly, although we tried to generalise the relative importance and ranking of PPIs, this study results were drawn by the experts of knowledge and experience associated with the leading container ports in Asia. Further studies involving a wider selection of experts from different regions/areas (e.g. Europe and America) would strengthen the validity of the findings.
Acknowledgements
The authors would like to thank the EU FP7 Marie Curie IRSES project ‘‘ENRICH” for its financial support.
References
Alavi, M., Kayworth, T. R. and Leidner, D. E. (2006). An empirical examination of the influence of organizational culture on knowledge management practices. Journal of management information systems, 22(3), 191-224.
Albadvi, A., Keramati, A., and Razmi, J. (2007). Assessing the impact of information technology on firm performance considering the role of intervening variables: organizational infrastructures and business processes reengineering. International Journal of Production Research, 45(12), 2697-2734.
Bagozzi, R. P., Yi, Y., and Phillips, L. W. (1991). Assessing construct validity in organizational research. Administrative science quarterly, 421-458.
Barney, J. (1991). Firm resources and sustained competitive advantage. Journal of management, 17(1), 99-120.
Bichou, K. (2006). Chapter 24 Review of Port Performance Approaches and a Supply Chain Framework to Port Performance Benchmarking. Research in Transportation Economics,
17(0), 567-598.
Bottani, E. and Rizzi, A. (2006). A fuzzy TOPSIS methodology to support outsourcing of logistics services. Supply Chain Management: An International Journal, 11(4), 294-308.
Brooks, M. R. (2006). Issues in measuring port devolution program performance: a managerial perspective. Research in Transportation Economics, 17, 599-629.
Brooks, M. R. and Schellinck, T. (2013). Measuring port effectiveness in user service delivery: What really determines users' evaluations of port service delivery?. Research in Transportation Business & Management, 8, 87-96.
Büyüközkan, G., Arsenyan, J., and Ruan, D. (2012). Logistics tool selection with two-phase fuzzy multi criteria decision making: A case study for personal digital assistant selection. Expert Systems with Applications, 39(1), 142-153.
Buyukozkan, C. and Cifci, G. (2012). A novel hybrid MCDM approach based on fuzzy DEMATEL, fuzzy ANP and fuzzy TOPSIS to evaluate green suppliers. Expert Systems with Applications, 39, 3000–3011.
Celik, M., Er, I. D., and Ozok, A. F. (2009). Application of fuzzy extended AHP methodology on shipping registry selection: The case of Turkish maritime industry. Expert Systems with Applications, 36(1), 190-198.
Chen, C.-T., (2000). Extensions of the TOPSIS for group decision-making under fuzzy environment. Fuzzy Sets and Systems, 114 (1), 1-9.
Chen, J-K and Chen, I-S (2010). Using a novel conjunctive MCDM approach based on DEMATEL, fuzzy ANP, and TOPSIS as an innovation support system for Taiwanese higher education. Expert Systems with Applications, 37, 1981–1990.
Chou, T. Y., and Liang, G. S. (2001). Application of a fuzzy multi-criteria decision-making model for shipping company performance evaluation. Maritime Policy & Management,
28(4), 375-392.
Cullinane, K., Song, D.-W. and Gray, R. (2002). A stochastic frontier model of the efficiency of major container terminals in Asia: assessing the influence of administrative and ownership structures. Transportation Research Part A: Policy and Practice, 36(8), 743-762.
Cullinane, K. and Wang, T.-F. (2006). Data envelopment analysis (DEA) and improving container port efficiency. Research in Transportation Economics, 17, 517-566.
De Oliveira, G. F. and Cariou P., (2015). The impact of competition on container por t (in)efficiency. Transportation Research Part A: Policy and Practice, 78, 124-133.
ESPO. (2010). Port performance indicators selection and measurement work package 1(WP1): pre-selection of an initial set of indicators. Brussels, Belgium.
Gabus, A. and Fontela, E. (1973). Perceptions of the World Problematique: Communication Procedure, Communicating With Those Bearing Collective Responsibility, DEMATEL Report No. 1, Battelle Geneva Research Centre, Geneva, Switzerland.
Ha, M. H., Yang, Z., Notteboom, T., Ng, A. K., & Heo, M. W. (2017). Revisiting port performance measurement: A hybrid multi-stakeholder framework for the modelling of port performance indicators. Transportation Research Part E: Logistics and Transportation Review, 103, 1-16.
Huang, J. J., Tzeng, G. H., and Ong, C. S. (2005). Multidimensional data in multidimensional scaling using the analytic network process. Pattern Recognition Letters, 26(6), 755-767. Hwang, C.L. and Yoon, K. (1981). Multi Attribute Decision Making Methods and Applications,
Springer-Verlag, New York.
Kaplan, R. S. and Norton, D. P. (2004). Measuring the strategic readiness of intangible assets.
Harvard business review, 82(2), 52-63.
Lee, P. T.W and Lin, C.W (2013). The cognition map of financial ratios of shipping companies using DEMATEL and MMDE. Maritime Policy & Management, 40(2), 133-145.
Lee, P. T. W., Wu, J. Z., Hu, K. C., and Flynn, M. (2013). Applying analytic network process (ANP) to rank critical success factors of waterfront redevelopment. International Journal of Shipping and Transport Logistics, 5(4-5), 390-411.
Liou, J.J.H., Tzeng, G.H. and Chang, H.C. (2007). Airline safety measurement using a novel hybrid model. Journal of Air Transport Management, 13 (4), 243-249.
Lirn, T. C., Thanopoulou, H. A., Beynon, M. J., and Beresford, A. K. C. (2004). An application of AHP on transhipment port selection: a global perspective. Maritime Economics & Logistics, 6(1), 70-91.
Marlow, P. B. and Paixão Casaca, A. C. (2003). Measuring lean ports performance.
International Journal of Transport Management, 1(4), 189-202.
Najmia, A and Makuia, A (2010). Providing hierarchical approach for measuring supply chain performance using AHP and DEMATEL methodologies. International Journal of Industrial Engineering Computations, 1, 199–212.
Okoli, C., and Pawlowski, S. D. (2004). The Delphi method as a research tool: an example, design considerations and applications. Information & management, 42(1), 15-29. Panayides, P. M. and Song, D.-W. (2009). Port integration in global supply chains: measures
and implications for maritime logistics. International Journal of Logistics: Research and Applications, 12(2), 133-145.
Rios, C. A. M. and de Souse, R. F. (2014). Cluster analysis of the competitiveness o f container ports in Brazil. Transportation Research Part A: Policy and Practi ce, 69, 423-431.
Saaty, T. L. (1996). Decision making with dependence and feedback, the analytic network process. Pittsburgh: RWS Publication.
Saaty, T. L. (1980). The analytical hierarchy process: Planning prioritysetting, resource allocation. New York: McGraw-Hill.
Saaty, T. L. (2001). Analytic network process. In Encyclopedia of Operations Research and Management Science (pp. 28-35). Springer US.
Saaty, T. L., and Takizawa, M. (1986). Dependence and independence: From linear hierarchies to nonlinear networks. European Journal of Operational Research, 26(2), 229-237. Saunders, M., Lewis, P. and Thornhill, A. (2012). Research Methods for Business Students,
Essex, Financial Times/Prentice Hall.
Shieh, J. I., Wu, H. H., and Huang, K. K. (2010). A DEMATEL method in identifying key success factors of hospital service quality. Knowledge-Based Systems, 23(3), 277-282. Song, D. W. and Panayides, P. M. (2008). Global supply chain and port/terminal: integration
and competitiveness. Maritime Policy & Management, 35(1), 73-87.
Song, D. W., and Yeo, K. T. (2004). A competitive analysis of Chinese container ports using the analytic hierarchy process. Maritime Economics & Logistics, 6(1), 34-52.
Talley, W. K. (2006). Port performance: an economics perspective. Research in Transportation Economics, 17, 499-516.
Tongzon, J. L. (1995). Deteriminants of Port Performance and Efficiency. Transportati on Research Part A: Policy and Practice, 29(3), 245-252.
Tongzon, J. L. (1995). Systematizing international benchmarking for ports. Maritime Policy and Management, 22(2), 171-177.
Tsai, M. C., and Su, C. H. (2005). Political risk assessment of five East Asian ports—the viewpoints of global carriers. Marine Policy, 29(4), 291-298.
Woo, S.-H., Pettit, S. and Beresford, A. K. (2011). Port evolution and performance in changing logistics environments. Maritime Economics & Logistics, 13(3), 250-277.
Woo, S.-H., Pettit, S. J. and Beresford, A. K. (2013). An assessment of the integration of seaports into supply chains using a structural equation model. Supply Chain Management: An International Journal, 18(3), 235-252.
Wu, H. H., Chen, H. K., and Shieh, J. I. (2010). Evaluating performance criteria of Employment Service Outreach Program personnel by DEMATEL method. Expert Systems with Applications, 37(7), 5219-5223.
Yang, J.-B. (2001). Rule and utility based evidential reasoning approach for multiattribute decision analysis under uncertainties. European Journal of Operational Research,
131(1), 31-61.
Yeo, G. T., Ng, A. K., Lee, P. T. W., and Yang, Z. (2014). Modelling port choice in an uncertain environment. Maritime Policy & Management, 41(3), 251-267.
Yüksel, İ., and Dagdeviren, M. (2007). Using the analytic network process (ANP) in a SWOT analysis–A case study for a textile firm. Information Sciences, 177(16), 3364-3382.
Appendix 1. Global weights of the PPIs and their ranking
PPIs AHP ANP
GW Ranking GW Ranking 1 OPC1 0.055 3 0.083 1 2 OPC2 0.024 14 0.036 5 3 PDC1 0.026 12 0.022 16 4 PDC2 0.021 17 0.018 22 5 PDC3 0.017 23 0.015 27 6 PDC4 0.056 2 0.048 3 7 PDC5 0.017 25 0.014 32 8 PDC6 0.025 13 0.021 18 9 LTC1 0.041 4 0.071 2 10 LTC2 0.013 31 0.022 15 11 LTC3 0.015 28 0.025 12 12 HCS1 0.013 29 0.015 29 13 HCS2 0.013 30 0.014 30 14 HCS3 0.019 19 0.021 19 15 HCS4 0.008 42 0.009 36 16 OCS1 0.004 52 0.009 37 17 OCS2 0.007 47 0.016 25 18 OCS3 0.005 50 0.01 34 19 OCS4 0.008 44 0.017 23 20 ICS1 0.018 21 0.036 6 21 ICS2 0.015 27 0.029 8 22 ICS3 0.017 24 0.033 7 23 PFF1 0.031 8 0.025 13 24 PFF2 0.032 7 0.026 10 25 PFF3 0.035 5 0.028 9 26 LSF1 0.018 22 0.021 17 27 LSF2 0.018 20 0.022 14 28 LSF3 0.016 26 0.019 20 29 SFU1 0.059 1 0.037 4 30 SFU2 0.024 15 0.015 26 31 SFU3 0.022 16 0.014 33 32 SFU4 0.031 9 0.019 21 33 SFU5 0.028 11 0.017 24 34 SCU1 0.034 6 0.025 11 35 SCU2 0.020 18 0.015 28 36 SCU3 0.009 40 0.006 41 37 ITST1 0.029 10 0.014 31 38 ITST2 0.010 36 0.005 49 39 ITST3 0.012 33 0.006 42 40 ITST4 0.011 35 0.005 45 41 VAST1 0.008 41 0.007 40 42 VAST2 0.004 54 0.003 56 43 VAST3 0.006 49 0.003 55
44 VAST4 0.005 51 0.005 53 45 ICIT1 0.009 38 0.007 39 46 ICIT2 0.008 43 0.006 44 47 ICIT3 0.007 46 0.005 46 48 ICIT4 0.007 48 0.005 48 49 SSS1 0.013 32 0.007 38 50 SSS2 0.009 39 0.005 52 51 SSS3 0.010 37 0.005 47 52 SSS4 0.011 34 0.006 43 53 EVS1 0.002 57 0.002 58 54 EVS2 0.002 60 0.002 60 55 EVS3 0.003 56 0.004 54 56 EVS4 0.002 58 0.002 59 57 EVS5 0.004 53 0.005 51 58 SES1 0.008 45 0.01 35 59 SES2 0.004 55 0.005 50 60 SES3 0.002 59 0.003 57