HAL Id: hal-02357361
https://hal.archives-ouvertes.fr/hal-02357361
Submitted on 13 Nov 2019
HAL
is a multi-disciplinary open access
archive for the deposit and dissemination of
sci-entific research documents, whether they are
pub-lished or not. The documents may come from
teaching and research institutions in France or
abroad, or from public or private research centers.
L’archive ouverte pluridisciplinaire
HAL, est
destinée au dépôt et à la diffusion de documents
scientifiques de niveau recherche, publiés ou non,
émanant des établissements d’enseignement et de
recherche français ou étrangers, des laboratoires
publics ou privés.
Spatial variation and risk assessment of trace metals in
water and sediment of the Mekong Delta
Emilie Strady, Quoc Dinh, Julien Némery, Thanh Nho Nguyen, Stéphane
Guédron, Nhu Sang Nguyen, Hervé Denis, Phuoc Dan Nguyen
To cite this version:
Emilie Strady, Quoc Dinh, Julien Némery, Thanh Nho Nguyen, Stéphane Guédron, et al.. Spatial
vari-ation and risk assessment of trace metals in water and sediment of the Mekong Delta. Chemosphere,
Elsevier, 2017, 179, pp.367-378. �10.1016/j.chemosphere.2017.03.105�. �hal-02357361�
Spatial variation and risk assessment of trace metals in water and
sediment of the Mekong Delta
Emilie Strady
a, b, *, Quoc Tuc Dinh
b, c, Julien Ne
´
mery
a, b, Thanh Nho Nguyen
d,
Ste
´
phane Gue
´
dron
e, Nhu Sang Nguyen
c, Herve
´
Denis
a, Phuoc Dan Nguyen
ca Univ. Grenoble Alpes, CNRS, IRD, Grenoble INP, IGE, F-38000 Grenoble, France b CARE-HCMUT, Ho Chi Minh City, Viet Nam
c Faculty of Environment, HCMUT, Ho Chi Minh City, Viet Nam
d Faculty of Chemistry, University of Sciences, Ho Chi Minh City, Viet Nam e Univ. Grenoble Alpes, CNRS, IRD, ISTerre, F-38000 Grenoble, France
h i g h l i g h t s
●Trace metal transportation are controlled by SPM concentrations.
●Dissolved trace metal distribution vary in the salinity gradient.
●Ecotoxicological indexes in surface sediments show low to medium contamination.
a r t i c l e i n f o
Article history:
Received 2 9 November 2 0 1 6 Received in revised form 2 3 March 2017 Accepted 2 6 March 2017 Available online 2 7 March 2017
Keywords: Mekong Delta Trace metals Ecotoxicological index Tropical river Estuary
a b s t r a c t
The Mekong Delta, is home to 17 million inhabitants and faces numerous challenges relating to climate change, environmental degradation and water issues. In this study, we assess trace metals concentrations (Al, V, Cr, Mn, Fe, Co, Ni, Cu, Zn, As, Mo, Cd, Hg, Pb) in the water, suspended particulate matter and surface sediments of the Tien River, the Northern branch of the Mekong Delta, during both dry and rainy seasons. Metal concentrations in the dissolved and suspended particle phases remain in the low concentration range of the main Asian Tropical River. During transportation in the riverine part, we evidenced that V, Cr, Co, As and Pb are dominant in the particulate phase while Mo, Ni and Cu dominate in the dissolved fraction. In the salinity gradient, dissolved U, V, Mo exhibit conservative behaviour while Ni, Cu, As, Co and Cd showed additive behaviour suggesting desorption processes. In the surface sediment, metal concentrations are controlled by the particle-size, POC contents and Fe, Al and Mne oxy(hydr)oxides. Calculated Enrichment Factor and Geoaccumulation Index evidenced As enrichment while the calculated mean effect range median quotients evidenced a low to medium ecotoxicological potential effects range in the surface sediments.
1. Introduction
Deltas and estuaries play a major role in material and element transport from river to ocean and on biogeochemical cycles. The various physical and chemical gradients that occur in this mixing environment affect the partitioning, mobility and reactivity of el-ements such as nutrients and trace metals (e.g.Du Laing et al.,
2008; de Souza Machado et al., 2016; Garnier et al., 2010). Because of their persistence, toxicity and ability to accumulate in organisms, trace metals are major pollutants and are considered a high priority (i.e. European Water Framework Directive (Anonymous, 2000), US-EPA (40 CFR Part 423, Appendix A). Trace metals in aquatic environments originate mostly from natural erosion and soil leaching. They are also released by human activity such as industrial, domestic, urban and agricultural practices. Suspended particles are a key factor in contaminant transport from the continent to the ocean, making their quality assessment a major scientific concern (e.g.Apitz and Power, 2002). Understanding the processes controlling elemental transport and reactivity between * Corresponding author.Univ. Grenoble Alpes, CNRS, IRD, Grenoble INP, IGE,
F-3 8 0 0 0 Grenoble, France.
the dissolved and particulate (both suspended and deposited sed-iments) phases in rivers and more particularly in estuaries is thus crucial to assess their impact in terms of contamination and eco-toxicological risks.
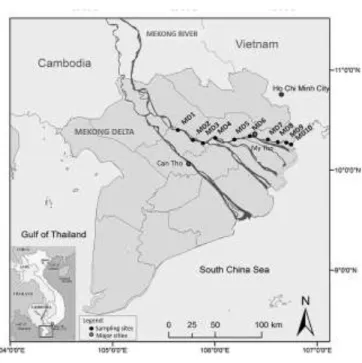
The Mekong River is the longest River in Southeast Asia with a total length of 4800 km and a drainage basin of 795,000 km2. It
originates in the Tibetan Plateau of western China and flows southward through China, Myanmar, Laos, Thailand, and Cambodia, before entering Vietnam through the Delta and then discharging into the South China Sea. The Mekong Delta is one of the world’s largest deltas (39 0 00 km2) and has a population of around 17
million people (GSO, 2016). It is the principal area of rice production in Vietnam and its economy is largely reliant on agriculture (namely rice and fruit) and aquaculture (mainly shrimp and cat-fish). Despite recent intensification of agricultural and aquaculture activity as well as rapid urban growth, the Mekong Delta remains one of the poorest regions in Vietnam (Renaud and Künzer, 2012). The delta’s natural and social systems face numerous challenges related to climate change, environmental degradation and water issues such asflooding, water pollution and access to water (Xue et al., 2011; Renaud and Künzer, 2012). Hydroelectric dams on the Mekong River and its tributaries have severely impacted the aquatic ecosystem’s biodiversity (Campbell, 2012). Sediment sup-ply to the delta and the ocean is also impacted, and estimates suggest that it retains about 32e41 million tons of sediment per year (Kummu et al., 2010). Indeed, before dam construction, the Mekong was one of the 10 largest sediment suppliers to the world’s oceans with an annual sediment flux estimated at around 160 million tons (Milliman and Meade, 1983; Milliman and Ren, 1995). Numerous dams are currently under construction or in the plan-ning stages on the main stream and in the tributaries, increasing the vulnerability of the Mekong River. The Mekong Delta river quality is also threatened by the development of intensive agri-cultural and aquaculture activity and the release of pesticides (Toan et al., 2013), antibiotics (Giang et al., 2015), nutrients and trace metals (Wilbers et al., 2014).
Information on trace metal risk assessment in the Mekong Delta’s waters and surface sediments is not readily available (e.g.
Cenci and Martin, 2004; Noh et al., 2013; Wilbers et al., 2014) and studies that are available have mainly focused on arsenic ground-water contamination issues and consequences to population health (Berg et al., 2007; Buschmann et al., 2008; Hoang et al., 2010). Thus, considering the environmental challenges that are facing the Mekong Delta, the purpose of this study is to evaluate trace element contamination (Al, V, Cr, Mn, Fe, Co, Ni, Cu, Zn, As, Mo, Cd, Hg, Pb, U) of the Tien River, Mekong Delta, Vietnam. Two snapshot campaigns were performed along the Tien River during the contrasted seasons (dry and rainy seasons). The objectives were (i) to get an inventory of dissolved and particulate polymetallic concentrations which affect the quality of the river, (ii) to identify the fate of metal dis-tribution in the water column and sediment and the factors con-trolling their partitioning, and (iii) to provide a risk assessment of surface sediments based on geochemical and ecotoxicological indexes.
2. Material and methods
2.1. The Tien River, Mekong Delta, Vietnam
The Mekong Delta begins in Phnom Penh, Cambodia, where the river divides into its two main branches, the Mekong and the Bassac, which are respectively subdivided into six and three branches, the Tien River being the northern branch of the Delta (Fig. 1, 150 km long, 450e2250 m width, up to 10 m depth). The Mekong Delta is composed of Holocene alluvial sediments of
marine and fluvial origin that were rapidly deposited beginning 80 00 year BP (Nguyen et al., 2 0 00 ; Xue et al., 2011). The climate is monsoonal humid and tropical, with average temperatures of 27e30 ○C. The rainy season (approximately 80% of the annual rainfall) lasts from May to October. Accordingly, the Mekong River discharge reaches a minimum in AprileMay and a maximum in SeptembereOctober in the lower Mekong (Xue et al., 2012) and the same is true for the Bassac River where the river discharge fluctu-ates from 200 m3s—1to 7000 m3s—1respectively (Loisel et al., 2014).
2.2. Sampling and handling
Two snapshot campaigns were conducted along the Tien River during dry and wet seasons, in March and October 2013, respec-tively. At each site (Table 1a), temperature, pH, dissolved oxygen, conductivity and salinity were immediately measured in situ using a multi parameter probe (WTW 3420®). Then, water was sampled at 10e50 cm below surface using a Niskin non-metallic water sampling bottle (General Oceanic®) and stored in 5L PE bottle. All filtered and unfiltered samples were stored in a cooler (~4○C) until being brought back to the laboratory. A first filtration was per-formed on glass microfiber filter (0.7
mm GF/F Whatman
®, pre-weighed and preheated at 500 ○C). Thefiltrate was stored in a 60 ml bottle and kept at —18 ○C for analyses of dissolved nutrient while filters, used for determination of suspended particulate matter (SPM) and particulate organic carbon (POC) concentrations, were dried at 50○C, then weighed and stored at room temperature. A secondfiltration was realized on pre-weighed PTFEfilters (0.20mm Omnipore
®) for analysis of particulate and dissolved trace metals. Afterfiltration, thefiltrate was acidified (Normapur HNO32% v/v) and stored in a 30 ml acid pre-cleaned PP bottle (Normapur HNO310% v/v) at 4○C while thefilters were kept in sterile plastic
petri dishes at—18○C, then freeze-dried, weighed and stored in the plastic petri dishes. To prevent contamination during collection and handling, all equipment was cleaned and we wrapped each sub-sample individually in two polyethylene bags. Surface sediments were collected at each site using a Shipek sediment grab sampler, immediately stored in PE bags at—18○C and, freeze-dried.
2.3. Laboratory analyses 2.3.1. Trace metal analyses
Particulate trace metals on PTFEfilters (MetalSPM) and
repre-sentative sub-samples of surface sediments (MetalSED; 100 mg of
dried, powdered and homogenized material) were analyzed by a microwave total extractable acid digestion (NovaWave SCP Sci-ences®, IGE-OSUG Laboratory, Grenoble, France; HCl, HNO
3, HF;
Trace Metal grade Fisher®). The protocol is based on the digestion method USEPA 3052 and is fully described inStrady et al. (2017). Trace metal concentrations (V, Cr, Co, Ni, Cu, Zn, As, Mo, Cd, Pb, U) were measured by ICP-MS (Elan DRC II Perkin Elmer, TERA Envi-ronment Laboratory Fuveau France) while Al, Mn and Fe concen-trations were measured by ICP-AES (Varian 720 ES, ISTerre-OSUG Laboratory, Grenoble, France) using external calibration for both cases. Total Hg concentrations in sediments THgSEDwere
deter-mined by atomic absorption spectrophotometry after dry miner-alization and gold amalgamation by using an automatic mercury analyzer (Altec, Model AMA 254 ISTerre-OSUG Laboratory, Gre-noble, France) (Gue´dron et al., 2009; Strady et al., 2017). MetalF
concentrations were directly measured by ICP-MS (Elan DRC II Perkin Elmer) using external calibration. When the sample salinity was up to 1, dissolved trace metals were determined by Kinetic Energy Discrimination -Argon Gas Dilution (KED-AGD mode) with the Thermo Scientific iCAPQ ICP-MS (Plateforme AETE-HydroSciences/OSU OREME, Montpellier, France) using an added on-line internal solution (Sc, Ge, In and Bi) to correct signal drifts. The analytical quality assurance of particulate measurements was assured by analyzing certified reference materials. Accuracy was V: 6%; Cr: —6%; Co: 7%; Ni: —2%; Cu: —6%; Zn: 30%; As: 1%; Mo: —3%, Cd: —13%, Pb: —8%, Hg: 9% for GBW-07323 (n ¼ 5) and V: 1%; Cr: —6%; Co: —7%; Ni: —13%; Cu: —9%; Zn: 29%; As: —5%; Mo: —3%, Cd: 2%, Pb: —9%, Hg: 5% for MESS-3 (n ¼ 4). Precision was lower than 8% for all elements and both GBW-07323 and MESS-3.
2.3.2. Particulate organic carbon analyses
Acombustion infrared detection technique using a LECOCS-125 analyzer (EPOC Laboratory, Talence, France) with 5% precision was used to determine POC concentrations. Contents of POC are expressed as a percentage of the dry weight of SPM or sediment, abbreviated as POC%.
2.3.3. Orthophosphates, nitrates and ammonium analyses
Orthophosphates (P-PO4) were analyzed using the ascorbic
acid-molybdate blue method developed by Murphy and Riley (1962) prior to spectrophotometric measurements. Ammonium (N-NH4) was analyzed directly on site using the standard
colori-metric method (APHA, 1995) and Hach Lange photolab. Nitrate (N-NO3) was measured by ion chromatography (A-732 Metrohm®
separation-center based system using anion column Metrosep A-SUPP-5-150®). Precision was 10% for all dissolved nutrient analysis.
2.3.4. Grain size distribution analyses
Grain size distribution was measured on bulk sub-samples using a laser diffraction sizer after a 3 min ultrasonic agitation (Malvern Mastersizer 2000, IGE-OSUG Laboratory, Grenoble, France).
2.4. Geochemical and ecotoxicological indexes 2.4.1. Enrichment factor
Assessment of the metal enrichment degree in sediments was undertaken using the enrichment factor (EF). The index allows differentiating natural geochemical background to anthropogenic inputs (Zhang and Liu, 2002). The enrichment factor is defined as the ratio of Al normalized metal concentrations in sediments over Al normalized ratio in a geochemical background reference. Normalization to Al is used to compensate natural variability due to grain-size variations (e.g. mineral composition) and to detect any anthropogenic metal contributions (Loring, 1991; Chapman and Wang, 2001).Zhang and Liu (2002) defined that an EF value be-tween 0.5 and 1.5 suggests natural weathering processes while a value of EF> 1.5 suggests trace metals being delivered from non-crustal materials corresponding to enrichment from anthropo-genic sources. More precisely,Birth (2003)defined that 1.5<EF<3 is minor enrichment, 3<EF<5 is moderate enrichment, 5<EF<10 is moderately severe enrichment, 10 < EF< 25 is severe enrich-ment, 25< EF< 50 is very severe enrichment, andfinally that EF > 50 is extremely severe enrichment.
2.4.2. Geoaccumulation Index (Igeo)
The degree of metal enrichment was also assessed using the Geoaccumulation Index (Igeo, Müller, 1979) originally defined for metal concentrations in the <2
mm fraction with respect to the
background value Bn as a‘pre-civilisation’value for the study area. The Igeocalculation is based on the following formula:Igeo ¼Log21:5Cn*Bn
where Cnis the measured concentration in the sediment for metal
n, Bnis the background value for the metaln, and factor 1.5 is used
because of possible variations in background data due to litholog-ical variations. The geoaccumulation Index includes seven grades: Igeo≤0 Uncontaminated; 0 < Igeo<1 uncontaminated to moder-ately contaminated; 1 < Igeo<2 moderately contaminated; 2 < Igeo<3 moderately to strongly contaminated; 3 < Igeo<4 strongly contaminated; 4 < Igeo<5 strongly to extremely contam-inated; 5 < Igeo extremely contaminated.
2.4.3. Sediment quality guideline
A sediment quality guideline (SQG) has been developed for singular ecosystems with freshwater or marine sediments. In ma-rine ecosystems, the mean Effect Range Median quotients
(m-ERM-Sampling site Coordinates City Activity
MD-1 N10○24051.000 E105○39011.800 Cao Lanh City, 1 1 0 0 0 0 inhabitants agriculture: rice, fruit; industrial activity
MD-2 N10○17055.700 E105○46006.400 Sa Dec City, 1 6 0 0 0 0 inhabitants agriculture: fruit
MD-3 N10○16038.300 E105○54024.500 My Thuan City, 1 6 0 0 0 0 inhabitants agriculture: fruit; industrial activity
MD-4 N10○19009.200 E106○01012.300 Cai Be City, 2 6 0 0 0 0 inhabitants agriculture: fruit
MD-5 N10○18057.000 E106○12002.000 Rural area agriculture: rice, fruit
MD-6 N10○20053.400 E106○21002.600 My Tho City, 2 3 0 0 0 0 inhabitants agriculture: fruit; industrial activity
MD-7 N10○18035.800 E106○30017.900 Rural area agriculture: rice, fruit; aquaculture:fish
MD-8 N10○17011.600 E106○34056.100 Rural area agriculture: rice, fruit; aquaculture: shrimp
MD-9 N10○17019.300 E106○41039.000 Rural area agriculture: rice, fruit; aquaculture: shrimp
MD-10 N10○15036.800 E106○45019.000 Rural area agriculture: rice, fruit; aquaculture: shrimp
Table 1 a
q) is a pollutant-specific index from the SQG obtained in laboratory experiments using amphipod organisms (Long et al., 1998). It takes into account mixtures of contaminants, including trace metals, present in sediment samples, and provides a management tool for assessing sediment quality in terms of adverse biological effects. The m-ERM-q calculation is based on:
m —ERM —q¼ P n
i¼1ðC i=ERMiÞ
n
where Ciis the concentration of the pollutantiin the sample, ERMi
is the experimentally defined effect concentration for the pollutant
iandnis the number of studied pollutantsi. Four classes of toxicity probability for biota are then defined: low (m-ERM-q <0.1), low-medium (m-ERM-q: 0.11e0.5), mediumehigh (m-ERM-q: 0.51e1.5) and high priority sites (m-ERM-q>1.5) (Long et al., 1998). The m-ERM-q index is derived from the concept of effect range-low (ERL i.e.10th percentile of the effect dataset) and effect range-median (ERM i.e. 50thpercentile of the effect dataset) defined by Long et al. (1995) respectively as the concentrations below which adverse effects are not expected to occur, above which adverse effects are expected to occur.
In freshwater ecosystems,MacDonald et al. (2000)evaluated a consensus-based SQG for 28 chemicals (i.e. metals, polycyclic aro-matic hydrocarbons, polychlorinated biphenyls, and pesticides) and developed the threshold effect concentration (TEC) and probable effect concentration (PEC) indexes for freshwater sediment. The TEC was defined as the concentration below which adverse effects are not expected to occur and the PEC as the concentration above which adverse effects are expected to occur more often than not. Based on the mean Effect Range Median quotient (m-ERM-q;Long et al., 1998), a mean PEC quotient (m-PEC-q) was defined by
MacDonald et al. (2000) as predicting the absence of toxicity if mean PEC quotient is lower than 0.5 and a high probability of sediment toxicity if the mean PEC quotient is higher than 0.5.
2.5. Statistical analysis
The Pearson correlation coefficient matrix and one-way ANOVA at probability level p<0.05 (to test seasonal effect) were performed using statistical package software (SPSS; version 23).
3. Results &discussion
3.1. River water mass characteristics
Physico-chemical parameters vary along the river and between the seasons (Table 1b). The dry season is characterized by higher water temperature (approximately þ2 ○C) and a saline water intrusion up to the MD7 site (the intrusion being downstream during rainy season). The pH and DO values vary with opposite seasonal trends: pH being more acidic during the rainy season whereas water is less oxygenated during the dry season. The Tien River acidification is closely related to the leaching of the sur-rounding acid sulfate soils during rainy seasons (Minh et al., 1997) while the decreasing oxygenation during the dry season could be the result of enhanced organic matter degradation along the river network (Trinh et al., 2012). The local DO decrease observed at MD6 during both seasons is the likely result of direct domestic and urban discharges from My Tho City (230 0 0 0 inhabitants; Table 1a). During the dry season, the P-PO4concentrations are quite low but
increases locally in nearby urban centres (between 2 and MD-4; Table 1a, 2) while the N-NO3concentrations are likely the result
of intense agricultural activity along this river (Table 2). In the estuarine environment, (MD-8 to MD-10) N-NH4concentrations
(Table 2) increased two fold and could be related to intense aqua-culture activity (Table 1a). During the rainy season, different dis-tributions are observed with lower nutrient concentrations highlighting the strong dilution capacity of the Mekong River. Despite significant progress in the development of the wastewater management sector in Vietnam, 60% of urban wastewater is con-nected to sewerage and only 10% of this collected wastewater is treated (World Bank, 2013). Specifically in the Mekong Delta, water quality management is an urgent problem with regards the mul-tiple sources of pollution including domestic, urban, agricultural, industrial and aquaculture sources (Waibel et al., 2012). A dramatic rise in nutrient concentrations has also been observed on a global scale in the last decade, in response to land use changes and urban development, in rivers from South-East Asia countries such as in the lower Mekong basin in Laos (Li and Bush, 2015), the Red River watershed in Northern Vietnam (Garnier et al., 2015), and in the Yangtze River in China (Li et al., 2011).
In the Tien River, SPM concentrations are low during both sea-sons (Table 3) and in a similar range as previously reported byNoh et al. (2013). Higher concentrations were measured during the rainy seasons and are related to enhanced SPM transfer in the Mekong watershed (Loisel et al., 2014). During the dry season, the low SPM concentrations increased sharply in the brackish zone (Table 3) suggesting estuarine flocculation processes (Lefebvre et al., 2012). The POCSPMcontents vary from 1.1% to 9.0% (Table 3)
and are in the same range as previously observed by Noh et al. (2013). During the dry season, the higher POCSPM contents
measured in the riverine part support our hypothesis regarding the importance of local urban wastewater release into the river. Then, in the brackish zone, POCSPMdecreased (i.e. MD6 to MD9;Table 3)
suggesting both enhanced organic degradation processes in the estuarine water column and dilution offluvial particles by organic-depleted resuspended sediment (Etcheber et al., 2007; Statham, 2012). During the rainy season, the low POCSPMcontent (mean of
1.3%) associated with high SPM concentration levels (Table 3) is likely related to the terrigenous origin of the SPM. This minimum POCSPMvalue, defined as the terrigenous signature, can range from
0.5% in a very erodible watershed (e.g. in the Taiwan watershed;
Kao and Liu, 1997) and up to 5% in an equatorial forested watershed (e.g. the Congo RiverCoynel et al. (2005).
3.2. Filtered and suspended particulate metal dynamics in the Tien River
Filtered (VF, CrF, CoF, NiF, CuF, ZnF, AsF, MoF, CdF, PbF, UF) and
particulate (VSPM, CrSPM, CoSPM, NiSPM, CuSPM, ZnSPM, AsSPM, MoSPM,
CdSPM, PbSPM, AlSPM, FeSPM, MnSPM) trace metal concentrations
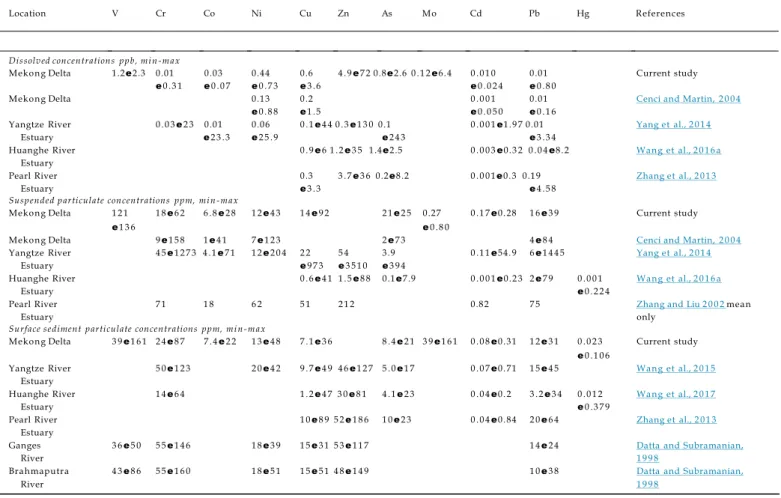
measured in the Tien River (Table 2;Table 3) are within the mean world rivers dissolved (Gaillardet et al., 2014) and particulate (Viers et al., 2009) values and in the same concentration range as previ-ously reported in the Mekong Delta (Cenci and Martin, 2004) and in the Lower Mekong River (Gaillardet et al., 1999). In particular, AsF
concentrations remain far below the concentrations previously reported in the Mekong Delta aquifers (Berg et al., 2007). The comparison to main Asian tropical rivers (Table 4) such as the Yangtze River Estuary (Yang et al., 2014), the Huanghe River Estuary (Wang et al., 2016a) and the Pearl River Estuary (Zhang and Liu, 2002; Zhang et al., 2013) demonstrates that the Mekong Delta is in the low range of both dissolved and particulate concentrations, confirming the previous statement ofCenci and Martin (2004)on the negligible anthropogenic metal inputs to this system. The pH, DO and SPM concentrations have a limited effect on the dynamic of MetalFconcentrations (r¼0.73, p<0.01 level for NiFand SPM only)
and MetalSPM concentrations (r ¼ 0.79 and r ¼ 0.76, p < 0.01 level
partitioning in the river water column wasfirstly assessed by the partitioning coefficient Kddefined as the ratio of MetalSPMover
MetalF(Turner et al., 1993). The LogKd(Table 5) are stable in the
Tien River and do not present any significant variation with pH, DO and SPM (p> 0.05). Consequently, the metal partitioning was
assessed in a different way by taking into account the total con-centration relative to the volume of water, expressed in
mg L
—1(i.e.the particulate concentrations were multiplied to the SPM con-centrations and summed to the dissolved concon-centrations). The total concentrations expressed in
mgL
—1(Fig. 2) vary through the Tien Sites VF CrF CoF NiF CuF ZnF AsF MoF CdF PbF UF P-PO4 NeNH4 NeNO3units mg L—1 mg L—1 mg L—1 mg L—1 mg L—1 mg L—1 mg L—1 mg L—1 mg L—1 mg L—1 mg L—1 mg L—1 mg L—1 mg L—1
March dry season MD-1 1.37 0 .0 9 2 0 .0 6 1 0.46 0.63 11.8 1.63 0.35 0 .0 0 5 0.041 0.38 0.02 0.06 1.5 MD-2 1.32 0 .0 6 6 0 .0 4 2 0.62 n.d. 9.3 1.60 0.36 0 .0 1 0 0.061 0.38 0.03 0.07 1.7 MD-3 1.28 0 .0 4 4 0 .0 4 0 0.46 0.78 14.6 1.50 0.36 0 .0 0 9 0.017 0.36 0.22 0.03 1.8 MD-4 1.16 0 .0 6 2 0 .0 4 7 0.49 1.06 30.2 1.30 0.32 0 .0 2 2 0.246 0.27 0.04 0.06 2.0 MD-5 1.30 0 .0 0 7 0 .0 3 1 0.44 0.64 11.7 1.38 0.32 0 .0 0 4 0.013 0.18 0.02 0.06 2.2 MD-6 2.31 0 .1 0 9 0 .0 6 4 0.48 0.99 72.3 1.38 0.27 0 .0 0 7 0.141 0.11 0.01 0.05 2.8 MD-7 n.d. 0 .9 7 8 0 .0 6 7 0.70 0.99 7.1 n.d. 0.67 0 .0 0 8 0.061 0.16 0.01 0.07 1.5 MD-8 1.43 0 .1 5 7 0 .0 4 6 0.52 1.22 18.3 1.16 1.63 0 .0 1 2 0.080 0.51 0.01 0.14 1.4 MD-9 1.67 0 .1 0 9 0 .0 4 1 0.61 1.21 12.9 1.36 3.56 0 .0 1 3 0.039 1.19 0.01 0.14 n.d. MD-10 1.95 0 .1 3 8 0 .0 3 8 0.73 1.41 32.2 1.47 6.37 0 .0 2 4 0.035 2.04 0.01 0.16 n.d. October rainy season MD-4 1.41 0 .0 5 9 0 .4 7 6 3.26 2.90 29.9 0.93 0.12 <0 .0 1 0.804 0.05 0.01 0.07 0.2
MD-5 1.38 0 .0 3 5 0 .5 2 4 2.22 0.96 37.4 0.88 0.52 <0 .0 1 0.116 0.04 0.01 0.03 0.2 MD-6 1.34 0 .3 1 3 1 .2 9 8 3.10 1.09 9.9 0.84 0.13 <0 .0 1 0.017 0.04 0.02 0.03 0.2 MD-7 1.28 0 .0 7 1 0 .4 4 2 2.30 0.96 20.5 0.77 0.13 <0 .0 1 0.063 0.05 0.01 0.02 0.2 MD-10 1.47 <0 .0 1 1 .3 3 2 3.73 3.56 4.9 2.57 0.39 <0 .0 1 <0.01 0.09 0.01 0.02 0.2 Table 2
Measuredfiltered metal (VF, CrF, CoF, NiF, CuF, ZnF, AsF, MoF, CdF, PbF, UF) and nutrient (P-PO4, NeNH4) concentrations in surface water at each sampling site during both dry and
rainy seasons. (n.d.: not determined).
March dry season MD-1 n.d. 18.0 6.8 12.1 13.9 n.d. n.d. n.d. n.d. 16.0 1 2 7 6 0 1 5 1 0 5 6 7 5 9.0 7 MD-2 n.d. 31.0 15.1 23.3 24.4 1 6 8 n.d. n.d. n.d. 27.8 2 1 8 2 7 2 7 9 0 9 1 1 3 2 6.2 9 MD-3 n.d. 27.8 13.3 20.2 21.1 n.d. n.d. n.d. n.d. 24.0 2 0 2 8 1 2 5 0 3 5 1 0 0 5 5.4 8 MD-4 n.d. 36.2 15.7 24.7 92.1 n.d. n.d. n.d. n.d. 29.0 2 3 5 3 8 3 0 5 2 8 7 5 3 3.5 1 1 MD-5 n.d. 38.0 17.7 28.0 27.1 3 3 5 n.d. n.d. n.d. 36.6 2 9 9 6 7 3 5 5 3 1 6 7 8 5.5 1 1 MD-6 n.d. 43.3 20.4 32.4 25.9 5 7 5 n.d. n.d. n.d. 27.9 3 4 0 4 4 3 5 9 0 2 5 6 9 1.7 4 3 MD-7 n.d. 41.1 23.1 34.5 27.5 2 2 9 n.d. n.d. n.d. 30.9 2 9 8 1 4 3 6 7 0 4 1 1 4 7 1.4 1 3 3 MD-8 n.d. 39.7 18.5 29.2 33.6 9 2 n.d. n.d. n.d. 23.5 2 5 1 9 9 3 1 0 4 3 6 5 8 1.4 6 3 MD-9 n.d. 61.6 28.2 43.4 31.0 n.d. n.d. n.d. n.d. 39.0 3 9 7 7 8 4 7 5 9 8 1 1 4 8 2.2 2 8 MD-10 n.d. 41.6 18.4 29.8 29.0 n.d. n.d. n.d. n.d. 25.2 2 6 3 0 4 3 1 3 8 9 7 2 1 2.7 3 0 October rainy season MD-4 1 2 5 23.4 14.1 27.3 41.0 1 4 7 21.6 0.45 0.17 32.7 9 9 5 9 9 5 2 5 9 1 2 9 7 1.1 1 5 4
MD-5 1 2 2 38.9 14.3 33.0 40.6 1 4 4 22.1 0.58 0.17 33.4 9 4 2 2 2 5 3 5 7 8 4 9 0 1.2 1 7 1 MD-6 1 3 6 34.8 16.4 34.4 47.1 2 8 7 24.3 0.61 0.28 37.0 1 0 6 4 8 8 5 8 9 8 9 5 5 2 1.3 1 4 8 MD-7 1 2 1 n.d. 13.4 16.1 36.9 1 3 9 21.4 0.27 0.23 32.9 1 0 4 5 5 6 5 4 9 3 8 8 5 1.4 1 2 8 MD-10 1 3 4 21.7 14.3 26.2 43.0 1 5 1 25.2 0.80 <LD 36.6 1 1 4 6 1 8 5 8 3 6 1 1 4 1 1.3 8 0 Table 3
Measured particulate metal (VSPM, CrSPM, CoSPM, NiSPM, CuSPM, ZnSPM, AsSPM, MoSPM, CdSPM, PbSPM, AlSPM, FeSPM, MnSPM) and particulate organic carbon (POC) concentrations in
surface suspended sediment at each sampling site during both dry and rainy seasons. (n.d.: not determined).
Sites VSPM CrSPM CoSPM NiSPM CuSPM ZnSPM AsSPM MoSPM CdSPM PbSPM AlSPM FeSPM MnSPM POCSPMSPM
units Mg kg—1 mg kg—1 mg kg—1 mg kg—1 mg kg—1 mg kg—1 mg kg—1 mg kg—1 mg kg—1 mg kg—1 mg kg—1 mg kg—1 mg kg—1 % mg L—1
D10 D50 D90 mode March dry season MD-1 4.82 7.82 31.8 0 .2 1 6 0.1 2.4 12.6 48.5 uni-modal
MD-2 4.9 7.61 0 .2 0 7 0.1 5.6 49.3 1 1 7 .0 uni-modal MD-3 5.02 7.05 30.1 0.21 0.1 4.0 47.2 1 7 1 .5 bi-modal MD-4 5.06 7.44 30.2 0 .2 1 9 0.1 2.9 39.8 1 6 1 .4 bi-modal MD-5 4.67 7.59 0 .2 1 2 0.1 4.0 42.3 3 1 0 .8 bi-modal MD-6 3.77 7.58 30.3 0 .4 0 4 0.1 2.5 15.3 56.7 uni-modal MD-7 4.48 7.68 30.5 3.4 1.7 2.5 13.8 56.5 uni-modal MD-8 4.31 7.8 30.6 8.33 4.7 2.6 15.9 1 4 3 .8 bi-modal MD-9 6 7.91 n.d. 18.9 11.3 1.7 6.4 24.4 uni-modal MD-10 6 8.25 30.2 30.7 1 9 2.2 16.3 97.9 bi-modal October rainy season MD-4 4.88 7.22 27.8 8 0 0 2.3 11.9 46.2 uni-modal MD-5 5.31 7.1 27.7 75.5 0 1.7 7.6 31.9 uni-modal MD-6 4.63 6.95 27.9 82.5 0 2.7 16.4 57.8 uni-modal MD-7 5.41 7.1 27.8 84.7 0 1.5 6.5 21.2 uni-modal MD-10 6.6 7.4 27.9 3 4 7 0 1.8 2.1 10.7 58.0 uni-modal Table 1 b
Measured dissolved oxygen (DO), pH, temperature, conductivity, salinity and SPM concentrations in surface water, grain size distribution and modes of surface sediments at each sampling site during both dry and rainy seasons. (n.d.: not determined).
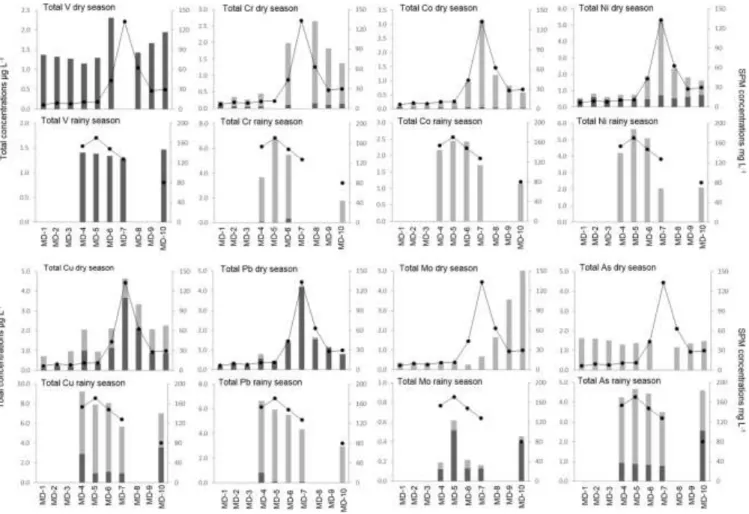
River and are higher during the wet season than during the dry season (ANOVA, p < 0.01 for Cr, Cu and Pb) suggesting enhanced metal load transport during the rainy season towards the ocean. Furthermore, particulate concentrations expressed in
mg L
—1varyfrom site to site and are closely related to SPM concentration var-iations (Fig. 2; p < 0.01 for total V, Cr, Co, Ni, Cu and Pb during both seasons). This pattern supports that SPM concentrations control the load of total metal concentrations in the Mekong Delta during both dry and wet seasons, as observed in the Yangtze River Estuary (Yang et al., 2014). Given the perspective of increased hydropower dam constructions on the main channel and its tributaries, the resulting decrease of sediment load will probably affect the trace metal load in the Mekong Delta. During transportation, the particulate phase is the dominant phase for V, Cr, Co, As and Pb (Fig. 2) while the dis-solved metal fraction dominates for Mo, Ni and Cu in the riverine part, and only for Mo in the estuarine part (Fig. 2). Dissolved metal concentrations vary along the estuarine salinity gradient (Table 2) resulting in high particulate-dissolved reactivity associated with physical, chemical and biological processes in the mixing zone (de Souza Machado et al., 2016). This reactivity can be approached by the mixing diagram (e.g.Liss, 1976; de Souza Machado et al., 2016), which reflects the concentration of an element over salinity be-tween two endmembers: the river and the ocean (i.e. data from the South China Sea (Censi and Martin, 2004; Wang et al., 2012b; Wen et al., 2006) and from mean ocean values (Nozaki, 2001)). When the concentrations follow the theoretical dilution line between the two endmembers, the element is thus controlled by the physical mixing and its behaviour is defined as conservative. Such conservative behaviour is observed for UF, VF,and MoFin the Tien River (Fig. 3;
p< 0.01 for UFand MoFwith salinity). In most estuaries that have
been studied, UFbehaves conservatively (Windom et al., 2 0 00;
reference within;Strady et al., 2009) while such behaviour is less usual for MoFand VF(e.g. in the Chao Phraya Estuary;Dalai et al., 2005). Both MoFand VFcan be affected by intra-estuarine
trans-formation processes like SPM or sediment sorption/desorption re-actions and biological uptake as observed in the Gironde Estuary (Strady et al., 2009) and in the Taiwan Strait (Wang et al., 2016a). Thus, this non-conservative behaviour deriving from the theoret-ical dilution line (i.e. gain or loss of dissolved element), illustrates a higher reactivity between the dissolved and particulate phase (e.g. SPM or sediment). In the Tien River, gains of NiF, CuF, AsF, CoFand
CdFwere observed (Fig. 3) suggesting intense desorption processes
from particles occurring in the salinity gradient. This bell-shaped pattern is well documented for CdFas a chloride-induced
desorp-tion from the suspended sediments and has been previously observed in the Mekong Delta (Cenci and Martin, 2004) and other estuaries like the Gironde Estuary (Kraepiel et al., 1997; Dabrin et al., 2009), the Pearl River (Wang et al., 2012a), the Saigon River (Strady et al., 2017) and the Huanghe River Estuary (Wang et al., 2016b). For CuF, even if a conservative behaviour is more usual and
has been observed in the Mekong Delta (e.g. Cenci and Martin, 2004), in the Pearl River (Wang et al., 2012a) and in the Huanghe River estuary (Wang et al., 2016b), desorption from the reactive particles is the suggested explanation for the bell-shaped pattern observed in the Gironde Estuary (Kraepiel et al., 1997). In the Tien River, this hypothesis could explain the gain of CuFbut the absence
of significant correlation with SPM concentrations along the system (p>0.05) and between LogKdand salinity (p>0.05) does not allow
us to make any conclusions on Cu particle reactivity. Unlike pre-vious measurements performed in the Mekong Delta (Cenci and Dissolved concentrations ppb, mi n -max
Mekong Delta 1.2e2.3 0.01 0.03 0.44 0.6 4 .9e7 2 0.8e2.6 0 .1 2e6.4 0 .0 1 0 0.01 Current study
e0 .3 1 e0 .0 7 e0 .7 3 e3 .6 e0 .0 2 4 e0 .8 0
Mekong Delta 0.13 0.2 0 .0 0 1 0.01 Cenci and Martin, 2 0 0 4 e0 .8 8 e1 .5 e0 .0 5 0 e0 .1 6
Yangtze River 0 .0 3e2 3 0.01 0.06 0 .1e4 4 0 .3e1 3 0 0.1 0 .0 0 1e1.9 7 0.01 Yang et al., 2 0 1 4
Estuary e2 3 .3 e2 5 .9 e2 4 3 e3 .3 4
Huanghe River 0 .9e6 1 .2e3 5 1.4e2.5 0 .0 0 3e0.3 2 0 .0 4e8.2 Wang et al., 2 0 1 6 a
Estuary
Pearl River 0.3 3 .7e3 6 0.2e8.2 0 .0 0 1e0.3 0.19 Zhang et al., 2 0 1 3
Estuary e3 .3 e4 .5 8
Suspended particulate concentrations ppm, mi n -max
Mekong Delta 1 2 1 1 8e6 2 6 .8e2 8 1 2e4 3 1 4e9 2 2 1e2 5 0.27 0 .1 7e0.28 1 6e3 9 Current study
e1 3 6 e0 .8 0
Mekong Delta 9e1 5 8 1e4 1 7e1 2 3 2e7 3 4e8 4 Cenci and Martin, 2 0 0 4
Yangtze River 4 5e1 2 7 3 4 .1e7 1 1 2e2 0 4 2 2 5 4 3.9 0 .1 1e54.9 6e1 4 4 5 Yang et al., 2 0 1 4
Estuary e9 7 3 e3 5 1 0 e3 9 4
Huanghe River 0 .6e4 1 1 .5e8 8 0.1e7.9 0 .0 0 1e0.2 3 2e7 9 0 .0 0 1 Wang et al., 2 0 1 6 a
Estuary e0 .2 2 4
Pearl River 7 1 1 8 6 2 5 1 2 1 2 0.82 7 5 Zhang and Liu 2 0 0 2mean
Estuary only
Surface sediment particulate concentrations ppm, mi n -max
Mekong Delta 3 9e1 6 1 2 4e8 7 7 .4e2 2 1 3e4 8 7 .1e3 6 8 .4e2 1 3 9e1 6 1 0 .0 8e0.31 1 2e3 1 0 .0 2 3 Current study
e0 .1 0 6
Yangtze River 5 0e1 2 3 2 0e4 2 9 .7e4 9 4 6e1 2 7 5 .0e1 7 0 .0 7e0.71 1 5e4 5 Wang et al., 2 0 1 5
Estuary
Huanghe River 1 4e6 4 1 .2e4 7 3 0e8 1 4 .1e2 3 0 .0 4e0.2 3 .2e3 4 0 .0 1 2 Wang et al., 2 0 1 7
Estuary e0 .3 7 9
Pearl River 1 0e8 9 5 2e1 8 6 1 0e2 3 0 .0 4e0.84 2 0e6 4 Zhang et al., 2 0 1 3
Estuary
Ganges 3 6e5 0 5 5e1 4 6 1 8e3 9 1 5e3 1 5 3e1 1 7 1 4e2 4 Datta and Subramanian,
River 1 9 9 8
Brahmaputra 4 3e8 6 5 5e1 6 0 1 8e5 1 1 5e5 1 4 8e1 4 9 1 0e3 8 Datta and Subramanian,
River 1 9 9 8
Table 4 Dissolved and particulate (in both suspended and deposited sediment) trace metal concentrations of main Asian tropical rivers. (References cited:Cenci and Martin, 2 0 0 4 ; Yang et al., 2 0 1 4 ; Wang et al., 2 0 1 6b; Zhang et al., 2 0 1 3 ; Zhang and Liu, 2 0 0 2 ; Wang et al., 2015, 2 0 1 7; Datta and Subramanian, 1998).
Martin, 2004) and the Huanghe River estuary (Wang et al., 2016b), AsF and NiF concentrations increase in the mid salinity range. In the
case of As, the linear positive correlation (r ¼ 0.79) observed be-tween POCSPM and AsF during the dry season suggests an Asrelease
during organic degradation processes occurring in the estuary (Table 2; 3). For NiF, the significant negative correlation with SPM
concentrations (r ¼ 0.74, p < 0.01) suggests desorption from sus-pended particles along the salinity gradient. This is in accordance
Fig. 2. Spatial variation of calculated total metal concentrations (sum of dissolved and particulate concentrations; V, Cr, Co, Ni, Cu, As, Mo, Pb) expressed in mg L—1 and SPM
concentrations expressed in mg L—1during both dry and rainy seasons.
Fig. 3. Filtered metal concentrations along the salinity gradient a) V, Mo, U; b) Ni, Cu, As; c) Cd, Co; d) Cr, Pb and Zn (expressed as Zn/100) during both seasons. The marine endmember is characterized according to data from Wang et al., 2012b; Wen et al., 2 0 0 6; Censi and Martin, 2004, Nozaki, 2001.
with reported laboratory experiments and modelling of metal desorption kinetics which highlight Ni desorption from polluted riverine and estuarine sediments (Millward and Liu, 2003). How-ever, the impact of desorption on observed non-conservative behaviour was minimized by the authors because of the low Ni kinetic desorption and the non-attempt of sorption equilibrium in a dynamic estuarine environment. Finally, concerning CrF, ZnFand
PbF,the high variability of measured concentrations in the riverine
part make it difficult to get a proper river endmember and therefore to determine the gain or loss of metal towards the ocean. Further investigation is needed to find the origin of this high variability, either from anthropogenic inputs (e.g. small localised industrial activity such as electronics, textiles and construction) or from acid sulfate soil leaching.
3.3. Factors controlling metal distributions in the Tien River surface sediments
The surface sediments of the Tien River present a grain size distribution dominated by silt classes (54e87%) and a median grain-size (D50) comprised between 6 and 49
mm (
Table 1b). The grain size distributions varied from site to site and with seasons, without exhibiting a specific spatial pattern from the river to the coastline. The POCSEDcontent ranges from 0.2 to 1.5% (Table 6).MetalSEDconcentrations measured in the Tien River (Table 6) are in
the same range as previously observed in this system (Cenci and Martin, 2004; Noh et al., 2013) and are in the low concentration range of the main Asian Rivers (Table 4) such as the Yangtze River Estuary (Wang et al., 2015), the Huanghe River Estuary (Wang et al., 2017), the Pearl River Estuary (Zhang et al., 2013), the Ganges-Brahmaputra Rivers (Datta and Subramanian, 1998) and including the Saigon River (Strady et al., 2017). Cenci and Martin (2004)
observed that MetalSEDin the Mekong Delta varies spatially but
not seasonally. In this study, we observed the same pattern except for CuSEDand ZnSED(ANOVA, p>0.05).
In surface sediments, the Pearson correlation matrix applied to both seasons highlights positive correlations between the entire MetalSEDset (including AlSED, MnSEDand FeSED), and also between
MetalSED and POCSED (Table 7). These results support that (i)
particle-size, (ii) POC content and/or (iii) Fe, Al and Mneoxy(hydr) oxides are the major carrier phases controlling the spatial distri-bution of particulate trace metals in this system. Firstly, the small sized particles’highly specific surface plays a major role in metal retention (e.g.Fo€rstner and Wittmann, 1979; Loring, 1991; Jung et al., 2014). Secondly, although POCSED content is low (0.2%e
1.5%; Table 6), its strong correlation with HgSED, AsSED (r ¼ 0.83 and
0.84, for Hg and As respectively p < 0.01 Table 7) and CoSED,CuSED
(r¼0.76 and 0.76 p <0.01Table 7) suggest that organic matter is a major carrier for these elements, as it has been observed for Cu in the Saigon River sediments (Strady et al., 2017) and for Hg in the Lower Mekong Basin sediments (Noh et al., 2013; Gue´dron et al., 2014). In the particular case of As, the positive correlation observed between AsSEDand POCSEDis unusual since As has been
documented to be primarily controlled by sorption onto metal oxide surfaces in natural environments (e.g.Redman et al., 2002) although it has been reported that As was sequestered as organo-arsenic complexes in organic rich sediments (Baruah et al., 2003). However, the co-precipitation of microbially synthetized arseno-pyrites on organic matter surfaces or on the formation of organo-arsenic complexes (Paikaray et al., 2005) can both explain the un-usual observed correlation.
Finally, MetalSEDare positively correlated to FeSEDand MnSED,
with a significant correlation (p < 0.01) between FeSEDand the
following MetalSED in the specific sequence:
PbSED > NiSED > AsSED > CoSED > CuSED > AlSED > HgSED
> MnSED > CrSED > ZnSED > VSED and between MnSED and the
following MetalSED in the specific sequence: FeSED > PbSED >CoSED
>HgSED>CuSED>AlSED>AsSED>ZnSED>NiSED.>CrSED>VSED. The
sorption selectivity on most metal-oxide minerals determined by
Schultz et al. (1987) follows the sequence Cr ≤ Pb ≤ Cu > Co ≤ Zn > Ni ≤ Cd, with some distinct differences such as the preference of MnO2for Co (Smith, 1999). The sequence
based on MetalSEDand FeSED/MnSEDcorrelation in the Tien River
surface sediments differs and exhibits a specific pattern, which could be related to the presence and characteristics of the sur-rounding acid sulfate soils (Minh et al., 1997). The oxidation of these soils causes metals to be redistributed from the “pyritic” and
“organic”fractions to the“acid-soluble”fraction (Claff et al., 2011).
Then, the subsequent acidification, due to exceedance of the acid neutralizing capacity of the soil, drives the release of metals to the
“labile”fraction (Claff et al., 2011). Thus, the oxidation and
acidifi-cation of sulfidic soil could lead to changes in metal mobility and consequently to metal sorption phases and distribution in the sediments. In the Tien River, the comparison of MetalSEDwith
MetalSPM for both seasons gives similar concentration ranges
(Tables 3 and6), except for Cr and Pb which present higher con-centrations in sediments and SPM respectively. Such differences for Cr and Pb are likely related to a change in speciation and carrier phases in the sediment resulting in diagenetic processes (e.g. a drop in pH and Eh). Because Cr is sensitive to redox states and oxygen-ation levels, the difference between measured CrSED and CrSPM
could originate from differences between redox and oxygen values in the two compartments, even though they were not measured at the water-sediment interface. Unlike in the sediment no significant
Sites LogKDCr LogKDCo LogKDNi LogKDCu LogKDAs LogKDMo LogKDPb
March dry season MD-1 5.3 5.0 4.4 4.3 n.d. n.d. 5.6
MD-2 5.7 5.6 4.6 n.d. n.d. n.d. 5.7 MD-3 5.8 5.5 4.6 4.4 n.d. n.d. 6.1 MD-4 5.8 5.5 4.7 4.9 n.d. n.d. 5.1 MD-5 n.d. 5.8 4.8 4.6 n.d. n.d. 6.4 MD-6 5.6 5.5 4.8 4.4 n.d. n.d. 5.3 MD-7 n.d. 5.5 4.7 4.4 n.d. n.d. 5.7 MD-8 5.4 5.6 4.7 4.4 n.d. n.d. 5.5 MD-9 5.8 5.8 4.9 4.4 n.d. n.d. 6.0 MD-10 5.5 5.7 4.6 4.3 n.d. n.d. 5.9
October rainy season MD-4 5.6 n.d. n.d. 4.2 4.4 3.6 4.6
MD-5 6.1 n.d. n.d. 4.6 4.4 3.0 5.5
MD-6 5.0 n.d. n.d. 4.6 4.5 3.7 6.3
MD-7 n.d. n.d. n.d. 4.6 4.4 3.3 5.7
MD-10 n.d. n.d. n.d. 4.1 4.0 3.3 n.d.
Table 5
correlation was observed between FeSPMand CrSPMalthough Fe
concentrations are in the same range in both compartments. The change of affinity with Fe should be emphasized during field studies and/or experiments to point out the role of redox processes on Cr partitioning. The observed lower PbSEDconcentrations when
compared to PbSPMcould be the result of intense sediment
lixivi-ation by estuarine and marine waters leading to increasing Pb mobility from the sediment to the dissolved phase as it has been observed in the Yangtze River Estuary (Zhao et al., 2013). This hy-pothesis cannot be supported in the Tien River.
3.4. Risk assessment of Tien River surface sediments
To assess the degree of metal enrichment in the surface sedi-ments of the Tien River we compared two geochemical indexes: the Enrichment Factor (EF) and the Geoaccumulation Index (Igeo) (see material and method 2.3.), calculated for each site and metal. Globally, the calculated EF at all sites (Table 8) evidences none to minor enrichment for V, Cr, Co, Ni, Cu, Mo, Cd, Pb and Hg (EF<1.5), moderate enrichment for Zn (3<EF<5), and moderately severe to severe enrichment for As (5< EF<25). The calculated Igeo at all sites (Table 8) demonstrates uncontaminated sediment to minor contamination for V, Cr, Co, Ni, Cu, Mo, Cd, Pb and Hg (Igeo<1), moderate contaminated sediments for Zn (1< Igeo<2), and
moderate to strong contaminated sediment for As (2 < Igeo<4). Thus, these two indexes are showing a ZnSED,and to a greater extent
an AsSEDenrichment or contamination issue in this environment.
First of all, we would like to point out that the index conclusions strongly depend on the background values chosen, i.e. the UCC (Wedepohl, 1995) in the present study. In the case of the Mekong River watershed, the geology is diverse and rich making it difficult to get a proper background value. In the absence this background value from a sediment core,Wang et al. (2012b) defined a back-ground value from a geometric means of a high number of samples from the Manwan Reservoir in the Upper Mekong River in China. However, this calculated background value presents high coeffi-cient of variation and low representativity, which can be an issue if applying to the Mekong Delta, considering the distance between this reservoir and the Mekong Delta (up to 2,600 km) and the high number of confluent rivers with specific geological characteristics of the catchment area. Thus, we consider that the UCC is the most suitable background value for this environment. The conclusion of AsSEDenrichment in the Tien River is coherent with the literature
on As contamination in the Mekong Delta, characterized by high levels of As in groundwater and in sediment cores and also by a serious health risk to the local population (e.g.Berg et al., 2007; Buschmann et al., 2008 ; Hoang et al., 2010). Note that because of the poor Zn accuracy measurement and the consequences on Zn
March dry season MD-1 1 1 0 71.4 16.7 37.0 36.2 1 7 1 19.0 0.57 0.31 30.4 0.087 7 9 6 2 6 4 6 8 8 4 1 2 3 7 1.2 MD-2 6 5 48.0 11.0 22.6 20.7 1 1 0 11.3 0.46 0.17 16.8 0.047 4 4 9 4 7 2 8 6 2 7 6 4 2 0.6 MD-3 7 0 47.2 11.1 24.4 20.7 1 0 9 12.2 0.28 0.20 18.1 0.053 5 6 7 3 8 3 1 1 0 3 7 1 4 0.8 MD-4 3 9 24.5 7.4 13.4 7.1 6 4 8.4 0.07 0.08 12.2 0.023 3 2 9 2 6 1 9 8 0 8 2 8 7 0.2 MD-5 6 9 79.1 15.7 33.1 18.6 1 1 4 12.4 4.88 0.19 19.9 0.046 5 4 5 0 1 3 4 0 3 5 9 4 2 0.7 MD-6 8 1 78.0 17.0 37.4 33.5 1 6 9 17.3 0.66 0.22 29.5 0.106 5 7 1 7 7 4 5 8 3 7 1 1 3 2 1.2 MD-7 9 8 76.6 16.6 39.7 28.9 1 5 5 18.8 0.88 0.14 25.7 0.074 7 0 9 0 7 4 7 0 7 3 1 2 3 0 1.2 MD-8 8 8 73.9 14.9 32.9 21.8 1 3 5 13.6 0.47 0.13 22.9 0.056 5 0 7 0 8 3 8 6 6 6 8 2 5 0.7 MD-9 1 1 2 87.5 18.1 43.7 30.6 1 6 9 18.1 1.38 0.11 27.0 0.075 9 3 6 3 3 4 9 9 2 4 1 1 7 2 1.1 MD-10 6 8 48.8 15.3 27.5 17.7 1 1 7 14.9 0.52 0.11 17.7 0.066 5 2 3 4 6 3 6 1 9 6 8 2 7 1.4 October rainy season MD-4 1 6 1 83.8 21.8 37.7 34.2 2 5 6 19.1 0.62 0.24 29.6 0.089 7 9 8 5 7 4 4 6 6 7 1 2 1 6 1.2 MD-5 9 9 62.5 17.9 39.1 36.2 1 8 5 20.5 0.93 0.24 30.6 0.091 7 5 1 4 1 4 6 4 6 6 1 3 2 8 1.5 MD-6 9 9 66.7 16.3 35.2 29.1 1 6 9 18.7 0.66 0.22 27.3 0.071 6 1 9 5 1 4 1 1 9 8 1 0 7 6 0.8 MD-7 1 2 0 86.0 17.5 47.7 35.5 1 8 4 20.8 0.94 0.27 24.3 0.079 n.d. 4 1 9 7 7 8 0 5 1.3 MD-10 1 0 2 79.0 17.7 39.5 27.8 1 7 9 16.2 0.87 0.09 28.1 0.057 7 1 3 9 0 4 5 9 3 2 8 6 6 1.0
VSED CrSED CoSED NiSED CuSED ZnSED AsSED MoSED CdSED PbSED HgSED AlSED FeSED MnSED POCSED
VSED 1 CrSED .7 5 5** 1 CoSED .8 7 4** .8 6 5** 1 NiSED .7 7 0** .9 1 9** .873** 1 CuSED .8 1 1** .7 3 7** .821** .8 6 2** 1 ZnSED .9 5 6** .7 4 9** .922** .7 8 4** .8 7 5** 1 AsSED .8 0 7** .7 0 6** .851** .8 9 0** .9 3 3** .8 5 0** 1 MoSED —.056 .382 .202 .209 —.065 —.063 —.060 1 CdSED .495 .330 .405 .402 .6 8 9** .5 1 7* .5 6 7* .059 1 PbSED HgSED .7 7 6** .6 6 8** .7 5 3 ** .6 1 9* .861 ** .782** .8 2 2 ** .7 3 1** .9 2 5 ** .9 0 3** .8 7 4 ** .7 9 0** .8 7 1 ** .8 6 2** —.010 .525 * .620* 1.8 5 4** 1 AlSED .8 2 7** .7 3 9** .807** .8 6 6** .8 2 1** .7 8 5** .8 3 5** .074 .359 .8 0 8** .660* 1 FeSED .7 5 4** .8 2 6** .888** .9 0 8** .8 8 2** .8 1 0** .8 9 0** .038 .346 .9 3 1** .830** .8 7 8** 1 MnSED .6 8 2** .6 9 2** .837** .7 4 8** .8 3 1** .7 5 6** .8 2 9** .170 .505 .8 8 7** .836** .8 3 0** .8 9 3** 1 POCSED .5 9 6* .5 3 1* .756** .7 2 9** .7 5 9** .6 6 2** .8 3 7** —.054 .406 .6 6 6** .828** .6 9 6** .7 8 6** .7 4 5** 1 Table 7
Pearson matrix correlation of particulate metal (VSED, CrSED, CoSED, NiSED, CuSED, ZnSED, AsSED, MoSED, CdSED, PbSED, AlSED, FeSED, MnSED; in mg kg—1) and POCSED content (%) in
sediment during both seasons.
—.126
*Correlation is significant at the 0.05 level (2-tailed). **Correlation is significant at the 0.01 level (2-tailed). Table 6
Measured particulate metal (VSED, CrSED, CoSED, NiSED, CuSED, ZnSED, AsSED, MoSED, CdSED, PbSED, AlSED, FeSED, MnSED) and particulate organic carbon (POC) concentrations in
surface sediment at each sampling site during both dry and rainy seasons. (n.d.: not determined).
Sites VSED CrSED CoSED NiSED CuSED ZnSED AsSED MoSED CdSED PbSED HgSED AlSED FeSED MnSEDPOCSED
concentration over-estimation, the observed ZnSED enrichment
may be either over-estimated or may originate from the direct release of industrial and urban wastewater without prior treatment and from urban release such as street and construction dust, house roof made of zinc, or worn out tires.
According to the metal enrichment index results in the Tien River we assessed the ecotoxicological status of its sediments by comparing the measured concentrations with the commonly used
SQG values for freshwater sediment (i.e MD-1 to MD-7) using TEC, PEC and m-ERM-q indexes and for marine sediments (i.e. MD-7 to MD-10) using ERL, ERM and m-ERM-q indexes (Table 9). Both freshwater and marine sediments exhibit CdSED, PbSED, HgSED
con-centration ranges below which adverse effects are not expected to occur (lower than TEC and ERL) while CrSED, NiSED, CuSED, ZnSED,
AsSEDexhibit a concentration range above which adverse effects are
expected to occur (Table 9). The possible adverse effects of toxic mixtures (Cr, Ni, Cu, Zn, As, Cd, Pb, Hg) evaluated by the calculation of the m-PEC-q and m-ERM-q for freshwater and marine sediments respectively (Table 9), predict an absence of toxicity in the surface freshwater sediments and possible low to medium ecotoxicological potential effects in the estuarine-marine sediments of the Tien River. Because of possible Zn concentration over-estimation, m-PEC-q and m-ERM-q were calculated excluding ZnSED. The two
calculations present similar index values (data not shown) sug-gesting the low contribution of Zn to possible adverse toxic effects. These results support the idea that Mekong River sediments pre-sent a low risk to benthic organisms according to metal contami-nation. However, assumptions regarding ecotoxicological effects should be investigated in further studies combining metal accu-mulation in sediments and benthic organisms.
4. Conclusions
Despite the development of intense agricultural and aquacul-ture activity, and of rapid urban growth illustrated by localised high nutrient and organic carbon levels, the Tien River remains in a state of good quality regarding trace metal contamination. Trace metal
EFMo EFcd EFPb EFHg
March dry season
October rainy season
MD-1 MD-2 MD-3 MD-4 MD-5 MD-6 MD-7 MD-8 MD-9 MD-10 MD-4 MD-5 MD-6 MD-7 MD-10 Ig e o 2.0 2.1 1.8 1.7 1.8 2.1 2.0 2.5 1.7 1.9 3.0 1.9 2.3 n.d. 2.1 IgeoV 2.0 2.4 1.8 1.6 3.2 3.0 2.4 3.2 2.1 2.1 2.3 1.8 2.4 n.d. 2.4 IgeoCr 1.4 1.6 1.3 1.5 1.9 2.0 1.6 2.0 1.3 1.9 1.8 1.6 1.8 n.d. 1.7 IgeoCo 1.9 2.1 1.8 1.7 2.5 2.7 2.3 2.7 1.9 2.2 2.0 2.2 2.4 n.d. 2.3 IgeoNi 2.5 2.5 2.0 1.2 1.9 3.2 2.2 2.3 1.8 1.8 2.3 2.6 2.5 n.d. 2.1 Igeocu 3.2 3.6 2.9 2.9 3.1 4.4 3.2 4.0 2.7 3.3 4.8 3.7 4.1 n.d. 3.7 IgeoZn 9.2 9.8 8.3 9.9 8.8 11.7 10.3 10.4 7.5 11.0 9.2 10.6 11.7 n.d. 8.8 IgeoAs 0.4 0.6 0.3 0.1 n.d. 0.6 0.7 0.5 0.8 0.5 0.4 0.7 0.6 n.d. 0.7 IgeoMo 3.0 2.8 2.7 1.9 2.7 2.9 1.5 2.0 0.9 1.5 2.3 2.5 2.7 n.d. 1.0 Igeocd 1.7 1.7 1.5 1.7 1.7 2.3 1.6 2.1 1.3 1.5 1.7 1.9 2.0 n.d. 1.8 IgeoPb 1.5 1.5 1.3 0.9 1.2 2.6 1.4 1.5 1.1 1.7 1.5 1.7 1.6 n.d. 1.1 IgeoHg
March dry season 0.5 0.4 —0.1 0.4 0.8 —1.9 0.3 0.0
—0.3 —0.1 —0.7 —0.3 —0.1 —2.2 —0.6 —0.8 —0.2 —0.2 —0.6 —0.2 —0.1 1.1 0.5 0.5 —2.9 1.0 0.1 0.4 —0.5 —0.7 —1.0 —1.1 —1.2 —1.1 —1.6 —0.3 —5.0 —0.9 —1.1 —1.9 —0.2 —0.1 —0.2 n.d. —0.4 —0.9 0.0 —1.7 0.3 0.5 0.3 —0.1 —1.3 —0.1 0.2 0.0 —0.2 —0.2 —2.2 —0.2 —0.2 —0.6 0.0 0.3 0.1 0.5 0.6 0.6 0.5 0.5 0.7 0.1 0.6 0.4 0.0 0.5 —0.6 —0.4 0.1 —0.2 —0.2 —0.1 —0.2 —0.3 —2.0 —0.5 —0.5 —0.4
October rainy season 0.3 —1.8
0.0 —1.2 0.1 0.1 —0.1 —1.7 0.2 0.3 0.1 —0.2 —1.2 —0.1 —0.1 MD-1 MD-2 MD-3 MD-4 MD-5 MD-6 MD-7 MD-8 MD-9 MD-10 MD-4 MD-5 MD-6 MD-7 MD-10 1.0 0.3 0.3 0.6 0.4 0.7 0.3 0.3 0.7 0.6 0.00.0 0.2 0.4 0.5 0.2 0.6 0.0 0.4 0.5 0.3 0.8 0.5 0.7 0.8 0.4 0.7 0.4 0.5 1.1 1.0 0.8 1.1 0.6 1.7 1.2 1.1 1.2 1.2 2.7 1.9 2.0 1.5 2.1 2.5 2.6 2.2 2.6 2.3 2.7 2.8 2.6 2.8 2.4 —1.3 0.7 0.7 0.5 0.8 —0.7 0.1 —0.5 Cr Ni Cu Zn As Cd Pb Hg TEC 4 3 22.7 3 2 1 2 1 9.8 1.0 35.8 0.18 PEC 1 1 1 48.6 1 4 9 4 5 9 3 3 5.0 1 2 8 1.06 N TEC < Tien River <PEC 1 1 9 5 9 1 0 0 0 0 ERL 8 1 20.9 3 4 1 5 0 8.2 1.2 46.7 0.15 ERM 3 7 0 51.6 2 7 0 4 1 0 7 0 9.6 2 1 8 0.71 N ERL < Tien River <ERM 2 5 1 4 6 0 0 0
m-ERM-q estuarine and mar ine sediments
March 2 0 1 3 dry 0.25 0.20 0.26 0.18 distributions vary spatially and the metal partitioning appears to be season highly dynamic in the salinity gradient of the Mekong Delta.
October 2 0 1 3 rainy season
0.29 0.25 Although the ecotoxicological indexes demonstrated a low to
me-dium contamination of the surface sediments, direct accumulation
Table 9
Calculated sediment quality guidelines index for freshwater (TEC, PEC, m-PEC-q) and marine water (ERL, ERM, m-ERM-q) ecosystems for surface sediment at each sampling site during both dry and rainy seasons. N is the number of samples comprised between TEC and PEC values and between ERL and ERM values for each metal.
MD- MD- MD- MD- MD- MD- MD- MD- MD- MD- 1 2 3 4 5 6 7 8 9 1 0 m-PEC-q freshwater sediments
0.37 0.23 0.24 0.13 0.30 0.37 0.36 March 2 0 1 3 dry season October 2 0 1 3 rainy season 0.41 0.38 0.35 0.42 Table 8
Calculated EF and Igeo for surface sediment at each sampling site during both dry and rainy seasons. (n.d.: not determined). Enrichment Factor EFV EFCr EFCo EFNi EFcu EFZn EFAs
measurement in benthic organisms are required to assess the metal risk in biota.
Acknowledgments
This study has been conducted under the framework of CARE-RESCIF initiative. The authors would like to thank the students for their help during sampling and the anonymous reviewers for their comments. This study was funded by incentive grants from the French National Research Institute for Sustainable Development IRD, by grants from the Vietnam National University (grant number B2016-20-05), and by grants from Re´gion Rho^ne Alpes COOPERA “Take Care”.
References
Anonymous, 2 3 October, 2 00 0 . Directive of the European Parliament and of the Council (2000/60/EC) Establishing a Framework of Community Action in the Field of Water Policy.
APHA, 1995. Standard Methods for the Examination of Water and Wastewater. American Public Health Association, Washington, DC.
Apitz, S.E., Power, E.A., 2 00 2. From risk assessment to sediment management: an international perspective. J. Soil Sed. 2, 61e66.
Baruah, M.K., Kotoky, P., Baruah, J., Borah, G.C., Bora, P.K., 2 00 3 . Arsenic association and distribution in carbonaceous materials in northeastern India. Curr. Sci. India 85, 2e2 5.
Berg, M., Stengel, C., Trang, P.T.K., Pham, H.V., Sampson, M.L., Leng, M., Samreth, S., Fredericks, D., 2007. Magnitude of arsenic pollution in the Mekong and Red River Deltas- Cambodia and Vietnam. Sci. Total. Environ. 372, 4 1 3e425.
Birth, G.A., 2 0 0 3 . A scheme for assessing human impacts on coastal aquatic envi-ronments using sediments. In: Woodcoffe, C.D., Furness, R.A. (Eds.), Coastal GIS 2 0 0 3 . Wollongong University Papers in Centre for Maritime Policy, 14, Australia.
Buschmann, J., Berg, M., Stengel, C., Winkel, L., Sampson, M.L., Pham, T.K.T., Pham, H.V., 2 0 0 8 . Contamination of drinking water resources in the Mekong delta floodplains: arsenic and other trace metals pose serious health risk to population. Environ. Intern 34, 7 5 6e764.
Campbell, I.C., 2012. Biodiversity in the Mekong delta. In: Renaud, F.G., Künzer, C. (Eds.), The Mekong Delta System: Interdisciplinary Analyses of a River Delta. Springer Environ Sci Engineer, pp. 2 9 3e3 14 (Chapter 11).
Cenci, R.M., Martin, J.M., 2 0 0 4 . Concentration and fate of trace metals in Mekong River Delta. Sci. Total. Environ. 332, 167e182.
Chapman, P.M., Wang, F., 2001. Assessing sediment contamination in estuaries. Environ. Toxicol. Chem. 20, 3e2 2.
Claff, S.R., Burton, E.D., Sullivan, L.A., Bush, R.T., 2011. Metal partitioning dynamics during the oxidation and acidification of sulfidic soil. Chem. Geol. 286, 146e157.
Coynel, A., Seyler, P., Etcheber, H., Meybeck, M., Orange, D., 2 0 0 5 . Spatial and sea-sonal dynamics of total suspended sediment and organic carbon species in the Congo River. Glob. Biogeochem. Cycles 19, GB4019.
Dabrin, A., Scha€fer, J., Blanc, G., Strady, E., Masson, M., Bossy, C., Castelle, S., Girardot, N., Coynel, A., 200 9. Improving estuarine netflux estimates for dis-solved cadmium export at the annual timescale: application to the Gironde Estuary. Estuar. Coast. Shelf. S. 84, 4 2 9e4 3 9.
Dalai, T.K., Nishimura, K., Nozaki, Y., 2 005 . Geochemistry of molybdenum in the Chao Phraya River Estuary, Thailand: role of suboxic diagenesis and porewater transport. Chem. Geol. 218, 1 8 9e20 2.
Datta, D.K., Subramanian, V., 1998. Distribution and fractionation of heavy metals in the surface sediments of the Ganges-Brahmaputra-Meghna river system in the Bengal basin. Environ. Geol. 36, 93e101.
de Souza Machado, A.A., Spencer, K., Kloas, W., Toffolon, M., Zarfl, C., 2016. Metal fate and effects in estuaries: a review and conceptual model for better under-standing of toxicity. Sci. Total. Environ. 541, 2 6 8e28 1.
Du Laing, G., De Vos, R., Vandescasteele, B., Lesage, E., Tack, F.M.G., Verloo, M.G., 20 08 . Effect of salinity on heavy metal mobility and availability in intertidal sediments of the Scheldt estuary. Estuar. Coast. Shelf S 77, 5 8 9e6 0 2.
Etcheber, H., Taillez, A., Abril, G., Garnier, J., Servais, P., Moatar, F., Commarieu, M.V., 2007. Particulate organic carbon in the estuarine turbidity maxima of the Gironde, Loire and Seine estuaries: origin and lability. Hydrobiology 588, 2 4 5e2 5 9.
Fo€rstner, U., Wittmann, G.T.W., 1979. Metal Pollution in the Aquatic Environment. 4 8 6 S., 1 0 2 Abb., 9 4 Tab. Berlin-Heidelberg-New York 1979. Springer-Verlag.
Gaillardet, J., Dupre´, B., Alle`gre, C.J., 1999. Geochemistry of large river suspended sediments: silicate weathering or crustal recycling? Geochim. Cosmochim. Acta 63, 4037e4051.
Gaillardet, J., Viers, J., Dupre´,B., 2014. Trace Elements in river waters. In:
Holland, H.D., Turekian, K.K. (Eds.), Treatise on Geochemistry, second ed., vol. 7. Oxford Elsevier, pp. 1 9 5e2 35.
Garnier, J., Billen, G., Ne´mery, J., Sebilo, M., 2010. Transformations of nutrients (N, P, Si) in the turbidity maximum zone of the Seine estuary and export to the sea. Est. Coast. Shelf S 90, 129e141.
Garnier, J., Lassaletta, L., Billen, G., Romero, E., Grizzetti, B., Ne´mery, J., Le, T.P.Q.,
Pistocchi, C., Aissa-Grouz, N., Luu, T.N.M., Vilmin, L., Dorioz, J.-M., 2015. Phos-phorus budget in the water-agro-food system at nested scales in two contrasted regions of the world (ASEAN-8 and EU-27). Glob. Biogeochem. Cycles 29, 1 3 4 8e13 68.
General Statistics Office of Vietnam GSO, 2016. Population and Employment, Sta-tistical Yearbook of Vietnam 2015. StaSta-tistical Publishing House, Hanoi, pp. 57e155.
Giang, C.N.D., Sebesvari, Z., Renaud, F.G., Rosendahl, I., Minh, Q.H., Amelung, W., 2015. Occurrence and dissipation of the antibiotics sulfamethoxazole, sulfa-diazine, trimethoprim, and enrofloxacin in the Mekong Delta, Vietnam. PLoS One 10, 7.
Gue´dron, S., Grangeon, S., Lanson, B., Grimaldi, M., 2 009 . Mercury speciation in a tropical soil association; consequence of gold mining on Hg distribution in French Guiana. Geoderma 153, 3 3 1e346.
Gue´dron,S., Tisserand, D., Garambois, S., Spadini, L., Molton, F., Bounvilay, B., 2014. Baseline investigation of (methyl)mercury in waters, soils, sediments and key foodstuffs in the lower Mekong Basin: the rapidly developing city of Vientiane (Lao PDR). J. Geochem Explor 143, 9 6e102.
Hoang, T.H., Bang, S., Kim, K.W., Nguyen, M.H., Dang, D.M., 2010. Arsenic in groundwater and sediment in the Mekong River delta, Vietnam. Environ. Poll. 158, 2 6 4 8e2 65 8.
Jung, H.S., Lim, D., Xu, Z., Kang, J.H., 2014. Quantitative compensation of grain-size effects in elemental concentration: a Korean coastal sediments case study. Estuar. Coast. Shelf S 151, 69e77.
Kao, S.J., Liu, K.K., 1997. Loads of dissolved and nonfossil particulate organic carbon from an Oceania small river (Lanyang Hsi) in Taiwan. Biogeochem 39, 2 5 5e2 69.
Kraepiel, A.M.L., Chiffoleau, J.F., Martin, J.M., Morel, F.M.M., 1997. Geochemistry of trace metals in the Gironde Estuary. Geochim. Cosmochim. Acta 61, 1421e1436.
Kummu, M., Lu, X.X., Wang, J.J., Varis, O., 2010. Basin-wide sediment trapping ef-ficiency of emerging reservoirs along the Mekong. Geomorph 119, 181e197.
Lefebvre, J.P., Ouillon, S., Vinh, V.D., Arfi, R., Panche´, J.Y., Mari, X., Thuoc, C.V.,
Torre´ton, J.P., 2012. Seasonal variability of cohesive sediment aggregation in the Bach Dang-Cam Estuary, Haiphong (Vietnam). Geo-Mar. Lett. 32, 103e121.
Li, X., Yang, L., Yan, W., 2011. Model analysis of dissolved inorganic phosphorus exports from the Yangtze river to the estuary. Nutr. Cycl. Agroecosyst 90, 157e170.
Li, S., Bush, R., 2015. Risingflux of nutrients (C, N, P and Si) in the lower Mekong River. J. Hydrol. 530, 447e461.
Liss, P.S., 1976. Conservative and non-conservative behavior of dissolved constitu-ents during estuarine mixing. In: Burton, J.D., Liss, P.S. (Eds.), Estuarine Chem-istry. Academic Press, London, pp. 9 3e1 30.
Loisel, H., Mangin, A., Vantrepotte, V., Dessailly, D., Dinh, D.N., Garnesson, P., Ouillon, S., Lefebvre, J.-P., Me´riaux, X., Phan, T.M., 2014. Variability of suspended
particulate matter concentration in coastal waters under the Mekong’s infl u-ence from ocean color (MERIS) remote sensing over the last decade. Rem. Sens. Environ. 150, 2 1 8e230.
Long, E.R., Field, L.J., MacDonald, D.D., 1998. Predicting toxicity in marine sediments with numerical sediment quality guidelines. Environ. Toxicol. Chem. 17, 714e727.
Long, E.R., MacDonald, D.D., Smith, S.L., Calder, F.D., 1995. Incidence of adverse biological effects within ranges of chemical concentrations in marine and estuarine sediments. Environ. Manag. 19, 81e97.
Loring, D.H., 1991. Normalization of heavy-metal data from estuarine and coastal sediments. ICES J. Mar. Sci. 48, 101e115.
MacDonald, D.D., Ingersoll, C.G., Berger, T.A., 2 0 0 0 . Development and evaluation of consensus-based sediment quality guidelines for freshwater ecosystems. Arch. Environ. Contam. Toxicol. 39, 20e31.
Milliman, J.D., Meade, R.H., 1983. World-wide delivery of river sediment to the oceans. J. Geol. 91, 1e21.
Milliman, J.D., Ren, M.E., 1995. River Flux to the Sea, Impact of Human Intervention on River Systems and Adjacent Coastal Areas. Impact on Coastal Habitation. CRC Press, pp. 5 7e8 3.
Millward, G.E., Liu, Y.P., 2 0 0 3 . Modelling metal desorption kinetics in estuaries. Sci. Total. Environ. 314, 6 1 3e623.
Minh, L.Q., Tuong, T.P., van Mensvoort, M.E.F., Bouma, J., 1997. Contamination of surface water as affected by land use in acid sulfate soils in the Mekong River Delta, Vietnam. Agricul. Ecosyst. Environ. 61, 19e27.
Müller, G., 1979. Schwermetalle in den Sedimenten des Rheinse Vera€nderungen seit 1971. Umschau 79, 7 7 8e7 8 3.
Murphy, J., Riley, J.P., 1962. A modified single solution method for the determination of phosphate in natural waters. Anal. Chim. Acta 27, 31e36.
Nguyen, V.L., Ta, T.K.O., Tateishi, M., 2 0 0 0 . Late Holocene depositional environments and coastal evolution of the Mekong River Delta, Southern Vietnam. J. Asian Earth Sci. 18, 2 7e3 9.
Noh, S., Choi, M., Kim, E., Nguyen, P.D., Bui, X.T., Nguyen, T.V.H., Sthiannopkao, S., Han, S., 2013. Influence of salinity intrusion on the speciation and partitioning of mercury in the Mekong River Delta. Geochim. Cosmochim. Acta 106, 3 7 9e390.
Nozaki, Y., 2001. Elemental distribution: overview. In: Steele, J.H., Thorpe, S.A., Turekian, K.K. (Eds.), Encyclopedia of Ocean Sciences, vol. 2. Academic Press, London, pp. 8 4 0e8 4 5.
Paikaray, S., Banerjee, S., Mukherji, S., 2 0 0 5 . Sorption of arsenic onto Vindhyan shales: role of pyrite and organic carbon. Curr. Sci. India 10, 1 5 8 0e1585.
Redman, A.D., Macalady, D.L., Ahmann, D., 2 0 0 2. Natural organic matter affects arsenic speciation and sorption onto hematite. Environ. Sci. Technol. 36,
2 8 8 9e2 89 6.
Renaud, F.G., Künzer, C., 2012. Introduction. In: Renaud, F.G., Künzer, C. (Eds.), The Mekong Delta System: Interdisciplinary Analyses of a River Delta, pp. 3e6 . Springer Environ Sci Engineer.
Schultz, M.F., Benjamin, M.M., Ferguson, J.F., 1987. Adsorption and desorption of metals on ferrihydrite: reversibility of the reaction and sorption properties of the regenerated solid. Environ. Sci. Technol. 21, 8 6 3e8 69.
Smith, K.S. 1999. Metal sorption on mineral surfaces: an overview with examples relating to mineral deposits. In reviews in Economic geology Vol 6A, the environmental geochemistry of mineral deposits, Eds Society of Economic Geologists Inc. (ISSN 0741e0123).
Statham, P.J., 2012. Nutrients in estuaries- an overview and the potential impacts of climate change. Sci. Total. Environ. 434, 213e227.
Strady, E., Blanc, G., Scha€fer, J., Coynel, A., Dabrin, A., 2009 . Dissolved uranium, vanadium and molybdenum behaviours during contrasting freshwater dis-charges in the Gironde Estuary (SW France). Estuar. Coast. Shelf S 83, 5 5 0e56 0.
Strady, E., Dang, V.B.H., Ne´mery, J., Gue´dron, S., Dinh, Q.T., Denis, H., Nguyen, P.D., 2017. Baseline seasonal investigation of nutrients and trace metals in surface waters and sediments along the Saigon River basin impacted by the megacity of Ho Chi Minh (Vietnam). Environ. Sci. Poll. Res. 24, 3 2 2 6e3 24 3.
Toan, P.V., Sebesvari, Z., Bl€asing, M., Rosendahl, I., Renaud, F.G., 2013. Pesticide management and their residues in sediments and surface and drinking water in the Mekong Delta. Vietnam. Sci. Total Environ. 452, 2 8e3 9.
Trinh, A.D., Meysman, F., Rochelle-Newall, E., Bonnet, M.P., 2012. Quantification of sediment-water interactions in a polluted tropical river through biogeochem-ical modeling. Glob. Biogeochem. Cycles 26, GB3010.
Turner, A., Millward, G.E., Bale, A.J., Morris, A.W., 1993. Application of the Kd concept to the study of trace metal removal and desorption during estuarine mixing. Estuar. Coast. Shelf S 36, 1e13.
Viers, J., Dupre´, B., Gaillardet, J., 2 009 . Chemical composition of suspended sedi-ments in World Rivers: new insights from a new database. Sci. Total. Environ. 407, 8 5 3e8 6 8.
Waibel, G., Benedikter, S., Reis, N., Genschick, S., Nguyen, L., Huu, P.C., Be, T.T., 20 12. Water governance under renovation? Concepts and practices of IWRM in the Mekong Delta, Vietnam. In: Renaud, F.G., Künzer, C. (Eds.), The Mekong Delta System: Interdisciplinary Analyses of a River Delta, pp. 1 6 7e20 0. Springer En-viron Sci Engineer, (Chapter 6).
Wang, D., Lin, W.F., Yang, X.Q., Zhai, W.D., Dai, M.H., Chen, C.T.A., 2012a. Occurrences of dissolved trace metals (Cu, Cd, and Mn) in the Pearl River Estuary (China), a large river-groundwater-estuary system. Cont. Shelf Res. 50, 5 4e6 3.
Wang, C., Liu, S., Zhao, Q., Deng, L., Dong, S., 2012b. Spatial variation and contam-ination assessment of heavy metals in sediments in the Manwan Reservoir, Lancang River. Ecotox. Environ. Saf. 82, 3 2e3 9.
Wang, H., Wang, J., Liu, R., Yu, W., Shen, Z., 2015. Spatial variation, environmental risk and biological hazard assessment of heavy metals in surface sediments of the Yangtze River estuary. Mar. Pollut. Bull. 15, 2 5 0e2 5 8.
Wang, D., Xia, W., Lu, S., Wang, G., Liu, Q., Moore, W.S., Chen, C.T.A., 2016a. The nonconservative property of dissolved molybdenum in the western Taiwan Strait: relevance of submarine groundwater discharges and biological utiliza-tion. Geochem. Geophys. Geosyst 17, 2 8e4 3.
Wang, Y., Liu, R.H., Zhang, Y.Q., Cui, X.Q., Tang, A.K., Zhang, L.J., 2016b. Transport of heavy metals in the Huanghe River estuary, China. Environ. Earth Sci. 75, 288. Wang, Y., Ling, M., Liu, R.H., Yu, P., Tang, A.K.K., Luo, X.X., Ma, Q., 2017. Distribution and source identification of trace metals in the sediment of Yellow River Es- tuary
and the adjacent Laizhou Bay. Phys. Chem. Earth.http://dx.doi.org/ 10.1016/j.pce.2017.02.002.
Wedepohl, H., 1995. The composition of the continental crust. Geochim.Cosmochim. Acta 59, 1217e1232.
Wen, L.S., Jiann, K.T., Santschi, P.H., 2 00 6 . Physicochemical speciation of bioactive trace metals (Cd, Cu, Fe, Ni) in the oligotrophic South China Sea. Mar. Chem. 101, 104e129.
Wilbers, G.J., Becker, M., Nga, L.T., Sebesvari, Z., Renaud, F.G., 2014. Spatial and temporal variability of surface water pollution in the Mekong Delta, Vietnam. Sci. Total. Environ. 485, 6 5 3e6 65.
Windom, H., Smith, R., Niencheski, F., Alexander, C., 2 000 . Uranium in rivers and estuaries of globally diverse smaller watershed