The Effect of Internal Control Deficiencies on Audit Fees and Audit
Report Lags
Master’s Thesis
Anna Luikko
Aalto University School of Business
Master’s Programme in Accounting
Fall 2017
Aalto University, P.O. BOX 11000, 00076 AALTO www.aalto.fi Abstract of master’s thesis
Author Anna Luikko
Title of thesis The Effect of Internal Control Deficiencies on Audit Fees and Audit Report Lags Degree Master of Science
Degree programme Master’s Programme in Accounting Thesis advisor(s) Henry Jarva
Year of approval 2017 Number of pages 61 Language English Abstract
An audit can be viewed as a part of an entity’s overall financial reporting system, and as such an audit has its substitutes and complements. As the benefits of a well-functioning financial reporting system, of which both internal controls and auditing are a part of, are in liability avoidance, it follows that internal control is a substitute for auditing, and vice versa. Therefore, a weakness in internal control affects the amount of audit work, which is reflected both in the price of an audit and the length of an audit.
The Sarbanes-Oxley Act, implemented in the aftermath of several accounting fraud scandals, aims to enhance financial disclosures and prevent fraudulent accounting. Internal control reporting re-quirements in Section 404 have been arguably one of the most controversial aspects of SOX as they require the management to document, evaluate, and publicly report the effectiveness of internal controls and the auditor to attest to and report on this assessment. Section 404 internal control disclosures provide more insight into the internal controls of an entity, and open up a new way to research the effects that internal control has on auditing.
This thesis investigates how a reported material weakness in internal control influences audit fees and audit report lag. As a weakness in internal control will likely lead to more audit work, the as-sumption is that a material weakness in internal control affecting financial reporting will increase the price of an audit and prolong the audit report lag. The first hypothesis is that audit fees will be higher for companies that have reported one or more internal control deficiencies under SOX Sec-tion 404. The second hypothesis is that the audit report lag will be longer for companies that have reported one or more internal control deficiencies under SOX Section 404.
The hypotheses are evaluated using multivariate regression analysis. The analyses will be carried out to model the relationships that audit fees and audit report lags have to their determinants. The data used is taken from Compustat and AuditAnalytics databases and consists of financial infor-mation of U.S. companies with fiscal year end dates between 01/01/2005 and 31/12/2015.
The results are that a reported material weakness in internal control has a significant positive re-lationship with audit fees and audit report lags. The percentage effect of an internal control defi-ciency on audit fees is 20.2 % and 9.4 % on audit report lag. These findings are consistent with previous research, and add to the body of knowledge concerning the effects of reported internal control deficiencies.
Keywords internal control deficiency, audit fee, audit report lag, Sarbanes-Oxley Act, Section 404
Aalto-yliopisto, PL 11000, 00076 AALTO www.aalto.fi
Maisterintutkinnon tutkielman tiivistelmä
Tekijä Anna Luikko
Työn nimi Sisäisen kontrollipuutteen vaikutus tilintarkastuksen hintaan ja kestoon Tutkinto Kauppatieteiden maisteri
Koulutusohjelma Laskentatoimi Työn ohjaaja(t) Henry Jarva
Hyväksymisvuosi 2017 Sivumäärä 61 Kieli englanti
Tiivistelmä
Tilintarkastusta voidaan pitää osana talousraportointijärjestelmää ja sen vuoksi tilintarkastuksella on korvikkeensa ja komplementtinsa. Koska hyvin toimivan talousraportointijärjestelmän, jonka osia sekä sisäinen kontrolliympäristö sekä tilintarkastus ovat, hyödyt ovat vastuuseen joutumisen välttämisessä, seuraa että sisäinen tarkastus on korvike tilintarkastukselle, ja päinvastoin. Tämän vuoksi sisäinen kontrollipuute vaikuttaa tilintarkastustyön määrään, mikä vaikuttaa sekä tilin-tarkastuksen hintaan että kestoon.
Sarbanes-Oxley laki, joka säädettiin useiden kirjanpitopetosskandaalien seurauksena, pyrkii parantamaan tilinpäätöstietoja ja ehkäisemään vääristeltyä kirjanpitoa. Sisäisen valvonnan raportointivastuut 404-pykälässä ovat olleet SOX:n kiistanalaisimpia velvoitteita, sillä ne edellyttävät johtoa dokumentoimaan, arvioimaan ja julkisesti raportoimaan sisäisten kontrollien toimivuudesta ja tilintarkastajaa lausumaan johdon arvion paikkansapitävyydestä. 404-pykälän edellyttämä raportointi sisäisten kontrollien toimivuudesta antaa enemmän tietoa yhteisön sisäisistä kontrolleista ja samalla mahdollistaa uuden tavan tutkia sisäisen kontrollin vaikutuksia tilintarkastukseen.
Tämä Pro Gradu –tutkielma käsittelee miten raportoitu sisäinen kontrollipuute vaikuttaa tilintarkastuspalkkioihin ja tilintarkastuksen kestoon. Sisäinen kontrollipuute todennäköisesti lisää tilintarkastustyön määrää ja oletuksena on että raportoitu sisäinen kontrollipuutee nostaa tilintarkastuksen hintaa ja pidentää sen kestoa. Ensimmäinen hypoteesi on että tilintarkastuspalkkiot ovat suurempia yhteisöille, jotka ovat raportoineet vähintään yhden sisäisen kontrollipuutteen SOX 404-pykälän mukaisesti. Toinen hypoteesi on että tilintarkastusviive on pidempi yhteisöille jotka ovat raportoineet vähintään yhden sisäisen kontrollipuutteen SOX 404-pykälän mukaisesti.
Hypoteesit pyritään todentamaan käyttämällä monimuuttujaregressioanalyysia. Analyysit tehdään jotta saataisiin mallinnettua tilintarkastuspalkkioiden ja tilintarkastusviiveen suhdetta niiden tekijöihin. Käytettävä data on haettu Compustat ja AuditAnalytics –järjestelmistä ja koostuu yhdysvaltalaisyritysten taloudellisesta informaatiosta tilikausilta, jotka päättyivät välillä 1.1.2005-31.12.2015.
Tutkimustuloksena on että sisäisellä kontrollipuutteella on tilastollisesti merkittävä positiivinen vaikutus tilintarkastuspalkkioihin ja tilintarkastusviiveeseen. Sisäisen kontrollipuutteen prosenttivaikutus tilintarkastuspalkkioihin on 20.2 % ja tilintarkastusviiveeseen 9.4 %. Nämä tutkimustulokset ovat linjassa aiemman tutkimuksen kanssa, ja lisäävät tietoa sisäisten kontrollipuutteiden vaikutuksista.
Avainsanat sisäinen kontrollipuute, tilintarkastuspalkkio, tilintarkastusviive, Sarbanes-Oxley
4
Table of Contents
1 Introduction ... 7
1.1 Background ... 7
1.2 Hypotheses and Research Design ... 8
1.3 Structure of the Thesis ... 9
2 Internal Control and Internal Control Deficiencies ... 10
2.1 Components of Internal Control ... 10
2.2 Internal Control and Auditing ... 10
2.3 Sarbanes-Oxley Act and Internal Control Audits ... 11
2.4 Determinants of Material Weaknesses in Financial Reporting ... 12
3 Determinants of Audit Fees ... 15
3.1 Overview of Audit Pricing Theory ... 15
3.2 Size ... 15
3.3 Complexity ... 16
3.4 Audit Risk ... 17
3.5 Profitability and Leverage ... 18
3.6 Form of Ownership ... 19
3.7 Free Cash Flow ... 19
3.8 Location ... 20
3.9 Fiscal Year End Date ... 20
3.10 Audit Report Lag ... 21
3.11 Auditor Attributes ... 21
3.12 Internal Control ... 22
4 Determinants of Audit Report Lag ... 24
4.1 Overview of Audit Report Lag ... 24
4.2 Pressure for Prompt Reporting ... 24
4.3 Form of Ownership ... 25
4.4 Complexity ... 25
4.5 Profitability and Leverage ... 26
4.6 Audit Technology ... 26
4.7 Auditor’s Resources and Resource Allocation ... 27
4.8 Non-Audit Services ... 28
4.9 Internal Control ... 28
4.10 Other Determinants of Audit Report Lag ... 29
5 Data and Methods ... 30
5.1 Data ... 30
5.1.1 Data Selection ... 30
5.1.2 Descriptive Statistics ... 30
5.2 Methods ... 33
5.2.1 Multivariate Regression Analysis ... 33
5.2.2 Defining the Regression Models ... 35
5
6 Findings ... 39
6.1 Results of the Multivariate Regression Analyses ... 39
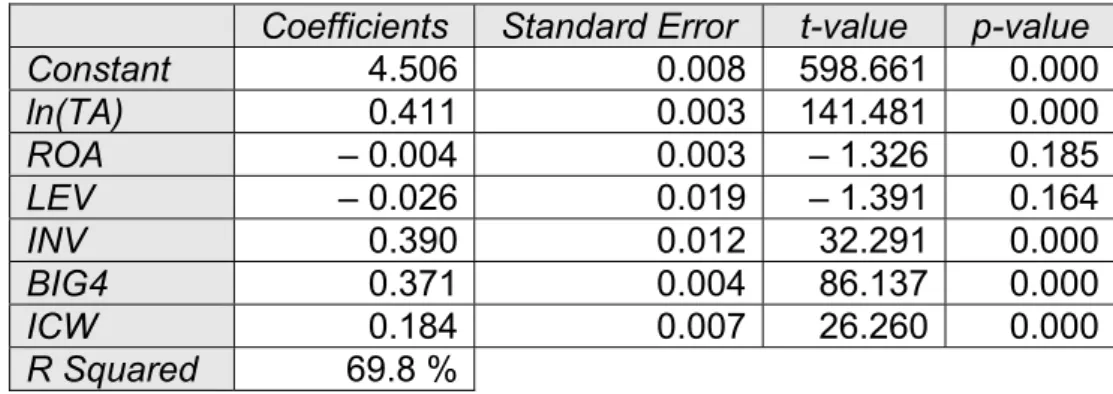
6.1.1 Audit Fee Model Results ... 39
6.1.2 Audit Report Lag Model Results ... 42
6.2 Model Diagnostics ... 44
6.2.1 Audit Fee Model Diagnostics ... 44
6.2.2 Audit Report Lag Model Diagnostics ... 48
7 Discussion ... 52
7.1 Relationship between Internal Control Deficiencies and Audit Fees ... 52
7.2 Relationship between Internal Control Deficiencies and Audit Report Lag . 54 8 Conclusions ... 56
References ... 58
Appendices ... 60
List of Tables Table 1 Descriptive Statistics of Audit Fee Model Variables ... 31
Table 2 Pearson's Product-Moment Correlations of Independent Variables in the Audit Fee Model ... 31
Table 3 Descriptive Statistics for Audit Report Lag Model Variables ... 32
Table 4 Pearson Product-Moment Correlations of Independent Variables in the Audit Report Lag Model ... 33
Table 5 Hypothesized Relationships between the Dependent Variable ln(AF) and the Independent Variables ... 37
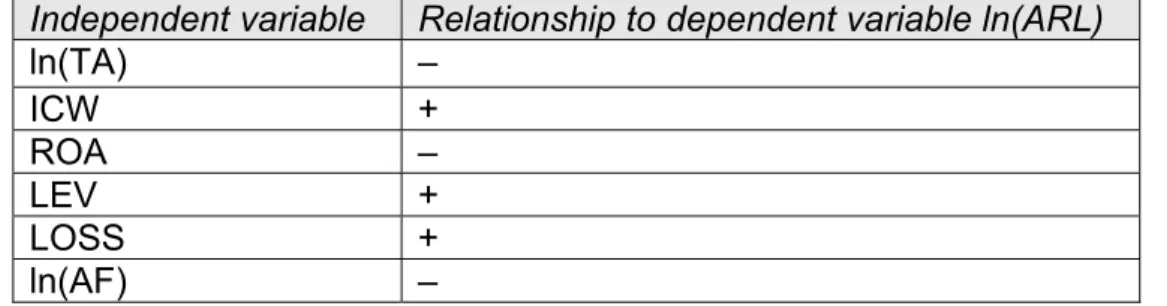
Table 6 Hypothesized Relationships between the Dependent Variable ln(ARL) and the Independent Variables ... 38
Table 7 Multivariate Regression Results, Dependent Variable ln(AF) ... 39
Table 8 Sensitivity Analysis, Dependent Variable ln(AF) ... 41
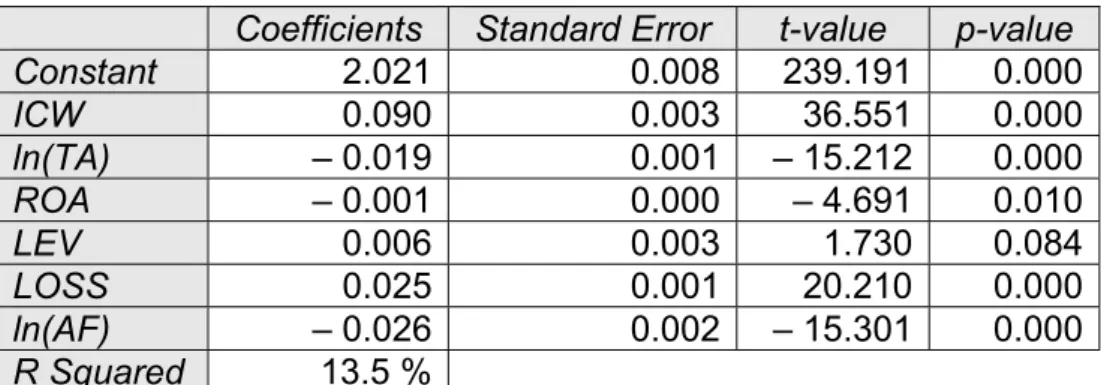
Table 9 Multivariate Regression Results, Dependent Variable ln(ARL) ... 42
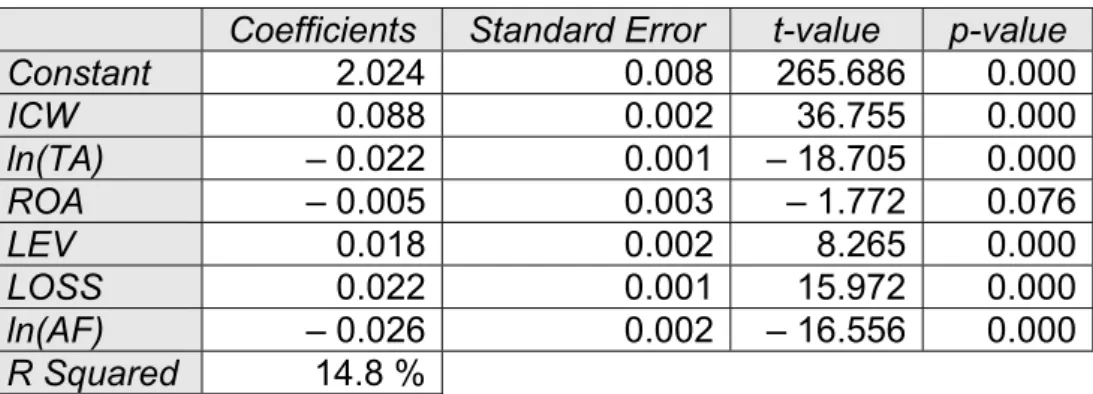
Table 10 Sensitivity Analysis, Dependent Variable ln(ARL) ... 43
Table 11 Tolerance and VIF Values, Dependent Variable ln(AF) ... 47
Table 12 Multicollinearity Diagnostics, Dependent Variable ln(AF) ... 47
6
Table 14 Tolerance and VIF Values, Dependent Variable ln(ARL) ... 51 Table 15 Hypothesized and Actual Signs of the Coefficients, Dependent Variable ln(AF) ... 52 Table 16 Hypothesized and Actual Signs of Coefficients, Dependent Variable ln(ARL) ... 55
List of Figures
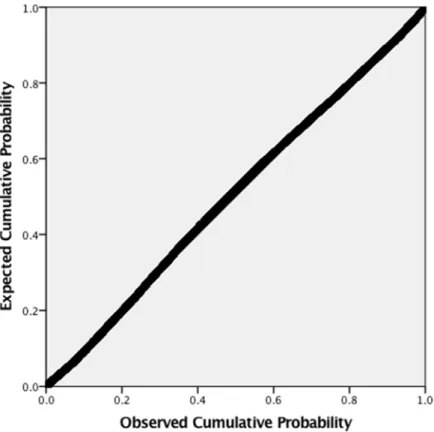
Figure 1 Normal P-P Plot of Regression Standardized Residuals, Dependent Variable ln(AF) ... 44 Figure 2 Histogram of Residuals, Dependent Variable ln(AF) ... 45 Figure 3 Scatterplot, Dependent Variable ln(AF) ... 46 Figure 4 Normal P-P Plot of Regression Standardized Residual, Dependent
Variable ln(ARL) ... 48 Figure 5 Histogram, Dependent Variable ln(ARL) ... 49 Figure 6 Scatterplot, Dependent Variable ln(ARL) ... 50
List of Appendices
Appendix 1: Scatterplot of the Residuals of the Audit Fee Model 60
7
1 Introduction
1.1 Background
Auditing has risen from the need of objective evaluation of information presented in a financial statement of an entity. This need arises from information asymmetry and conflicts of interest between those producing the financial statements and those us-ing the financial statements. The former is the entity’s management, who are re-sponsible for managing the entity’s assets, while the latter are the entity’s owners, who have invested in the company and are thus interested in its financial perfor-mance. The management generally has more information regarding the entity’s fi-nancial position than the owners, especially when ownership is spread out and the owners are not actively involved in the management of the entity. There is thus an asymmetry of information.
The management’s goals may not always coincide with those of the owners, which creates a conflict of interest. This conflict can be somewhat mediated by manage-ment reporting to the owners, for example, by presenting them with financial state-ments. Due to the information asymmetry, the owners cannot themselves verify the accuracy of the financial reports. The reports are also somewhat influenced by man-agement’s assertions, which the management cannot evaluate objectively. To re-solve the issues of information asymmetry and conflicts of interest, the management can employ an independent auditor, who reports on the fairness of the financial statements. The auditor gathers evidence to evaluate the financial statements and reports on whether they give a true and fair view of the entity’s financial situation. An unmodified opinion, or a ‘clear report’, adds to the credibility of the financial state-ments, and thus reduces the information risk of the owners. (Eilifsen et al 2014: 5– 7)
The Sarbanes-Oxley Act, implemented in the aftermath of several accounting fraud scandals, aims to enhance financial disclosures and prevent fraudulent accounting. SOX marked an unprecedented shift from self-regulation to government-regulation in the history of regulatory intervention in US audit markets and has been a focal point in auditing research. Internal control reporting requirements in Section 404
8
have been arguably one of the most controversial aspects of SOX. (DeFond and Zhang 2014) Many have asserted that SOX Section 404 imposes an extreme bur-den on entities as it requires them to not only document, evaluate, and publicly re-port the effectiveness of internal controls but also to have the auditor attest to and report on this assessment (Ashbaugh-Skaife, Collins, and Kinney 2007: 189). Sec-tion 404 internal control disclosures provide more insight into the internal controls of an entity, and open up a new way to research the effects of internal control on au-diting.
1.2 Hypotheses and Research Design
According to Simunic, an external audit can be viewed as a part of an entity’s overall financial reporting system. From this view point, an audit is an economic good, which has its substitutes and complements. As the benefits of a well-functioning financial reporting system, of which both internal controls and auditing are a part of, are in liability avoidance, it follows that internal control is a substitute for auditing, and vice versa. (Simunic 1980: 162) If internal control is a substitute for auditing, a weakness in internal control would affect the amount of audit work, which would be reflected both in the price of an audit and the length of an audit.
First, we will investigate how a reported internal control deficiency influences audit fees. As a weakness in internal control will likely lead to more audit work, the as-sumption is that the presence of an internal control deficiency will increase the price of an audit. The assumption is supported by prior research by Raghunandan and Rama (Raghunandan and Rama 2006).
Hypothesis 1: Audit fees will be higher for companies that have reported one or more internal control deficiencies under SOX Section 404.
Second, we will determine the relationship between a reported internal control defi-ciency and audit report lag, which is the number of days between fiscal year end and the date of the audit report. As an internal control deficiency should increase
9
the amount of audit work, it should also increase audit report lag. Munsif, Raghunan-dan, and Rama found evidence of a positive relationship between reported internal control deficiencies and audit report lags (Munsif, Raghunandan, and Rama 2012).
Hypothesis 2: Audit report lag will be longer for companies that have reported one or more internal control deficiencies under SOX Section 404.
The hypotheses will be evaluated using multivariate regression analysis. The anal-yses will be carried out to model the relationships that audit fees and audit report lags have to their determinants. The data used is taken from Compustat and Au-ditAnalytics databases and consists of financial information of U.S. companies with fiscal year end dates between 01/01/2005 and 31/12/2015. Prior research has not included as long a time period or as many observations. Raghunandan and Rama’s research, for example, focused on the first years after the implementation of SOX Section 404. As time passes from the implementation of SOX Section 404, more data on internal control deficiencies becomes available, allowing the inclusion of a larger number of observations to the data to be studied.
1.3 Structure of the Thesis
The introduction presented in section 1 is followed by a literature review broken down into three sections: section 2 presents the concept of internal control and in-ternal control deficiencies, section 3 cover the determinants of audit fees found in prior research, and section 4 discusses the determinants of audit report lags found in prior research. The literature review is followed by data and methods in section 5, which goes over the data selection process and descriptive statistics of the data. Section 6 consists of model diagnostics of the regression analyses and the results of the analyses, while section 7 includes the evaluation of the results in light of pre-vious research. The last section of the thesis, section 8, is conclusions.
10
2 Internal Control and Internal Control Deficiencies
2.1 Components of Internal Control
An entity’s management is responsible for designing and implementing a system of internal controls that ensures financial and non-financial reporting is reliable and timely, operations are effective and efficient, and applicable laws and regulations are followed. According to the COSO framework, internal control can be further bro-ken down into five components: control environment, entity’s risk assessment, con-trol activities, information and communication, and monitoring activities. The concon-trol environment is the set of rules, guidelines, and organisational structures that form the foundation for internal control in an organisation. This environment sets the tone of internal control in an entity. The entity’s risk assessment process covers the iden-tification and assessment of risks to the entity’s objectives as well as the identifica-tion and assessment of risk-reducing changes. Control activities mitigate risks to the achievement of the entity’s goals and are performed on all organisational levels. Control activities include approvals, authorisations, verifications, reconciliations, and segregation of duties. Information and communication are needed so that eve-ryone within the entity is aware of internal control responsibilities and understands the importance of those controls. Monitoring activities are ongoing or separate eval-uations of controls to determine whether they are operating effectively. Together these five components represent what the entity needs to do in order to achieve the three objectives of internal control: operations, reporting, and compliance. An audi-tor is mainly concerned with how internal control affects the external financial re-porting. (Eilifsen et al, 2014)
2.2 Internal Control and Auditing
The auditor is required to obtain an understanding of an entity’s internal control, covering all five components listed above. The auditor might, for example, interview the entity’s management to get a sense of the control environment of the company. If the entity makes extensive use of IT systems, the auditor needs to understand the controls that are relevant for the financial reporting process. The auditor then uses this understanding to identify what kinds of misstatements may occur, factors that
11
contribute to the risk of a material misstatement, and design substantive tests and tests of controls. In testing the control, the auditor may detect a deficiency in internal control. The Public Company Accounting Oversight Board defines it as follows: “A deficiency in internal control over financial reporting exists when the design or op-eration of a control does not allow management or employees, in the normal course of performing their assigned functions, to prevent or detect misstatements on a timely basis.”1 An internal control deficiency may result from a control that is de-signed, implemented or operated in a way that renders the control ineffective. It may also result from missing a necessary control altogether. (Eilifsen et al, 2014)
2.3 Sarbanes-Oxley Act and Internal Control Audits
The Sarbanes-Oxley Act was signed into law in July 2002 in the aftermath of ac-counting scandals such as Enron and WorldCom. The Act mandated numerous re-forms to enhance corporate responsibility and financial disclosures as well as com-bat corporate and accounting fraud, and created the "Public Company Accounting Oversight Board" (SEC 2013). Since its implementation, SOX has been a focal point in auditing research. Some major SOX provisions are the requirement of financial expertise on audit committees, Section 404 audits, restrictions on employing former auditors, and mandated PCAOB inspections. Arguably the costliest and most con-troversial SOX provision is Section 404. (DeFond and Zhang 2014) It has been es-timated that the average SOX implementation costs per client were $ 2 million (Krishnan et al. 2008).
Section 404 of the Sarbanes-Oxley Act requires that annual reports filed with the Securities and Exchange Commission in the United States shall “contain an internal control report, which shall:
1) state the responsibility of management for establishing and maintaining an adequate internal control structure and procedures for financial reporting; and
12
2) contain an assessment, as of the end of the most recent fiscal year of the issuer, of the effectiveness of the internal control structure and procedures of the issuer for financial reporting.”
In addition, section 404 states that “[W]ith respect to the internal control assessment required by subsection (a), each registered public accounting firm that prepares or issues the audit report for the issuer shall attest to, and report on, the assessment made by the management of the issuer ... Any such attestation shall not be the subject of a separate engagement.” Section 404 thus requires that both manage-ment and the auditor to report on the effectiveness of internal control of the entity. (Raghunandan and Rama 2006: 100-101)
As mentioned earlier, there are high costs associated with implementing section 404, and a substantial part of these costs are audit fees. Previously, in the pre-SOX era, auditors could choose not to rely on internal controls and only conduct substan-tive testing. However, SOX Section 404 requires the auditor to not only evaluate management’s statement on the effectiveness of internal control but also to conduct an independent assessment of internal controls. This change means that in follow-ing the implementation of Section 404 auditors are always required to test internal controls, which increases the amount of effort required by the audits of internal con-trol. Additional work is required if a material weakness in internal control is detected, as then the auditor will need to carry out additional testing, discuss the matter with the entity’s management, and document the reasoning why a material weakness was classified as such, as opposed to a significant deficiency, which does not need to be reported in the SEC filings. (Raghunandan and Rama 2006: 101-102)
2.4 Determinants of Material Weaknesses in Financial Reporting
Prior to SOX-mandated internal control audits, required under Section 404, internal control deficiencies could be reported under Section 302. Section 302 required man-agement to evaluate internal controls and procedures, report on this evaluation, and report any internal control deficiency identified, if management concludes the defi-ciency should be publicly disclosed. As opposed to Section 404, Section 302 allows for more managerial discretion. In a study on internal control disclosures under Section 302 prior to the implementation of Section 404, Ashbaugh-Skaife, Collins,
13
and Kinney find that entities reporting internal control deficiencies have more com-plex operations, recent organisational changes, higher auditor turnover, and less resources dedicated to internal control. Additionally, the study found that smaller, financially distressed firms are more likely to disclose internal control deficiencies, and that an auditor resignation in the year prior to the internal control deficiency disclosure is a highly significant risk factor in explaining the occurrence of internal control deficiencies. The entities disclosing internal control deficiencies under Sec-tion 302 are more likely audited by a dominant auditor and are more likely to issue financial restatements. (Ashbaugh-Skaife, Collins, and Kinney 2007: 166-168, 190)
In their 2007 study on determinants of internal control weaknesses over financial reporting, Doyle, Ge, and McVay find that the determinants of disclosed material weaknesses vary based on the reason for the material weakness and the perva-siveness of the material weakness. Three different categories based on the reason behind a material weakness disclosure are formed: staffing, complexity, and gen-eral. In comparison to complexity and general weaknesses, staffing issues are more pervasive smaller, younger, and financially weaker entities, which most often have the least complex organisational structures. In addition, these entities tend to have higher sales growth. These findings imply that the younger, growing firms may strug-gle to commit the sufficient resources required to maintain strong internal controls. Entities with complexity weaknesses, on the other hand, tend to be the largest, old-est, and most operationally diverse as well as have the highest governance quality. Lastly, general material weaknesses are reported by a diverse group of entities, as general weaknesses cover a large range of internal control issues, ranging from lacking documentation to problems with revenue recognition. Compared to the other two categories, this category includes more issues that are related to earnings man-agement, and interestingly it appears that the control deficiencies detected might be associated with poor governance. (Doyle, Ge, and McVay 2007: 197, 214)
With regard to their severity, material weaknesses can be divided into account-spe-cific and company-level material weaknesses. An account-speaccount-spe-cific material weak-ness only affects the account balance in question, and this type of weakweak-ness could possibly be identified by the auditor and through more substantive audit procedures sufficient audit evidence could still be obtained from that account, thus posing no
14
serious concern for the overall reliability of the entity’s financial statements. Entities reporting account-specific weaknesses tend to be larger, older, and financially stronger and also have more complex operations and more growth. It seems logical that severe, account-specific issues are more common in mature entities that are more likely to face complex accounting issues than smaller and less complex enti-ties. (Doyle, Ge, and McVay 2007: 205-206, 214)
A company-level material weakness is more invasive and caused by a failing in a macro-level control, like the control environment the entire process of financial re-porting. Such a pervasive internal control deficiency could pose severe issues for conducting the audit and obtaining sufficient audit evidence, and could lead to ques-tioning the entity’s ability to prepare reliable financial statements. Entities with com-pany-level weaknesses are found to be younger, smaller, and financially weaker as well as less complex. Overall, entities with severe internal control issues appear to lack the resources or proficiency to manage a strong internal control system. (Doyle, Ge, and McVay 2007: 205-206, 213-214)
In general, the study found that a material weakness in internal control is more likely for entities that are smaller, younger, less profitable, more complex, growing rapidly, or undergoing restructuring (Doyle, Ge, and McVay 2007: 220). These results are similar to those obtained from the study of Ashbaugh-Skaife et al., with the latter also finding that auditor resignations could be indicative of internal control deficien-cies. Both studies found a link between complexity of operations and internal control deficiencies, which is logical, as the more complex an entity becomes the higher the demands for internal control become; as complexity increases, operations often be-come more spread out, which puts a strain on internal control. Restructuring of op-erations, which may come about due to mergers and acquisitions, requires changes to internal controls, and in if these changes are not implemented with due care, internal control deficiencies may be created. Growing entities face a similar threat to internal control, as internal controls may not keep up with the expanding opera-tions, and smaller or financially distressed entities may simply lack the resources to dedicate due care for maintaining a functioning internal control system.
15
3 Determinants of Audit Fees
3.1 Overview of Audit Pricing Theory
Audit fees and their determinants have been widely researched all over the world. As reporting audit fees in the financial statements is becoming increasingly popular, the availability of data is increasing, opening further opportunities for audit pricing research. One of the founding fathers of audit pricing research is Simunic, who in 1980 researched the determinants of audit fees. He hypothesized that size, com-plexity of operations, financial statement components that are difficult to audit, in-dustry, and form of ownership of the auditee would affect the auditor’s exposure to loss, which would in turn affect the audit fee. In his audit-pricing model, Simunic also included profitability, loss, reception of a qualified opinion, and the length of time the current auditor has been auditing the auditee, while form of ownership was not in-cluded in the model. Simunic found a statistically significant relationship between audit fees all the determinants he identified except for profitability. (Simunic 1980: 172, 176, 186-187)
While later research has used identified several other determinants of audit fees, the determinants Simunic found in his research are still at the core of audit fee re-search. However, some of the determinants have been found to have a different impact on audit fees across countries (Nikkinen & Sahlström 2004: 261). The effects that determinants have on audit fees can also differ from one study to another within the same geographical area, but for many independent variables the results are consistent when looking at a greater number of studies (Hay et al. 2006: 141). The rest of this section outlines the determinants of audit fees used in audit fee research, and examines their relationship to audit fees.
3.2 Size
According to Hay, Knechel, and Wong’s 2006 meta-analysis study, the size of the auditee is the most dominant determinant of audit fees, found in virtually all pub-lished studies they examined. Their meta-analysis points to a positive association between size of an entity and audit fees, and the analysis also suggests that size is
16
a critical explanatory variable for a model of audit fees. The size of the auditee is most commonly measured by its total assets and occasionally by its revenue.
There are some issues in regard to using revenue as a determinant of audit fees: firstly, the definition of turnover may vary from industry to industry and secondly, larger sales volume does not necessarily increase the amount of audit work (Chan, Ezzamel, and Gwilliam 1993: 766). Simunic remarks that external auditors have traditionally approached the audit from the balance sheet, relying on the assumption that if the balance sheet is verified, its components will indirectly verify the income statement. He also notes that auditing is a sampling-based process, and the greater the total assets the elements that it consists of become more numerous, resulting in larger sample sizes and thus more work. (Simunic 1980: 172)
Even though size is quite clearly an important determinant of audit fees, there has been some criticism towards the assumption of a linear relationship between size of the auditee and audit fees. Typical fee models, which do not account for a non-linear relationship between size and fees, may influence tests of determinants of audit fees. (Carson, Fargher, Simon, and Taylor 2004: 89)
3.3 Complexity
When an entity is more diverse and decentralised, the number of decision centres increases, and more monitoring of these decision centres is needed. (Simunic, 1980: 172) Therefore, the more complex a client is, the harder it is to audit. In prior research, complexity has been measured in several different ways, the most typical being the number of subsidiaries, the number of foreign subsidiaries, and the pro-portion of foreign assets. While the measures for complexity have been varied, pre-vious empirical evidence shows strong support to a positive correlation between complexity and audit fees. (Hay et al 2006: 169)
Audits of parent companies could be presumed to be more complex, and thus labo-rious, than audits of non-parents, as auditors of parent companies are usually re-quired to audit not only the parent company’s financial statements but the group’s
17
consolidated financial statements as well. Conducting audits of several group com-panies, as opposed to one audit for a company the size of all group companies combined, increases statutory reporting requirements, which in turn may lower the levels of materiality for subsidiaries below the materiality thresholds established at the group level. Lower levels of materiality tend to result in more audit work. A group auditor also needs to audit intragroup transactions, if such transactions have taken place during the fiscal year being audited. (Chan et al. 1993: 767)
Audits of foreign subsidiaries should be costlier than audits of similar domestic com-panies, as the complexity of financial reporting is greater for them. Differing account-ing rules between countries result in the subsidiary producaccount-ing at least two sets of financial statements – one set that complies with regulations in the country in which it is operating, and another set that follows the accounting rules and regulations of the parent company and can be used for consolidation of group financial statements. Often foreign subsidiaries operate in a different currency from the parent company’s operational currency, making foreign currency translations necessary. (Niemi 2005: 308-309, 311)
3.4 Audit Risk
Most auditors plan their audit approach using an audit risk model, where the per-ceived audit risk is used to determine the extent and scope of audit testing. Audit risk is the risk that the auditor gives an unmodified opinion when the financial state-ments contain a material misstatement. Audit risk can be broken down into three different factors:
Inherent risk and control risk can be combined as the risk of material misstatement, where inherent risk is the part of the risk that does not result from an internal control deficiency. The risk of material misstatement depends on the client, and the auditor has little control over it. Detection risk is the risk that the audit procedures fail to detect a misstatement, which could individually or combined to other misstatements result in a material misstatement. The auditor influences audit risk by setting the
18
level of detection risk. Therefore, if the risk of material misstatement is high, the auditor will plan to conduct more audit testing to reduce the detection risk and thus reduce the overall audit risk. Interviews conducted with representatives of the lead-ing audit firms in 1993 confirmed that audit risk is a significant factor in plannlead-ing the amount of audit work to be completed and by consequence the audit fee charged. (Eilifsen et al 2014: 96; Chan et al. 1993: 769)
Audit risk is difficult to measure directly, making it difficult to study its effect on audit fees. Inherent risk may increase audit fees, as it may require specialised audit pro-cedures. Two areas that are often attributed as difficult to audit are inventory and receivables. Most often inherent risk is measured by inventory as a portion of total assets, receivables as a portion of total assets, or the combination of inventory and receivables as a portion of total assets. (Chan et al. 1993: 769; Hay et al 2006: 170, Simunic 1980: 173)
3.5 Profitability and Leverage
If an entity has poor profitability, it is more likely that the auditor will be exposed to a loss. In most previous studies, a ratio of net income divided by total assets and/or a dummy variable for loss is used to measure profitability. The expected relation-ships between return on assets (ROA) and a loss with audit fees are negative and positive, respectively. Previous studies show a mixed result for the profitability ratio, but there is a significant negative overall result. Some previous research has found the dummy variable of loss to have a significant and positive effect on audit fees. The mixed results suggest that auditors may not put as much emphasis on differ-ences in these metrics when pricing the audit as the model suggests. (Hay et al 2006: 170-171)
Leverage is another measure of potential exposure to risk of loss for the auditor (Simunic 1980). The expected relationship between audit fees and leverage, meas-ured with the ratio to debt to total assets, is positive – the more debt there is, the higher the audit fees are expected to be. This is because a highly indebted entity has a greater risk of bankruptcy. The quick ratio, which is the ratio of current assets to less inventories to current liabilities and thus measures the entity’s short-term
19
liquidity, is also used in several studies, and it has a negative relationship with audit fees. (Hay et al 2006: 171; Nikkinen & Sahlström 2004: 255)
3.6 Form of Ownership
According to the agency theory, there is information asymmetry and conflicts of in-terest between the management and owners of an entity. Resolving this asymmetry and conflicts of interest result in agency costs, for example the price of an audit conducted by an independent auditor. If an entity is both managed and owned by the same individuals, the asymmetry of information is reduced and interests coin-cide to a greater extent, leading to fewer conflicts of interest. Nikkinen and Sahl-ström have proposed that there should be a negative relationship between audit fees and management ownership, as an entity with more management ownership should have lower agency costs, as per the agency theory. In their 2004 study span-ning seven countries that represented different kinds of accounting environments, Nikkinen and Sahlström found evidence for the existence of the negative relation-ship, concluding that the amount of management ownership affects the audit fees. (Nikkinen & Sahlström 2004: 255, 261)
Another way of looking at the relationship between ownership and audit fees is to consider the ownership structure. It has been hypothesized in a 1993 study by Chan et al. that far spread ownership creates a need for a more extensive and high-quality audit than an audit fulfilling the statutory requirements. This hypothesis is based on the idea of ownership control: major shareholders are assumed to be able to monitor the entity and control management directly or indirectly, reducing the need for addi-tional audit work exceeding the requirements of a statutory audit, and consequently, lowering audit fees. The study found that ownership control was an important deter-minant of audit fees. (Chan et al. 1993: 770, 780)
3.7 Free Cash Flow
In prior research, it has been proposed that the higher free cash flow an entity has, the more severe its agency problem becomes. The more cash reserves an entity
20
has, the more choices the management has on how to use the funds, and this in-creases the need of supervision of management behaviour. This oversight can be gained from an audit, and following this line of thought, Nikkinen and Sahlström bring forward the hypothesis that there is a positive relationship between free cash flow and audit fees. Regular debt payments may also help in keeping consumption of funds in check, and thus debt may in fact reduce agency costs. However, debt payments also decrease free cash flow. Nikkinen and Sahlström conclude that a positive relationship between free cash flow and audit fees is found in all of the seven countries studied in their research paper. (Nikkinen & Sahlström 2004: 255)
3.8 Location
Chan et al. investigated the relationship between geographic location and audit fees in the United Kingdom. They used a dummy variable to look at whether audit fees were higher in the London area in comparison to the rest of the UK and found that there was clear evidence for the presence of a London premium in audit fees. The presence of a London premium was also found to be statistically significant in a later study by Che-Ahmad and Houghton. The effect of several locations requiring on-site visits has also been investigated, and was found to be statistically significant in a 1986 study, however, it can be argued that the number of locations requiring on-site visits to conduct an audit is associated with auditee complexity. (Chan et al. 1993: 770-771, 780-781; Palmrose 1986: 100; Che-Ahmad & Houghton 1996)
3.9 Fiscal Year End Date
In many countries, the most popular fiscal year end date is December 31st and due
to this the demand for audit services is higher at the beginning of the year during the auditors’ busy season. In their study of quoted UK companies, Chan et al. meas-ured the effect of fiscal year end date on audit fees. For their analysis, they divided their observations into groups based on the fiscal year end dates: fiscal years ending
between December 1st and March 31st were considered to fall on the busy season.
The study did not find the dummy variable for busy season to be statistically signif-icant. (Chan et al. 1993: 770, 773) In another study by Che-Ahmad and Houghton,
21
it was similarly hypothesized that during the busy season when the auditors’ work-load is higher, due to the higher demand or possibly higher costs, higher prices might be charged. The study also did not find a statistically significant link between fiscal year end coinciding with the busy season and higher audit fees. The lack of a statistically significant relationship between a fiscal year ending during the busy sea-son and audit fees is consistent with the growing phenomenon of year-round audits, where some of the audit work is undertaken outside of the busy season. (Che-Ah-mad & Houghton 1993)
3.10 Audit Report Lag
Audit report lag, or the time between fiscal year end and the date on which the audit report is issued, can be used as a determinant of audit fees. However, the relation-ship between the length of the audit report lag and audit fees is not necessarily straight-forward. A long audit report lag can be indicative of audit problems that re-quired more audit work to be resolved, in which case a short audit report lag would suggest less audit work and lower audit fees. But a short audit report lag may also reflect tighter reporting deadlines, which can be met only by employing a larger audit team or having the audit team work overtime, resulting in higher costs for the audit. The latter hypothesis has not been backed up by statistically significant evidence. Looking at larger number of studies, the expected relationship between audit report lag and audit fees is positive, and out of the twelve studies Hay et al. examined in their 2006 study, six showed a statistically significant positive association. (Chan et al. 1993: 770; Hay et al. 2006: 177)
3.11 Auditor Attributes
The audit market is rather concentrated, with the Big 4 (previously Big 5, Big 6, and Big 8) dominating the market especially when looking at the auditors of enlisted public companies. The meta-analysis carried out by Hay et al. found strong support that having a Big 4 (or Big 5, Big 6, Big 8) auditor has a positive relationship with audit fees. Having a Big 4 versus non-Big 4 auditor is sometimes used as a proxy for audit quality, and the higher audit quality of audits carried out by the Big 4 audit firms could in part account for the higher audit fees. In the study by Chan et al., audit
22
partners interviewed suggested that larger auditees tend to have audit teams with greater expertise, skills, and seniority, and that these qualities could be behind the higher audit fees. They also were of the view that the audit work conducted by such a team would be of higher quality, and that the higher quality would compensate for the increased fees. The same study also detected a Big 8 premium for both large and small auditees. (Hay et al. 2006: 176; Chan et al. 1993: 771, 783)
In a 1981 study, DeAngelo concluded that there was a link between auditor size and perceived audit quality. This link resulted mainly from perceived independence from the client, as a larger auditor would be less likely to behave opportunistically to keep a client, as the client in question would make up a smaller fraction of the auditor’s clientele. (DeAngelo 1981: 197) In 2000, DeFond, Francis, and Wong conducted a study on publicly listed companies in Hong Kong and find that there is a Big 6 pre-mium, and divide this premium into general brand name industry specialisation com-ponents. (DeFond, Francis, and Wong 2000: 49, 57)
Prior research suggests that a recent change of auditor could have a negative effect on audit fees. This effect is likely due to audit firms offering a discounted rate to win new clients, a phenomenon called low-balling, or the new auditor being more effi-cient than the previous one. Based on the meta-analysis of Hay et al., a dummy variable indicating an auditor change seems to be the best proxy to use in audit fee models. (Hay et al. 2006: 176)
3.12 Internal Control
Simunic viewed auditing as a part of an entity’s financial reporting system, and con-sidered that internal control could be viewed as a substitute to auditing (Simunic 1980: 162). Therefore, the internal control environment of an entity is expected to influence audit fees. Gaining access to internal control data can be challenging, and there is no clear proxy to use for measuring an entity’s internal control. Some re-searchers, who have had access to internal control data, have examined the rela-tionship between internal auditing and audit fees, but the overall meta-result from their results are not statistically significant. (Hay et al. 2006: 175) Internal audit work
23
may be directly relevant for an external auditor, and in some cases an external au-ditor may even choose to rely on the work of internal auau-ditors, which would suggest that internal audit expenditure would decrease the amount of work for external au-ditors and thus affect audit fees. Internal audits are, however, only a part of the internal control function, and only looking at the relationship between internal audits and audit fees does not give the full picture of the relationship between internal con-trol and audit fees. (Eilifsen et al. 2014: 88, 688)
Palmrose used the percentage reduction of audit fees from auditee inputs as an independent variable in the 1986 study. These auditee inputs were defined as in-creased internal audit activities, improvement of internal controls, and the use of client personnel for some audit tasks. The percentage figure was obtained from a survey given to the auditees, and survey research has its limitations. (Palmrose 1986: 100)
The implementation of SOX Section 404 has made another way of measuring inter-nal control possible, as Section 404 requires entities to disclose material weak-nesses in internal control. In a research paper on the effect of SOX Section 404 material weakness disclosures on audit fees from 2006, Raghunandan and Rama found that audit fees were 43 percent higher for clients with a material weakness disclosure pursuant to Section 404 in comparison to clients lacking such disclosure. This suggests that having a material weakness in internal control increases audit fees, which to some extent supports the idea of internal control and auditing being each other’s substitutes, as an internal control deficiency leads to higher audit ex-penditure. (Raghunandan and Rama 2006: 112)
24
4 Determinants of Audit Report Lag
4.1 Overview of Audit Report Lag
Audit report lag is the length of time auditors need to complete an audit, measured in the number of days between the end of the auditee’s fiscal year and the audit report date. Audit report lag can affect the date of accounting disclosures, which is significant, as the information value of the financial statements declines as the audit report lag increases. In fact, the timely confirmation of financial figures is arguably one of the primary benefits of audited financial statements. Unexpected delays in financial reporting have also been linked to lower quality of information, increasing incentives to keep the audit report lag at the relatively the same length from one year to another. Audit report lag may also be used as a measure of audit efficiency, as encountering unexpected problems regarding the audit and not being able to resolve sensitive audit issues in a timely manner can increase the audit report lag. Some determinants of audit report lag may thus provide further insight into audit efficiency. (Bamber, Smith Bamber, and Schoderbek 1993: 1; Knechel and Payne 2001: 137; Hay et al. 2006: 177)
Some determinants of audit report lag are the similar to those of audit fees, as fac-tors that make an audit more time-consuming may affect both the audit fee and the audit report lag.
4.2 Pressure for Prompt Reporting
In addition to the ways in which size affects the amount of audit work, outlined in section 3.2, the size of the auditee can also affect the amount of external pressure to release the financial statement: larger audit clients are likely to face more external pressure to report earnings as soon as possible. Larger clients also tend to have more leverage to persuade their auditors to complete the audit in a timelier manner. If the auditee has favourable earnings news to announce, it is likely that manage-ment will attempt to shorten the audit report lag in order to be able to announce the good earnings news as early as possible. In this case the entity’s management may
25
try to speed up the auditing process by negotiating a tighter audit schedule with the auditor. (Bamber et al. 1993: 7)
4.3 Form of Ownership
When ownership of the auditee is spread out, the number of individual investors relying on the auditee’s financial statement information is greater, which in turn in-creases the exposure to litigation and adverse publicity. This inin-creases the business risk of the auditor, which might persuade the auditor to carry out a more extensive audit. However, publicly held companies tend to experience shorter audit report lags than their privately held counterparts. A factor contributing to this outcome is that late financial reporting can result in a negative market reaction, incentivising public companies to keep their audit report lags shorter. The Securities Exchange Com-mission enforce tighter deadlines for publicly traded companies that have a public float exceeding specified limits, which should decrease the audit report lag. (Bamber et al. 1993: 5; Ashton, Willingham, & Elliott 1987: 287; Munsif, Raghunandan, and Rama 2012: 205)
4.4 Complexity
Complexity affects the amount of required audit work, as the more diverse and com-plex the auditee is, the higher the chance of a material misstatement becomes, which thus extends the amount of audit work required. Carrying out a more complex audit is more time-consuming, which prolongs the audit report lag. Bamber at al. measured audit complexity by the number of business segments and by the primary industry of an entity. Segment information reported in the financial statements also need to be audited, which increases the amount of audit work. As the entity’s oper-ations become more diverse in nature, audit work may also become more strenu-ous. The primary industry of an entity can also affect audit complexity, as some industries present industry-specific audit challenges, while other industries with lower inventory and fixed assets may be more straight-forward to audit. (Bamber et al. 1993: 5-6)
26
The presence of extraordinary items on the financial statements can increase the complexity of an audit. Extraordinary items are abnormal, nonrecurring events that are not a product of ordinary business operations. Management’s assertions and judgement are involved in the classification of extraordinary items, and these need to be verified. Additionally, a lower materiality threshold should be applied to ex-traordinary items and thus their inspection requires more audit work. (Bamber et al. 1993: 7)
4.5 Profitability and Leverage
An auditee’s weak financial situation increases the risk of loss exposure for the au-ditor, as discussed in section 3.5. To mitigate this risk, the auditor will carry out more audit work, which may prolong the audit report lag. Besides looking at return on assets and the leverage ratio, net losses can also be used as a determinant of audit report lag. An entity reporting net losses might also suffer from issues such as in-ventory obsolescence, and therefore more audit work is likely required to obtain a sufficient level of audit evidence. (Bamber et al. 1993: 5, 7)
4.6 Audit Technology
Bamber et al. also looked at the affect audit technology has on audit report lag. They brought forward the hypothesis that a structured audit approach under normal cir-cumstances would lead to a longer audit report lag, but if unexpected events occur with the audit, a structured audit approach decreases the audit report lag. Bamber et al. define a structured audit approach as a standardised audit process which au-ditors will follow in conducting the audit work, even if it leads to performing audit work or compiling documentation that only serves to fulfil the requirements of the process. However, the additional audit work conducted due to a structured audit approach is hypothesised to expedite the process of dealing with unanticipated oc-currences. The study found that audit report lags were indeed on average longer for auditors following a structured audit approach, but that the structured audit ap-proach enabled auditors to respond more quickly to unexpected occurrences, short-ening the audit report lag in these situations. These results might suggest that the structured audit approach is more inefficient, or that the structured approach offers
27
some additional benefits in addition to shortening the audit report lag when unantic-ipated events take place. (Bamber et al. 1993: 8-9, 19)
However, after the 1993 study by Bamber et al., audit technology has been further developed and the audit technology used today is significantly different from the technology used over two decades ago. Use of advanced audit technology and data analyses has become increasingly important in auditing, and it has been proposed in more recent research that Big 4 auditors’ access to advanced audit technology makes them more efficient and may reduce the audit report lag. (Lee and Jahng 2008: 30)
4.7 Auditor’s Resources and Resource Allocation
The use of audit report lag as a proxy for audit efficiency or amount of audit work has its limitations: it only measures the audit work conducted after the end of the fiscal year, not taking into account audit work taking place during the fiscal year under audit. Audit report lag also does not take into account the actual work hours of the auditors, as it is measured in days. An audit can be carried out in fewer days by increasing the number of hours dedicated to the audit per day, which can be achieved by increasing the number of audit team members or by having auditors work overtime. However, audit firms are limited by the fixed amount of personnel they employ, which to some extent mitigates the limitation of using days, as opposed to hours, as a measure for the duration of the audit. (Bamber et al. 1993: 19) A study by Knechel and Payne investigated the relationship between incremental audit effort and audit report lag, and found that increase in audit work, measured in hours, pro-longed the audit report lag. (Knechel and Payne 2001: 145)
Another aspect of that could influence audit report lag is the resources allocated to an audit engagement. The general assumption is that the more senior the members of the audit team are, the fewer the hours they require to complete the audit. This is based on the partners and managers having more experience, industry-specific knowledge, and an enhanced understanding of the significant risks associated with the audit. Other audit staff presumably tends to rely more on standardised proce-dures, and has very limited experience in handling unanticipated occurrences. It
28
follows that all audit hours are not equal, and therefore the effect of rank efficiency needs to be taken under consideration when evaluating the relationship between audit hours worked and audit report lag. Knechel and Payne found that employing more experienced external audit personnel decreased the audit report lag. (Knechel and Payne 2001: 138-139)
The availability of audit personnel has also been found to affect the audit report lag. During the busy season, auditors’ resources are stretched thin, and this could po-tentially lead to longer audit report lags. Knechel and Payne discovered that entities with fiscal year end dates in December experienced longer audit report lags, but previous research on the effect of busy season is inconclusive. (Knechel and Payne 2001: 145)
4.8 Non-Audit Services
Non-audit services can have different effects on audit report lag depending on the type of services being provided. Management advisory services have in previous studies been linked to more efficient audits, as knowledge gained from providing such services increases the auditor’s knowledge of the auditee. Conversely, tax services have been found to increase audit report lag, as complicated tax issues can have a direct impact on financial statements and thus tax issues need to be resolved before an audit report can be issued. Knechel and Payne found evidence that provision of management advisory services reduced the audit report lag and tax services increased the audit report lag. (Knechel and Payne 2001: 139, 145)
4.9 Internal Control
Similarly to audit fees, audit report lags are also affected by internal control. In their 2012 study, Munsif, Raghunandan, and Rama found that audit report lags were longer for entities reporting material weaknesses in internal control for years 2008 and 2009. The study also found that entities that had remediated previous internal control deficiencies experienced shorter audit report lags following such remedia-tion, but that the audit report lags were still longer than the audit report lags of enti-ties that had not disclosed material weaknesses at all. This supports Simunic’s view
29
of internal control and auditing being each other’s substitutes, as an increase in attention paid to internal control following a material weakness disclosure leads to less resources employed in auditing. (Munsif et al. 2012: 203)
4.10 Other Determinants of Audit Report Lag
Some other determinants of audit report lag used in prior research are auditor ten-ure, type of audit opinion, and audit fees. The length of auditor tenure may affect audit report lag, as the longer the auditor tenure is, the more familiar the auditor is with the entity and thus the auditor should become more efficient in conducting the audit, and thus auditor tenure should have a negative relationship to audit report lag. (Ashton et al. 1987: 284) An auditor will likely issue a qualified audit opinion only after devoting considerable time and effort into audit procedures in order to avoid issuing a qualified audit opinion, and therefore qualified audit opinions are likely associated with longer audit report lags. It has been the general finding in prior research that entities with qualified audit opinions have longer audit report lags. (Bamber et al. 1993: 7; Ashton et al. 1987: 287)
In section 3.10, audit report lag was presented as a determinant of audit fees, and conversely, audit fees can also be used as a determinant of audit report lag. As both audit fees and audit report lag can be seen as a measurement of the extent of an audit, it logically follows that they would be each other’s determinants. A higher audit fee suggests more audit work, which may indicate a longer audit report lag, how-ever, this depends on how the audit work is timed. Interim audit work increases the audit fee, but does not increase the audit report lag, as interim work is carried out prior to the end of the fiscal year. Also, an audit carried out with a larger audit team may increase audit fees, but decrease duration of the audit, and thus the audit report lag. Prior research suggests that audit fee has a negative relationship with audit report lag. (Munsif et al. 2012: 213)
30
5 Data and Methods
5.1 Data
5.1.1 Data Selection
The data used for this thesis was obtained from Compustat and AuditAnalytics da-tabases and the data was combined using company identifiers and fiscal years. The data consists of financial information of U.S. companies with fiscal years ending between 01/01/2005 and 31/12/2015. SOX Section 404 was implemented in 2003, but additional guidance on its application was issued throughout 2004, and hence these early years of SOX Section 404 are left out of the scope of this study. As all data from the fiscal year 2016 is not yet available, the last year included is 2015.
The data is processed to look for duplicates and missing values for the variables used in the analyses. There are four variables used in either the first and/or the second regression analysis that have missing values, and these are ROA, LEV, INV, and audit report lag. Both of the regression analyses to be conducted include ROA and LEV as variables, and hence all observations missing either one or both of these values are deleted. The resulting number of observations is 48,517. Out of these 48,517 observations, the only variable with missing values is audit report lag. 2,940 observations are missing the audit report lag figures, which are needed for the sec-ond regression analysis, and thus for that analysis only the 45,577 observations that include the audit report lag figures will be used.
5.1.2 Descriptive Statistics
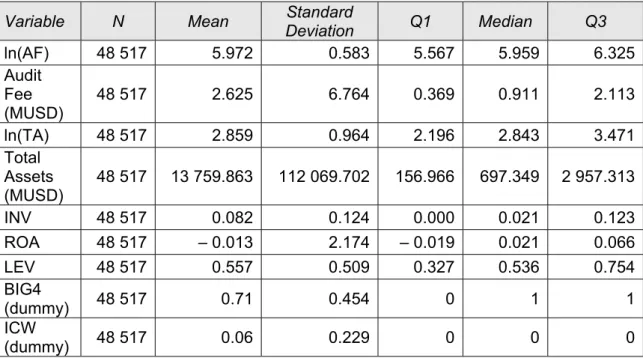
The descriptive statistics for the variables to be used in the first regression analysis are summarized in table 1. As the natural logarithms of audit fees and total assets are used in the regression model, the descriptive statistics of these values as well as the original values are presented in the table. The data consists of 48,517 obser-vations.
31
Table 1 Descriptive Statistics of Audit Fee Model Variables
Variable N Mean Deviation Standard Q1 Median Q3
ln(AF) 48 517 5.972 0.583 5.567 5.959 6.325 Audit Fee (MUSD) 48 517 2.625 6.764 0.369 0.911 2.113 ln(TA) 48 517 2.859 0.964 2.196 2.843 3.471 Total Assets (MUSD) 48 517 13 759.863 112 069.702 156.966 697.349 2 957.313 INV 48 517 0.082 0.124 0.000 0.021 0.123 ROA 48 517 – 0.013 2.174 – 0.019 0.021 0.066 LEV 48 517 0.557 0.509 0.327 0.536 0.754 BIG4 (dummy) 48 517 0.71 0.454 0 1 1 ICW (dummy) 48 517 0.06 0.229 0 0 0
In the data set for the first regression analysis the minimum audit fee is 7,000 USD and the maximum audit fee is 181.4 MUSD, while total assets are between 0.2 MUSD and 3,771,199.85 MUSD.
Next we will look at Pearson’s product-moment correlations to enhance our under-standing of the correlations between the independent variables in the audit fee model.
Table 2 Pearson's Product-Moment Correlations of Independent Variables in the Audit Fee Model
ln(TA) INV ROA LEV BIG4 ICW
ln(TA) 1 – 0.120* 0.020* 0.157* 0.441* – 0.094* INV – 0.120* 1 – 0.002 – 0.047* – 0.026* 0.032* ROA 0.020* – 0.002 1 – 0.182* 0.027* – 0.009 LEV 0.157* – 0.047* – 0.182* 1 – 0.010* 0.021* BIG4 0.441* – 0.026* 0.027* – 0.010* 1 – 0.081* ICW – 0.094* 0.032* – 0.009 0.021* – 0.081* 1
Correlations marked with an asterisk are statistically significant at the 0.05 level. As can be seen from the table, the highest correlation between independent variables is the correlation between the natural logarithm of total assets and the Big 4 dummy
32
variable with a Pearson correlation coefficient of 0.441. All correlations between in-dependent variables are fairly low and do not suggest problems arising from collin-earity.
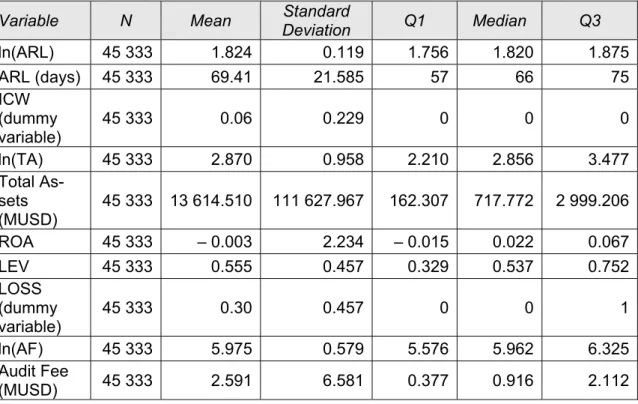
For the second regression analysis, only observations that include the figures for audit report lag are used. Even though some of the same variables are included in the first and the second regression analysis, the descriptive statistics of these vari-ables differ in the two analyses as fewer observations are included in the data set used in the second regression analysis. The total number of observations that in-clude values for all the variables used in the second regression analysis is 45,577. However, for this set of data, audit report lag is between 0 and 986 days. In order to eliminate outliers that would have a disproportionably large effect on the regression model, we will delete all observations with a reported audit report lag that is less than seven days or above 200 days. The descriptive statistics of the variables used in the second regression analysis are shown in table 3.
Table 3 Descriptive Statistics for Audit Report Lag Model Variables
Variable N Mean Deviation Standard Q1 Median Q3
ln(ARL) 45 333 1.824 0.119 1.756 1.820 1.875 ARL (days) 45 333 69.41 21.585 57 66 75 ICW (dummy variable) 45 333 0.06 0.229 0 0 0 ln(TA) 45 333 2.870 0.958 2.210 2.856 3.477 Total As-sets (MUSD) 45 333 13 614.510 111 627.967 162.307 717.772 2 999.206 ROA 45 333 – 0.003 2.234 – 0.015 0.022 0.067 LEV 45 333 0.555 0.457 0.329 0.537 0.752 LOSS (dummy variable) 45 333 0.30 0.457 0 0 1 ln(AF) 45 333 5.975 0.579 5.576 5.962 6.325 Audit Fee (MUSD) 45 333 2.591 6.581 0.377 0.916 2.112
Audit report lag for this data set is from seven days to 199 days. The minimum and maximum values of audit fees and total assets are the same as in the data set for the first regression analysis.
33
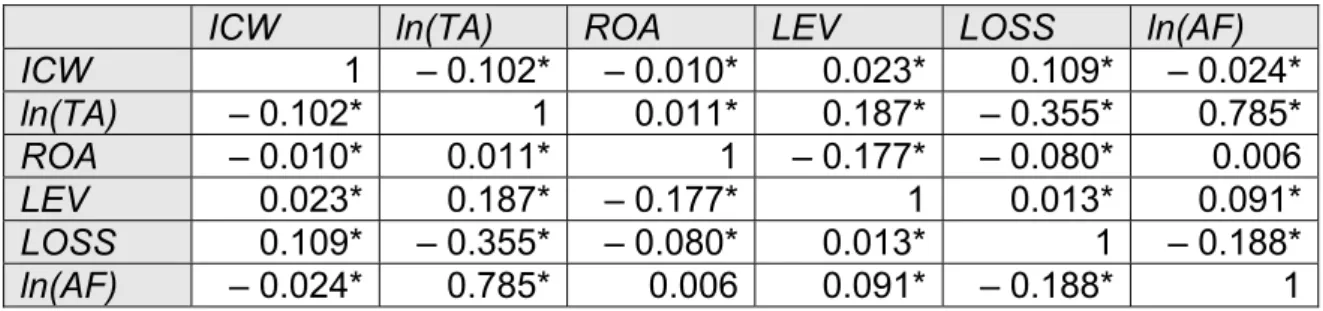
We will now look at Pearson’s product-moment correlations to examine the correla-tions between independent variables in the audit report lag model.
Table 4 Pearson Product-Moment Correlations of Independent Variables in the Audit Report Lag Model
ICW ln(TA) ROA LEV LOSS ln(AF)
ICW 1 – 0.102* – 0.010* 0.023* 0.109* – 0.024* ln(TA) – 0.102* 1 0.011* 0.187* – 0.355* 0.785* ROA – 0.010* 0.011* 1 – 0.177* – 0.080* 0.006 LEV 0.023* 0.187* – 0.177* 1 0.013* 0.091* LOSS 0.109* – 0.355* – 0.080* 0.013* 1 – 0.188* ln(AF) – 0.024* 0.785* 0.006 0.091* – 0.188* 1
In the table correlations that are statistically significant at the 0.05 level are marked with an asterisk. As seen from the table, the highest correlation is between the nat-ural logarithm of total assets and the natnat-ural logarithm of audit fees, and the corre-lation coefficient is 0.785. This correcorre-lation coefficient is high in comparison to the other correlation coefficients, but does it not necessarily mean that the correlation will cause issues for the regression analysis. To determine whether the correlation causes multicollinearity problems, further statistical tests are needed.
5.2 Methods
5.2.1 Multivariate Regression Analysis
Regression analysis is a statistical method that can be used to investigate whether there is a causal relationship between two or more variables. It is one of the oldest multivariable methods that is still in use and also one of the most commonly used method for modelling reality, specifically the relationship between a dependent var-iable and an independent varvar-iable or varvar-iables. However, only the development of computing capacity of the past few decades has enabled broader use of multivaria-ble methods such as multivariate regression analysis, which is the term for a regres-sion analysis involving more than one independent variable. The basic premise for multivariate regression analysis is that there is a correlation between the dependent variable and independent variables, but the independent variables do not neces-sarily correlate with each other. In fact, correlation between independent variables
34
might distort the results of the analysis. (Yan 2009: 1; Metsämuuronen 2005: 581, 658-659)
The goal of multivariate regression analysis is to find a model for the relationship between the dependent variable and the independent variables. Regression analy-sis can be utilised to search for independent variables that best explain the changes in the dependent variable. It can also be used to examine the extent to which inde-pendent variables, known to be significant determinants of the deinde-pendent variable from previous research, have an effect on the dependent variable. For the purposes of this study, we use regression analysis for the latter objective. (Metsämuuronen 2005: 660-661)
The regression analysis usually follows a list of procedures. Firstly, and most im-portantly, it is necessary to carefully determine whether the hypothesis under inves-tigation can be studied using regression analysis. Secondly, the regression model is defined, based on prior research. The generalised model for regression analysis is
⋯ ,
where y is the dependent variable, and ⋯ are the independent
varia-bles, and is the random error, which can also be referred to as the residual. In this phase, the selection of appropriate variables is made. Thirdly, the data for the anal-ysis is collected and processed so that it can be used in the analanal-ysis. Fourthly, the regression analysis is conducted – generally in the case of multivariate regression analysis this is done with the aid of statistical software. Fifthly, the selected model is carefully evaluated with various diagnosis methods to determine whether the model is sound and the assumptions of the regression analysis are met. (Metsämuuronen 2005: 659-660, 663; Yan 2009: 5)
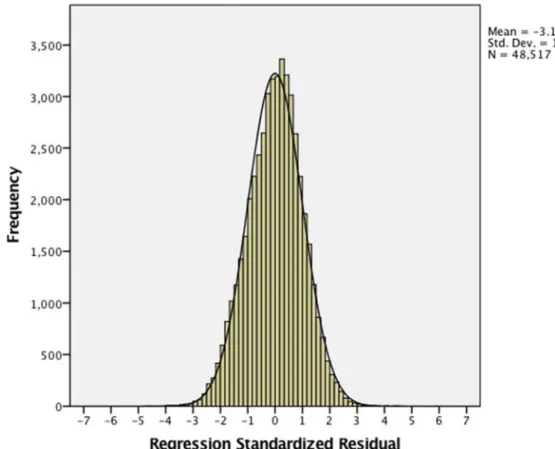
The essential underlying assumptions of the regression analysis model are normal-ity and homoscedasticnormal-ity. The model depends on the premise that the residuals – the part of the model which the independent variables fail to account for – follow a normal distribution and that their dispersion is homoscedastic. Another assumption