Munich Personal RePEc Archive
The Disparity of Revenue and
Expenditure among Subnational
Governments in Vietnam
Vo, Duc
Ho Chi Minh City Open University, Vietnam
3 July 2019
Online at
https://mpra.ub.uni-muenchen.de/103277/
THE DISPARITY OF REVENUE AND EXPENDITURE
AMONG SUBNATIONAL GOVERNMENTS IN VIETNAM
Abstract
Fiscal decentralisation has attracted attention from government, academic studies, and international institutions with the aims of enhancing economic growth in recent years. One of the difficult issues is to measure satisfactorily the degree of fiscal decentralisation across countries. Vo (2010) developed the fiscal decentralisation index, the first of its kind, which accounts for both fiscal autonomy and fiscal importance of subnational governments. We
argue that while Vo’s index is an advance on current practice, it is still not perfect as it assumes there is no dispersion of revenue and expenditure across regions. In response to this weakness, fiscal entropy and fiscal inequality measures are developed using information theory (Theil, 1967). It is shown how fiscal inequality can be decomposed regionally and hierarchically. These ideas are illustrated with an emerging country data -Vietnam - pertaining to the national, provincial and local levels of governments.
Key words: Autonomy; Fiscal Decentralisation Index; Theil’s entropy; Vietnam
JEL Classification Numbers: H77
1. Introduction
The term “fiscal decentralisation” refers to the devolution of authority for public finances and the delivery of government services from the national to subnational levels (Tanzi, 1996). This devolution is related to the four main interrelationships among levels of government regarding fiscal issues, viz., the responsibility for (i) expenditure decisions; (ii) taxing and revenue-raising powers; (iii) subnational borrowings; and (iv) intergovernmental fiscal transfers. Fiscal decentralisation is currently an issue of considerable practical importance facing many developing economies and has been advocated by international economic bodies, such as the World Bank and the Organisation for Economic Cooperation and Development (World Bank, 2003). Moreover, the academic study of fiscal decentralisation is a field of vigorous research activity and a number of attempts have been made to systematically understand the key economic principles of this area (see, e.g., Bird, 2004; Boadway, 2003; Collins, 2001; McLure, 1998).
In recent decades, fiscal decentralisation has become a central concern in countries around the world, especially in developing nations such as Argentina, Bolvia, Brazil, Colombia, Ethiopia, India, Mexico, and Nigeria; and countries in transition such as Bulgaria, China, Hungary, and Russian Federation (IMF, 1997; Bird, 1993). Fiscal arrangements among levels of government have been reformed in a manner that increases the extent to which SNGs are assigned more expenditure and revenue-raising responsibilities. There is, however, a lack of a widely-accepted tool to measure the degree of fiscal decentralisation across countries.
To date, measurement of fiscal decentralisation in studies of public finances has been very crude. Typically, either revenue or expenditure from subnational governments
(“SNGs”) has been employed without taking into account the fiscal autonomy of lower level governments. For example, in his pioneering study, Oates (1972) used the national government share in total public revenue as the degree of fiscal centralisation. Woller and Phillips (1998) measured fiscal decentralisation in four different ways such as the ratio of local government revenues to total government revenues or the ratio of local government revenues less grants-in-aid to total government revenues, for example. Similarly, Davoodi and Zou (1998) measured the level of fiscal decentralisation as the spending by SNGs as a fraction of total government spending. It is widely accepted that measurement of fiscal decentralisation in previous works has been undertaken on a superficial basis. There has
been no recognition of the important distinction between subnational “revenue” and own
sourced revenue over which subnational jurisdictions have policy autonomy. Many previous attempts to measure the degree of fiscal decentralisation involve the use of some form of share of revenue/expenditure at lower-level jurisdictions in the national total.
Martinez-Vazquez et. al. (2016) argued that one crucial and yet unsolved issues in the empirical literature on decentralization is the proper measurement of decentralization itself. In one of the most recent papers on measuring fiscal decentralisation, Liu et al. (2017) measured the degree of fiscal decentralization in the Chinese provinces by simultaneously considering expenditure decentralization and revenue decentralization. The authors argued
that of these two indicators, expenditure decentralization, defined as the local share of total government expenditure has been widely used in previous empirical studies.
In his innovative approach, Vo (2009, 2010) developed the fiscal decentralisation index, the first of its kind, by considering two fundamental issues of fiscal federalism: (i) fiscal autonomy; and (ii) fiscal importance of subnational governments. We argue that
while Vo’s index is an advance on current practice, it is the claim of this paper that such an approach is inadequate as it completely ignores important distributional aspects of fiscal arrangements. Consider two hypothetical economies, A and B. In both economies, government spending and revenue at the national level accounts for 50 percent of the total, so that the remaining 50 percent is the responsibility of subnational government. The difference is that in A there are only two large subnational institutions that have an equal share of the total 50 percent; while in B there are 100 subnational units, each accounting for 1 percent of the 50 percent total. It is clear that there is substantially more fiscal decentralisation in B as compared to A. However, an exclusive focus of the split of the total between the national and subnational levels would lead one to erroneously conclude that both economies exhibit the same degree of fiscal decentralisation. In other words, both the first and second moments of the distribution of revenue/expenditure are important for understanding the workings of fiscal arrangements. In this paper, we develop measures of the dispersion of revenue and expenditure using ideas from information theory.
2. Fiscal autonomy and Fiscal importance of subnational governments
2.1 Fiscal autonomy of subnational governments
Agreement on the distribution of taxing powers is difficult since the public-sector players (national government and SNGs) approach their respective powers from two different perspectives. While the national government continues keeping important tax sources for economic stabilisation and income redistribution, SNGs typically focus on taxing powers to generate revenue to fund their provision of services which are fundamental to community welfare such as healthcare, education and public order. When the assignment of tax bases across levels of governments is extensive, the gap between
spending responsibility and taxing power of SNGs will be minimal, leading to a high degree of fiscal autonomy of SNGs. Fiscal autonomy of SNGs implies that, to some extent, SNGs can arrange their own sourced revenue by exercising their taxing powers to cover costs occurring in the provision of public goods and services. In such circumstances, intergovernmental fiscal transfers will not represent a significant source of revenue for SNGs. It should be noted that, however, even in the absence of fiscal transfers (“grants”), SNGs will not enjoy full fiscal autonomy if they receive taxes or shares from revenue bases directly controlled and defined by the national government (McLure, 2001). The necessary condition for a significant level of fiscal autonomy is that SNGs themselves have the discretion to set the tax rates and/ or bases (so that they can adjust their revenue by varying the rates and/ or the bases) in response to fiscal demand for publicly provided services. If this is not the case, flexibility and the potential for creativity by SNGs for the efficient provision of public goods and services are limited.
In the event of a long-period mismatch between SNGs’ spending responsibility and revenue capacity, vertical fiscal imbalance will inevitably emerge and must be managed by the national government through intergovernmental fiscal grants and advances. If SNGs are given adequate fiscal autonomy, ex-post vertical fiscal imbalance is expected to be minimised before any fiscal transfer takes place. However, it is also argued that if the national government focuses exclusively on filling the gap of vertical fiscal issues, this decision may reduce the incentive for the SNGs to increase their respective taxing powers and to manage public spending efficiently (Ahmad and Craig, 1997). One option for reducing the vertical fiscal imbalance without reform of tax assignment is to re-assign some spending responsibility for goods and services provision from SNGs to the national
government. However, experience suggests that mismatch between spending and taxing will also provide some balancing role for the national government in fiscal transfers (Bird and Smart, 2002).
Fiscal autonomy of SNGs is fundamental and important feature of fiscal decentralisation. However, fiscal autonomy is only one aspect of fiscal decentralisation, which also depends on the proportion of national fiscal activity undertaken by SNGs, or
their “fiscal importance”.
2.2 Fiscal importance of subnational governments
The principle of subsidiarity suggests that economic performances of the governments will be more responsive to consumer demands and to cost cutting pressures (i.e. more efficient) if services are provided by the lowest level of government possible. While foreign policy, defence, immigration, and international trade can be best formulated and implemented by the national government, SNGs are able to carry out some important tasks for regional and local communities such as law, order and public safety, education, health policy, as well as very local issues such as street lighting system, local sewerage, garbage collection, and local paper deliveries, etc. Services provided by the national government are consistent with the law of subsidiarity when demand is at a constant level across various subnational localities. However, when demand varies from location to location, national provision to the common standard leads to inefficient under-provision, in some areas, and inefficient over-provision, in other areas. In short, services provided by the national government assume tastes and preferences to be homogeneous across locations and for citizens within locations.
SNGs operate closely to local inhabitants so that they are the sole agents, who are in the best position to understand preferences, tastes and amount demanded. It is clear that levels of goods and services provided should not exceed the amount demanded by the community. This can avoid both under or overprovision of public goods and services.
Moreover, a system of fees, users’ charges can be considered useful and effective for the purpose of cost recovery (McLure and Martinez-Vazquez, 2004). The larger the portion of the total public spending cake attributable to SNGs, the higher the degree of fiscal importance and the more likely it is that the benefits from the law of subsidiarity will be realised.
2.5 Potential weaknesses of the Vo (2010)’s fiscal decentralisation index
Any form of the currently available fiscal decentralisation index has two potentially significant limitations. Firstly, revenue and expenditure in each SNG are implicitly assumed to be equal. In effect, all regions are assumed to be a homogeneous fiscal mass. However, SNGs typically involve large differences in revenue and spending -- differences that could have significant implications for fiscal decentralisation. Secondly, the structure of the fiscal constitution is ignored. Subnational governments are not differentiated by type
– state governments are not distinguished from local governments. These structural changes may also impact on fiscal decentralisation. For example, local councils have different distributions of revenue and spending within the same state. Furthermore, population, revenue, and expenditure across states are also different.
A fiscal decentralisation index accounts only for the fundamental influences of the fiscal autonomy and fiscal importance of subnational governments while ignoring the impact of fiscal differences between them, it can only be considered as a “first
approximation”. To redress these shortcomings, the fiscal decentralisation index will be extended by using information theory as developed by Theil (1967). The main goals of the extensions of the first approximation index are to account for the distributions of revenue and expenditure shares of all governments (including local governments) between the state jurisdictions (in the second approximation) and the distribution of revenue and expenditure shares of all governments within a state jurisdiction (in the third approximation). The concepts of “between-set entropy” and “within-set entropy” appear to have the potential to account for heterogeneity in fiscal shares across different levels of governments.
3. Vietnam and fiscal decentralisation
The choice of Vietnam is for convenience because we can investigate and collect data at 3 levels of government: central; provincial and district levels of government using local data sources which are only available in Vietnamese. These types of data are generally not available from the international data sources such as the IMF, the World Bank, or the ADB. In addition, we firmly believe that countries with significant difference of revenue raising capacities such as Vietnam can be effectively used for the analysis using this framework as an illustration on how disparity of revenue and expenditure at subnational levels including provincial and district levels can significantly affect the degree of fiscal decentralisation of the country.
Policy measures to increase fiscal decentralisation in Vietnam were being set in place from the mid 1990s, especially through the introduction of the Budget Laws of 1997, 1999, 2004 and 2014. The specific changes in the tax assignment and tax allocation across the national government and SNGs that have increased fiscal decentralisation since 1990 are observed in the revisions of the budget laws.
In Vietnam, exclusively national government taxes include export–import duties and excise tax. The shared taxes between the national government and SNGs consist of the value added tax; corporate income tax; and personal income tax. Many minor taxes are
allocated as SNGs’ own-sourced taxes such as tax on transfers of properties, licence tax, agricultural tax, land and housing tax, and tax on land use rights. Importantly though, regardless of whether a tax is a national tax or shared tax, the tax bases and rates are centrally determined. In view of this, it is evident that the assignment and allocation of taxes in Vietnam since 1990, has dealt primarily with the issue of the “fiscal importance” of SNGs – that is, with the share of total public sector expenditure undertaken by SNGs.
Personal income tax - a shared tax after the introduction of the 1997’s Budget law is something of a special case in Vietnam. International experience has shown that personal income tax usually generates a significant share of total taxation revenue in many countries. However, this is not the case in Vietnam. Maintaining the personal income tax as a shared tax may well be seen by the national government as prudent, particularly if Vietnam needs to implement any requirements imposed by the World Bank on debt management and from the World Trade Organisation.
Shared taxes between the national government and SNGs provide an interesting example of the mechanism by which the fiscal importance of SNGs increases over time. With a well-endowed region with the expected revenue that is greater than its minimum expenditure need, revenue from shared taxes must be transferred to the national budget at the rate to be centrally determined, whereas less well endowed provinces receive all 100 percent of shared tax revenue.
Like other developing countries, Vietnam suffers from the fiscal imbalance in both vertical and horizontal dimensions. The country has an implicit system of equalisation grants, although it is very partial in character. A partial and unsystematic form of fiscal equalisation applies in Vietnam on the basis of the difference between the expected revenue and the minimum expenditure need of SNGs. Expected revenues for a SNG are determined by: (i) the subnational branch of tax administration, on the basis of the actual revenue collections of the previous years, taking into account changes in tax policies in the year and (ii) expected economic growth rate during the year. The minimum expenditure needs of SNGs are calculated on the basis of the expenditure norms determined by the national government (Martinez-Vazquez, 2004, p.26). The difference between expected revenue and minimum expected expenditure need have laid the foundation for the national government to decide the tax sharing rates which are applied to revenue from the shared taxes between national government and SNGs. If the expected revenue (revenue from both own-sourced and shared taxes) is less than its minimum expenditure need, then all proceeds from shared taxes are kept at subnational budget.
Under this arrangement, fiscal transfers are partially achieved through shared tax revenue arrangements. The major proportion of any remaining intergovernmental fiscal transfers in Vietnam is in the form of conditional transfers in which SNGs have to follow national requirements on how these funds are expended. As a result, fiscal autonomy of SNGs on fiscal transfers is also very limited. This conclusion is also accurate on SNGs borrowings because SNGs are not generally allowed to arrange borrowings at their own discretion.
In his influential study, Theil (1967) advocated the use of entropy-based measure for the analysis of income inequality. In this section, we apply Theil’s notion of the entropy to public finance in multi-tiered governments. The analysis that follows is devoted to the
development of an analytical framework which reveals SNGs’ fiscal inequality in term of revenue shares among SNGs. The same framework can be directly applied to the expenditure shares among SNGs. The notion of fiscal inequality (or fiscal dispersion) is important for fiscal theory on decentralisation because it accounts for the heterogeneity of various subnational units in terms of revenue and expenditure shares. However, it should be emphasised that fiscal inequality and fiscal equalisation are two distinct concepts, in that fiscal equalisation is not designed to redress the notion of fiscal inequality in this chapter.
Specifically, the concept of fiscal inequality relies on “money” (such as revenue and
expenditure of subnational governments) as the unit of comparison, whereas the fiscal equalisation process (such as that adopted in Australia) is concerned with equalising the
capacity of SNGs to provide the same “real” level of service.
It is assumed that a country has Q states (the second level of governments) and P local councils (the third level of governments) and each local council belongs to one state. Then N = +P Q is the total number of local and state governments, the number of subnational governments (SNGs). Each SNG accounts for a non-negative fraction of total subnational revenue, to be denoted by ri which for short we shall refer to as the “regional
revenue share”. The sum of these all revenue shares is equal to unity:
1 1, 0 1,..., .
N
i i
i= r = r =i N
Let r denote the vector of the revenue shares1,.., N r r . The entropy of the revenue shares is defined as:
(4.1) 1 1 ( ) log . N i i i H r r = =
rThe entropy H( )r can be regarded as the measure of the equality with which revenue is
distributed among the SNGs. When the revenue distribution is extremely equal in that each SNG has the same revenue share (i.e., ri =1 N) and the entropy is at its maximum:
( )
log .H r = N At the other extreme, if one SNG accounts for all revenue so that others
have no revenue (i.e., ri=1 and rj =0 for i j), the minimum value of the entropy is
achieved: H
( )
r =0. As a result, the range of the entropy is 0H( )
r log .NIn the context of the distribution of revenue, it is more convenient to focus on revenue inequality, rather than revenue equality. Revenue inequality can be measured by deducting the entropy H( )r from its maximum value, logN:
(4.2)
1 1
1
log ( ) log log log .
N N i i i i i i N H N r r Nr r = = − r = −
=
Due to the constraints on the range of the entropy H
( )
r , it is clear that the range of thismeasure of revenue inequality is 0 -- perfect equality (when H
( )
r =logN) -- and logN-- maximum inequality (when H
( )
r =0).It is assumed that there are G sets of SNGs, to be denoted by S1,..,SG, and each
SNG belongs to one and only one set. Let Ngbe a number of SNGs in set Sg, with
1 .
G g g= N =N
The entropy of revenue shares, equation (3.1), then can be expressed as:(4.3) 1 1 ( ) log , g G i g i i H r r = =
S rwhere the component inside the square brackets is the entropy of revenue shares within set
.
g
S Let Rg be the sum of revenue shares of all SNGs in set Sg, ;
g i g i
R =
S r this Rg isthe revenue share of group g with
1 1.
G g g= R =
The entropy of revenue shares within setg
S can be expressed as:
1 1 1 log log 1 1 log log . g g g i i g i i i g i g g i g g i g i g g r r R r R r R R r R R R r R R = = +
S S SThus, if we define
( )
log 1 ,g i g g i g i g r H R r R =
Sr where rg is the vector of
i
r that fall under
,
g
S as the within-set entropy, we have:
(4.4) log1
( )
log 1 . g i g g g g i i g r R H R r R = +
S rCombining equations (4.3) and (4.4), the total entropy becomes:
(4.5)
( )
1 1 1 ( ) log . G G g g g g g g g H R H R R = = =
+
r rOn the right-hand side of this equation, the first component is a weighted average of the within-set entropies H1
( )
r1 ,...,HG( )
rG , with the group revenue shares1,..., G
R R as the
weights. The second term on the right of equation (4.5) is the between-set entropy,
( )
1 log 1 . G g g g= R R
In the above, we decomposed revenue equality into within-set and between-set terms. We now show that revenue inequality can be similarly decomposed.
Recall from equation (4.5) that the entropy is decomposed into two distinct components: a weighted average of the within-set entropy and the between-set entropy. Furthermore, as in (4.2), inequality is measured by the difference between the maximum value of the entropy, logN and the entropy H( ).r Thus, by combining equations (4.2) and
(4.5), revenue inequality can be expressed as: (4.6)
1 1
1
log ( ) log ( ) log .
G G g g g g g g g N H N R H R R = = − r = −
r −
The right-hand side of equation (3.6) remains unchanged if we subtract and add
1 log ,
G
g g g= R N
where Rg and Ng are the revenue share of and a number of SNGs in set, g S respectively:
(
)
1 1 1 1log ( ) log ( ) log log
1
log log log .
g G G g g g g g g g g g G G g i g g g g i g i g g g N N H R N H N R R R r R N R R r R N N = = = = − = − + − = − +
S r rAs the result, revenue inequality can be expressed as follows:
(4.7)
1 1
log ( ) log log .
1 g G G i g g i g g g i g g g g r R R r N H R R R N N N = = − = +
S rResult (4.7) reveals that revenue inequality consists of two distinct components: (i) a weighted average of within-set inequalities and (ii) a between-set inequality.
4.1 The within-set inequalities
The first component of (4.7) is a weighted average of the within-set inequalities:
(4.8) 1 log . 1 g G i g i g g i g g r R r R R N =
SThe term r Ri g is the conditional revenue share of SNG i within group Sg, that is, SNG
i’s revenue share within the group. Also, Ng represents a number of SNGs in group Sg.
Equation (4.8) comprises two weighted averages: (a) log ,
1 g i g i g i g g r R r Z R N =
S thewithin-set revenue inequality for group Sg, and (b)
1 ,
G g g g= R Z
the weighted average of thewithin-set revenue inequalities.
4.2 The between-set inequality
The second term on the right-hand side of (4.7) is the between-set inequality:
(4.9) 1 log . G g g g g R R N N =
The basic ingredient of inequality (4.5) is the contrast between two sets of shares, the revenue shares of the G groups, R1,...,RG and the corresponding population shares,
1 ,..., G .
N N N N If all groups receive their pro-rata shares of revenue based on population,
i.e. Rg =Ng N, g=1,...,G, then there is no dispersion of revenue distribution and we
have perfect between-set revenue equality.
5. An application of the subnational fiscal disparity framework in Vietnam
To illustrate the workings and interpretations of the various measures of fiscal decentralisation, in this section, we provide some numerical examples.
It is assumed that SNGs’ own-sourced revenue, subnational expenditure, and national government expenditure (excluding fiscal transfers to SNGs) are $293, $412, and $412 million, respectively, so that total public sector expenditure is $412 + $412 = $824 million
An incomplete measure of fiscal decentralisation focusing revenue side indicates that the degree of fiscal decentralisation, being the ratio of SNGs’ own-sourced revenue to
SNGs’ expenditure of country V is 293 412=0.71, whereas another incomplete measure indicates that the degree can be measured as the ratio between SNGs’ expenditure and total public sector expenditure, which is 412 824=0.5. Other combinations are also possible. Vo (2010) argued that the degree of fiscal decentralisation for country V should be the
geometric mean of fiscal autonomy and fiscal importance, which is
0.71 0.50 0.6,
FDI = = as indicated by both measures.
In this paper, we consider that even Vo (2010)’s approach to measuring fiscal decentralisation is an advance on current practice, it is still not perfect as it assumes there is no dispersion of revenue and expenditure across regions. We also argue that the best approach to take into account fiscal dispersion across subnational governments is to utility Theil’s entropy rather than any conventional measure of dispersion. The following example illustrates this point.
Table 1 provides fiscal data on the different distributions of revenue among SNGs in countries V and L for the purpose of measuring fiscal dispersion of revenue shares. It is assumed that countries V and L consist of four subnational regions: A, B, C and D, each with different level of revenue. Column 2 shows that there is one small region in country V, region A. Revenue from region B is almost double that of D and forty times higher than that of region A. Columns 3 and 4 present the actual and average revenue shares for 4 regions in country V. By contrast, in country L, there are one large and three small regions. In country L, region B accounts for more than 92 percent of the total revenue of all regions, and the remaining 8 percent is spread across the three small regions A, C, and D.
TABLE 2
REGIONAL FISCAL ARRANGEMENTS
Region
Country V Country L
Revenue Share in total (percent) Revenue Share in total (percent)
($ millions) Actual Average Difference ($ millions) Actual Average Difference
(1) (2) (3) (4) (5) = (4) – (3) (6) (7) (8) (9) = (8) – (7) A 3 1 25 24 3 1 25 24 B 125 43 25 -18 271 92 25 -67 C 97 33 25 -8 11 4 25 21 D 68 23 25 2 8 3 25 22 Total 293 100 100 0 293 100 100 0 TABLE 3
MEASURING FISCAL INEQUALITY
Dispersion of shares Country V Country L
1. Standard deviation 0.18 0.45
2. Fiscal inequality 0.12 0.46
Row 1 of Table 3 presents the standard deviation of the revenue shares in the two countries. As the standard deviation in country V is less than one-half that in country L, there is clear less dispersion, or less inequality of the distribution of fiscal revenue across subnational government units in country V. Our measure of fiscal inequality is
(
log log1)
,N
i i
example. Thus as an approximate, we can say that fiscal inequality is about 12 percent in country V and 46 percent in country L.
We now turn to the application of this new framework into the Vietnamese context using its fiscal data across provinces and districts.
Table 4 presents the fiscal inequalities across subnational regions in Vietnam in 2015. The samples include 61 provinces and metropolises in Vietnam except for Binh Phuoc, and Ha Tinh provinces due to the unavailability of data. It is clear that within-province fiscal inequality accounts for 81.6 per cent and 93.6 per cent total inequality in terms of revenue and expenditure, respectively. This implies that the within-province fiscal inequality plays a more important role in total inequality of the distribution of revenue and expenditure across subnational regions in Vietnam. This is partly because each subnational region includes both provincial and local governments, and the provincial government is significantly larger than any local government within the same region. For example, for Ho Chi Minh City, the total share Rg = 14.1 per cent in 2013, the state government accounts for 9.9 per
centleaving only 4.2 per cent to be divided among the 24 local governments (districts) in Ho Chi Minh City. Another implication from the fiscal inequalities is that it is a more equality in an allocation of expenditure across subnational regions rather than that of revenue. This shows the authority’s efforts to provide citizens a better public goods and services equally.
TABLE 4
GEOGRAPHIC ALLOCATION OF
FISCAL INEQUALITIES ACROSS SUBNATIONAL REGIONS VIETNAM, 2015
Inequality measure Revenue Expenditure
Total inequality 0.762 0.625
Between-set inequality 0.140 0.039
Within-set inequality (WSI) 0.621 0.586
WSI as the percentage of total inequality 81.6 93.8
Source: Authors’ analysis using data from Vietnam’s Ministry of Finance
Figure 1 shows a representative sample of within-set inequality across regions in Vietnam in terms of revenue and expenditure. It is apparent that Ha Noi City and Ho Chi Minh City, the two largest metropolises in Vietnam, have far higher values as compared to
other provinces. Other provinces including Ba Ria – Vung Tau, Da Nang, Dong Nai, Nghe
An, Quang Nam, Quang Ninh, Thanh Hoa, Vinh Phuc belong to the group of a relatively high within-set inequality. On the contrary, provinces such as Bac Kan, Dak Nong, Dien Bien Phu, Ha Nam, Hau Giang, Kon Tum, Ninh Thuan, Tuyen Quang belong to the group of a relatively low within-group inequality.
FIGURE 1:
WITHIN-SET INEQUALITY, ACROSS PROVINCES AND METROPOLISES VIETNAM, 2015
Source: Authors’ analysis using data from Vietnam’s Ministry of Finance
Total inequality can also be disaggregated in a hierarchical manner in which the two sets to be considered are: (i) the upper-level SNGs, the set consisting of the sixty-one
provinces and metropolises (cities under direct management of the national government); and (ii) the lower-level SNGs, the 678 local councils. Table 5 below presents the results when fiscal inequality is decomposed in this way. The results show that when local councils and states are completely isolated in this way, the between-set inequality is much larger than the within-set inequality. The between-set inequality between the states and local councils accounts for about 63.9 per cent of revenue inequality and 84.8 per cent of expenditure inequality.
TABLE 5
HIERARCHICAL ALLOCATION OF FISCAL INEQUALITIES ACROSS LEVELS OF GOVERNMENTS, VIETNAM, 2015
Inequality measure Revenue Expenditure
Total inequality 0.762 0.625
Between-set inequality (BSE) 0.487 0.530
Within-set inequality 0.275 0.095
Inequality within:
States governments 0.165 0.079
Governments of local councils 0.110 0.016
BSE as the percentage of total inequality 63.9 84.8
Source: Authors’ analysis using data from Vietnam’s Ministry of Finance
6. Concluding remarks
Economic aspect of fiscal decentralisation has recently attracted a noticeable increase in attention from academics and international institutions such as the World Bank. The question has been raised how fiscal decentralisation across countries can be measured. The main contribution of this paper is the analysis on the composition of fiscal inequality. Fiscal inequality can be decomposed into between-set and within-set components.
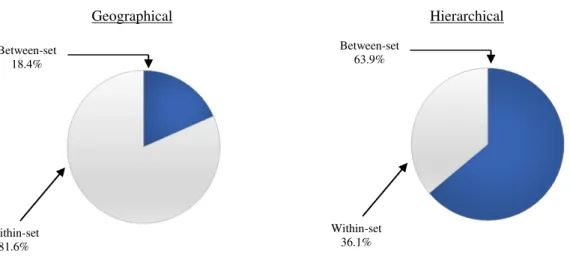
Figure 2 presents a summary of the results of fiscal inequality in Vietnam by component. The results reveal that within-set inequality plays a significant role when the set is defined on a geographic basis. The insignificance of the between-set inequality for regions can be partly explained by the application of fiscal equalisation in Vietnam whereby the national government allocates tax revenue among the provinces in a manner that gives the provinces equal capacity to provide a standard level of service provided their revenue raising (i.e. tax and royalty) is the same. Another reason for the dominance of the regional within-set component is that each region contains provincial and local governments; and in most cases, the provincial government is substantially larger than local governments. By contrast, when groups are defined hierarchically, the between-set inequality accounts for about 63.9 per cent of the total inequality. This result reflects the fact that provincial governments account for a significant share in total revenue or expenditure of subnational governments.
FIGURE 2
FISCAL INEQUALITY BY COMPONENT, VIETNAM, 2013
Geographical Hierarchical Between-set 63.9% Within-set 36.1% Between-set 18.4% Within-set 81.6%
Some policy implications have emerged on the ground of the findings from this study. Subnational governments in Vietnam are clearly in a very weak position because: (i) the national government sets tax bases and tax rates; (ii) tax administration is nationally centralised; and (iii) there is a heavy interference on subnational spending programs from the national government. That is, under current arrangements, the fiscal autonomy of SNGs in Vietnam is very limited, and reform should be aimed at redressing this. A mechanism for devolving more responsibility from the national to subnational governments would be highly desirable.
Other factors that could be complementary to constitutional change in affecting an increase in fiscal decentralisation include: (i) a relatively greater emphasis by SNGs on fees and charges for services compared to “general taxation” (as the former would generally be at the discretion of SNGs, while the latter would generally be largely directed by the national government); (ii) reduced emphasis on “shared” taxes; and (iii) a (constitutionally mandated) reduction in the portion of fiscal transfers from the national government to SNGs made in the form of conditional transfers (i.e. tied grants).
Decomposition of total inequality into between-set and within-set inequalities is one of many different techniques of decomposition. Especially in the research area of income inequality where various decomposition techniques are used. As such, further studies may need to consider different techniques of decomposition to ensure the robustness of the findings.
REFERENCES
Ahmad, E. and Craig, J. (1997). “Intergovernmental transfers.” In Ter-Minassian, T (eds)
Fiscal federalism in theory and practice, International Monetary Fund, Washington D.C.
Bird, R.M. and Smart, M. (2002). “Intergovernmental fiscal transfers: International lessons
for developing countries.” University of Toronto, Canada.
Davoodi, H. and Zou, Heng-fu (1998). “Fiscal decentralization and economic growth: A cross-country study.” Journal of Urban Economics 43: 244-257.
Liu, Y.; Martinez, J; and Wu, A. (2017). “Fiscal decentralization, equalization, and
intra-provincial inequality in China”. International Tax Public Finance (2017) 24:248–281
Martinez-Vazquez, J; Lago-Pe˜nas, S.; Sacchi, A. (2016). “The impact of fiscal
decentralisation: A survey”. Journal of Economic Surveys 31, No. 4, pp. 1095–1129
McLure, C. and Martinez-Vazquez, J. (2004). “The assignment of revenues and
expenditures in intergovernmental fiscal relations.” The World Bank.
McLure, Jr.E.C. (2001), “The tax assignment problem: Conceptual and administrative considerations in achieving subnational fiscal autonomy.” Document prepared for Fiscal
Policy Training Program 2001, The World Bank Institute,Washington DC.
Musgrave, R.A. (1959). The theory of public finance – A study in public economy, McGraw Hill Book Company, Inc., New York.
Oates, W.E. (1972). Fiscal Federalism, Harcourt Brace Jovanovich, Inc., New York. Shah, A. (2004). “Expenditure assignment in Intergovernmental Fiscal Relations and Local
Financial Management Program.” The World Bank, Washington D.C.
Theil, Henri (1967). Economics and information theory, North-Holland Publishing
Company, Amsterdam.
Tiebout, C.M. (1956). “A pure theory of local expenditures.” Journal of Political Economy
64: 416-424.
Vo, Hong Duc (2009). “Fiscal decentralisation in Vietnam: lessons from selected Asian nations” Journal of the Asia Pacific Economy, Volume 14, Issue 4, pp. 399–419.
Vo, Hong Duc (2010). “The Economics of Fiscal decentralisation” Journal of Economic Surveys, Volume 24, Issue 4, September 2010, pp. 657–679.
Woller, G.M. and Phillips, K. (1998). “Fiscal decentralization and LDC economic growth: An empirical investigation.” Journal of Development Studies 34 (4): 139-148.