Medical Malpractice Damage Caps and the Price of Medical Procedures
Andrew I. Friedsona a
University of Colorado Denver Campus Box 181
P.O. Box 173364 Denver, CO 80217-3364
(518) 598 – 4430 Andrew.Friedson@gmail.com
This Version: March 14, 2012
Abstract:
A common legislative response to high medical malpractice insurance premiums is to reform the tort system by implementing caps on non-economic damages awardable in medical malpractice cases. I use the implementation of caps in several states, and a panel of private insurance claims to identify the effect of damage caps on the amount physicians charge to insurance companies and the amount that insurance companies reimburse physicians for medical services. In most cases the amount physicians charge insurers does not change, but the amount that insurers
reimburse physicians decreases. I estimate reimbursement reductions as large as 14.5 percent for specific procedures.
JEL Codes: H8, I18, K13
Acknowledgement:
Research for this article used healthcare charge data resources compiled and maintained by FAIR Health, Inc. The author is solely responsible for the research and conclusions reflected in this article. FAIR Health, Inc. is not responsible for the research conducted, nor for the opinions expressed, in this article.
2 1. Introduction
The costs of the entire medical malpractice system are estimated to be around $55.6 billion in 2008 dollars (Mello et al 2010), a relatively small number when compared to all U.S. health care costs. However, medical malpractice tort reform is a contentious issue that garners a lot of public attention and is continually placed at the forefront of many states’ legislative agendas. Since 2000, thirteen states have in some way changed their laws pertaining to medical malpractice liability. Most of these states enacted or modified a cap on non-economic damages awardable in medical malpractice tort cases.1 The argument for non-economic damage caps is that they decrease the malpractice risk on physicians, and as such should decrease malpractice insurance premiums. To the extent that this cost reduction is passed through to consumers, the price of health care should also be decreased by caps on damages.
It has been loosely established that increases in malpractice risk to physicians increase the market price of health services. Baicker and Chandra (2004) find a slight effect of
malpractice risk on the price of mammography, but no evidence of effects on the price of cesarean section (c-section) or angioplasty. Lakdawalla and Seabury’s 2009 study shows that per-bed-day hospital expenditures are responsive to jury awards in medical malpractice cases. The most general evidence is a study by Danzon, Pauly, and Kington (1990) that demonstrates a direct link between the risk of being sued for medical malpractice and the fees charged by
physicians.2 There has been no prior empirical work linking tort reforms such as damage caps to changes in prices. This study is the first to link the implementation of damage caps directly to changes in health care prices, and serves as new evidence on the relationship between the price of medical services and malpractice risk on physicians in general.
I use a large data set of health insurance claims to private insurers along with variation in the implementation of state malpractice tort laws to estimate the effect of non-economic damage caps on the amount physicians charge to insurance companies for specific procedures and the
1 31 states have some sort of cap on medical malpractice damages in place as of 2011. 2
The Danzon, Pauly and Kington study is limited by its use of repeated cross section data and a small number of cross sections.
3 amount that insurance companies agree to reimburse doctors for those procedures.3 I pay special attention to procedures in the field of Obstetrics and Gynecology (Ob-Gyn) because of its status as a high malpractice risk specialty.4 I also look at several procedures in other fields. My estimates of the effect of non-economic damage caps are obtained using two variants of a difference in differences method. The first variant uses within state variation to identify the effect of damage caps on the price of services. The second variant uses within metropolitan statistical area (MSA) variation, gaining identification from MSAs that straddle state borders.
Of particular interest are any differences between changes in the allowed amount (the price paid out by an insurance company) and changes in the amount that physicians bill insurance companies for the same procedures. Differences in these two values show whether physicians lowered the price they asked for in response to a cap on damages, or if insurance companies lowered the amount that they paid out. These estimated changes in tandem provide an intriguing look into how shocks in physician costs are translated into the market for physician services.
I find that damage caps have a sizable impact on the allowed amount of some, but not all services. Estimated reductions in the allowed amount in response to the implementation of damage caps are as large as 14.5 percent. I find much smaller and often no changes in the amount that physicians charge insurance companies. The greatest part of the price reduction occurs in urban areas, which is unsurprising as most procedures are performed in urban areas and as urban areas have more inelastic demand for medical services.
2. Background
2.1 Malpractice Liability and Physicians
Suits for medical malpractice are filed under a state’s tort law. An individual can bring a case against a physician that treated her by claiming that the physician acted negligently and that the negligence led to an adverse outcome. Three types of damages are awardable: economic damages for lost income and medical expenses, non-economic damages for pain and suffering,
3
Data Source: FAIR Health, Inc., an independent, New York nonprofit corporation.
4Phelps (2003) shows that physicians in the field of Obstetrics and Gynecology face a much higher ratio of
4 and on rare occasion punitive damages if it can be shown that the physician acted in a criminal manner.5 Because being sued is a rare event that is potentially quite costly, physicians are required to carry insurance against medical malpractice. Medical malpractice insurance is not experience rated on the individual level, and as such premiums for insurance are reflective of the risks inherent to all members of a physician’s specialty in their specific state.
Despite the presence of malpractice insurance, the risk of suit is still something that physicians will take great pains to reduce, as the experience of being sued is both time-consuming, stressful, and carries large additional costs if the physician hires his own lawyer. The literature has identified three margins of response by which doctors adjust their behavior in response to the risk of suit: doctors change how they practice, where they practice, and they try to pass on the cost of the risk to consumers.67 Though all these outcomes are of importance to understanding the effect malpractice risk and tort reform on the market, this study will focus primarily on the last of the three.
The literature on malpractice risk and the price of medical services is small, largely because comprehensive data on physician pricing, and more importantly in the modern market for health care the interaction between physicians and health insurance companies is difficult to come by. Baicker and Chandra (2004) find a slight effect of malpractice risk on the price of mammography, but no evidence of effects on the price of c-section or angioplasty. Also, the work by Lakdawalla and Seabury (2009) suggests that per-bed-day hospital expenditures are responsive to jury awards in medical malpractice cases. The most general evidence is in work by Danzon, Pauly, and Kington (1990). They use three survey cross sections to demonstrate a direct positive link between the risk of being sued for medical malpractice and the fees charged by physicians.
5
Unlike economic damages which measure lost wages, and punitive damages whose values are dictated by law, there is no clear standard for valuing economic damages. As such, there is the greatest variation in non-economic damages.
6
The literature on physician practice with regards to medical malpractice laws shows that physicians practice patterns are sensitive to the laws present. In the seminal work in this area Kessler and McClellan (1996) show that health expenditures on elderly heart patients are sensitive to certain laws but that their health outcomes are not. More recently, Currie and Macleod (2008) show that damage caps have a negative effect of birth outcomes whereas joint and several liability reforms improve birth outcomes.
7
The literature on physician location decisions with regards to medical malpractice laws shows that new, not well established physicians are sensitive to medical malpractice laws when choosing where to practice. This has been shown by Kessler, Sage and Becker (2005) as well as by Klick and Stratmann (2007) and more recently by Malani and Reif (2010).
5
2.2 Damage Caps and the Price of Medical Services
Though there has been no previous empirical work linking damage caps to price reductions for medical services, there is much theoretical evidence that would suggest that this would be the case. Danzon, Pauly, and Kington (1990) present some simple models in which the price of medical services is linked to the “generosity” of a legal system in a positive way (i.e. larger awards would cause higher prices). More recently, King (2010) develops a model in which the cost of malpractice insurance, which is tied to malpractice risk, is passed through in full to consumers.
Thaler and Sunstein (2008) suggest that malpractice liability should be thought of in a hedonic framework. Patients pay for medical services; which are a bundle of attributes that includes the right to sue for negligence. To the extent that the right to sue is curtailed their willingness to pay for medical services should decrease. Likewise doctors would be willing to charge less if they do not face as much malpractice risk – this could be viewed as either a shift in supply or as a compensating wage differential. The size of the shift in prices would depend on the relative elasticities of supply and demand, but would be unambiguous in direction: increases in the generosity of the tort system would increase prices, decreases would decrease prices.
Missing in the above models is the inclusion of private health insurers in the market. Observed prices in the marketplace are the result of bargaining between physicians and private health insurers. Thus, decreases in prices may be magnified if insurance companies have bargaining power.
To illustrate, consider a Cournot model of oligopoly as a representation of physicians in the marketplace.8 Physicians certainly are not monopolists, but at the same time do not face pure competition either. The markup in a Cournot model is,
1 D p mc m p Nη − = = − (1)
where m is the markup, N is the number of physicians in the market andηD is the price elasticity of demand. The markup is the percentage of the price that is over and above the marginal cost of
6 production. The markup is a surplus that physicians receive in a world without insurers, and is divided through bargaining with health insurance companies. Hence, the amount insurers reimburse physicians is marginal cost plus whatever percentage of the markup that physicians receive in bargaining. When insurance companies have more bargaining power, they receive a larger piece of the surplus. It should also be noted that markups are bigger in places with more inelastic demand, such as urban areas.9 This is seen easily, by taking the derivative of the markup with respect toηD.
2 1 D D m N η η ∂ = ∂ (2)
The result is positive, indicating that as ηD increases, or as demand becomes more inelastic, the markup increases.
There are two channels by which prices could decrease from a cap on noneconomic damages. First, the cap will decrease the cost of malpractice insurance and the risk of being sued, which will lower marginal cost and by construction, the price of care.10 The second channel is that insurers may gain bargaining power from the implementation of a cap. For example, doctors could no longer claim at the bargaining table that their cost of malpractice insurance is quite as high and that they need larger reimbursements for their practices survive.11
An increase in insurer bargaining power would result in greater price decreases in places with inelastic demand (cities) relative to those with more elastic demand (rural areas). Cities would have greater markups than rural areas, and thus an equivalent increase in insurer bargaining power in cities and rural areas would have a greater price decrease in urban areas simply because there is more surplus to be divided.
For the above mechanism to work it is necessary for caps on non-economic damages to curtail patients right to sue (which they do by definition), and for caps on non-economic damages
9 Urban areas have a much larger percentage of the population which has health insurance (Ormond, Zuckerman,
and Lhila 2000) which makes the demand for medical services more inelastic (Manning et al 1987).
10 Premiums for malpractice insurance scale with the size of the practice, so medical malpractice insurance
premiums are indeed a marginal cost.
11
An alternative way to conceptualize a loss of bargaining power for doctors is that when doctors’ costs decrease they may become willing to accept patients with plans which offer less generous reimbursement.
7 to lower the risk imposed on physicians. Sloan and Chepke (2008) provide a review of the literature on the effects of tort reforms on the legal system and malpractice insurance premiums. Though there is no evidence that damage caps decrease claim frequency significantly, it has been shown that damage caps do indeed decrease claim payments and malpractice insurance
premiums in a significant fashion.12 Therefore, the cost of malpractice risk to physicians should in some part be passed on to consumers.
3. Data
The data I use come from several sources. Price data comes from the Medical/Surgical module of FAIR Health database of private health insurance claims; tort law data was created by merging information from the McCullough, Campbell & Lane LLP records with the records of the American Tort Reform Association (ATRA). Additional time varying state level
characteristics come from the Health Resources and Services Administration’s (HRSA) Area Resource File (ARF). These data sources were combined to create several data sets spanning the years 2003 to 2007.
The Medical/Surgical module of the FAIR Health database reports private health insurance claims. The complete module accounts for roughly 28 percent of the total number of private insurer claims in the United States in a given year. Within a claim, individual procedure types can be identified by line item via the American Medical Association’s Current Procedure Terminology codes. Each claim’s date is known, and they can be matched to states and MSAs via three digit zip codes. The three digit zip codes are flagged as urban or rural based on Census Bureau definitions.13 The FAIR Health database is very large, containing several billion
observations in totality.
For analysis I use data on eight procedures that vary in their risk. The first four
procedures are all commonly performed by Ob-Gyns: c-sections, vaginal deliveries, transvaginal ultrasounds on non-pregnant women, and abdominal ultrasounds on women in the first trimester
12Damage caps and early offer reforms have also been shown to decrease the amount that plaintiffs ask for by
Hyman et al (2009), as well as by Friedson and Kniesner (2011).
13
Each zip code is flagged by the Census Bureau as either urban or rural based on population density and other criteria (for example airports or city parks which have no population density are still tagged as urban). I consider a three digit zip code to be urban if over fifty percent of that thee digit zip code’s population resides in urban five digit zip codes.
8 of pregnancy. I put extra focus on Ob-Gyns because of their place in the medical malpractice literature as a specialty of particular interest. The second four procedures are performed
commonly by non-Ob-Gyns: coronary artery bypass graft (CABG) surgery, chest x-rays, fifteen minute office visits and tetanus shots.
Delivery is by far the riskiest procedure performed by Ob-Gyns. Vaginal delivery often has complications, and if they occur, then Ob-Gyns are often sued on the grounds that they waited too long to deliver and did not perform a c-section, which is a far less risky procedure than a vaginal delivery. For non-Ob-Gyns CABG surgery is also quite common, usually
performed by cardiothoracic and vascular surgeons, and also carries with it a fair amount of risk for the patients.
Transvaginal ultrasounds and abdominal ultrasounds are both very common diagnostic tests performed by Ob-Gyns. Transvaginal ultrasounds test the health of the reproductive system before conception and abdominal ultrasounds test the health of the early fetus. Similarly, chest x-rays are incredibly common diagnostic tests used by non-Ob-Gyns, and are used to diagnose a multitude of problems in the chest cavity. Fifteen minute office visits and tetanus shots are two very common general procedures performed by all specialties and general practitioners
respectively. Tetanus shots do carry a small amount of risk: there has been a history of malpractice cases involving children suffering adverse side effects from the vaccine.
For all of the above procedures, I can observe two outcomes of interest. The main outcome of interest is the amount the insurance company pays the physician (henceforth the allowed amount). The allowed amount is the outcome of a bargaining process between the insurer and health care provider and is the price actually observed in the market. The second outcome is the amount the health care provider submits to the health insurer (henceforth the charged amount). The charged amount is the physician’s initial offer in the price bargaining game, and is also what the market price would be for uninsured individuals. Both amounts are associated with the line item within each claim, so the price reported is only the price for that particular procedure and not for other services or procedures that were consumed with the procedure in question.
For both variables any negative values (errors in the data) or zero amounts (situations in which the insurer denied payment) were dropped, resulting in a subset of the data that only looks
9 at situations where services were paid for.14 I am also able to observe if the insurance plan is a health maintenance organization (HMO), preferred provider organization (PPO) or point of service plan (POS). In many cases the insurance plans type is not reported, these cases are grouped together into a plan type unknown category. The top half of Table 1 reports summary statistics for the eight procedures. All prices are expressed in constant 2002 dollars, adjusted using the consumer price index.
McCullough, Campbell & Lane LLP is a law firm in Chicago that specializes in insurance law. It maintains an online database of current state laws pertaining to medical malpractice torts. Further, the ATRA keeps an online record of all state legal changes that impact medical malpractice tort law. Using McCullough Campbell & Lane LLP and ATRA records, I constructed a database of all state laws regarding medical malpractice torts from 2003 to 2007. I then merged the database of tort laws with subsets of the FAIR health data. Table 2reports all changes in tort law during between 2003 and 2007.15
HRSA publishes the ARF annually. It includes information on the health services market as well as general demographic information taken from the Census Bureau. I use yearly
measures at the state level of the number of physicians, the general population, and median household income from the ARF. These variables are summarized at the bottom of Table 1. 4. Descriptive Results
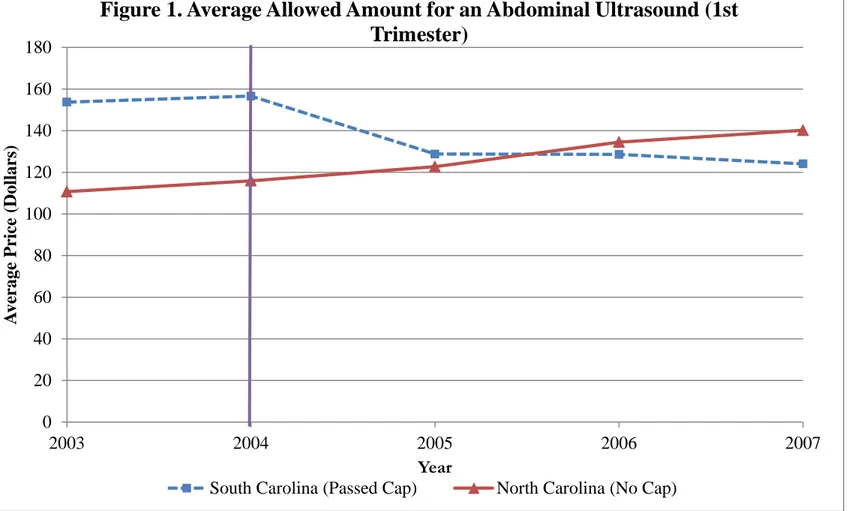
A general sense of the effect of implementing a damage cap can be gained by a comparison of two similar states, one that implements a cap, and one that does not. Figure 1 shows the average allowed amount for an abdominal ultrasound during the first trimester of pregnancy for North and South Carolina. South Carolina implemented a cap on non-economic damages which came into effect in 2005, North Carolina had no cap. South Carolina
experiences a drop in the average allowed amount for an ultrasound after the cap on damages is enacted, whereas no such drop is observed in North Carolina. In fact, prices in North Carolina were rising during this time.
14 Other specific amounts were also dropped, such as any value of 99,999 which is an error code used by some
insurers.
15
The italicized out reforms are those enacted for 2003 or those reforms that are not caps on non-economic damages, the variation from the italicized reforms cannot be used for identification of the effect of a damage cap.
10 The average price of an ultrasound was $155.19 in South Carolina before the cap was enacted and $127.15 after the cap was enacted. In North Carolina the average price was $113.31 before the cap was enacted and $132.48 after the cap was enacted. This yields a rough
difference in differences of -$47.20 or a 30.5% decrease in the price in South Carolina relative to North Carolina. This is by no means a well identified result, as the averages have not been regression adjusted to control for confounding variables, but Figure 1 does give a sense of how prices move in response to a cap on non-economic damages.
5. Methods
I identify the effect of non-economic damage caps on the price of medical services using within state variation. This is done by estimating the following fixed effects model.
ln(𝑃𝑖𝑠𝑡) = 𝛼+ 𝛽𝑋𝑖+𝛿𝐶𝑠𝑡+𝛾𝐾𝑠𝑡+𝜌𝑠+𝜙𝑡+𝜀𝑖𝑠𝑡 (3)
The dependent variable is either the log allowed amount for a specific procedure or the log charged amount, ln(𝑃𝑖𝑠𝑡), reported by the line item within claim i, in state s, in year t. 16 ln(𝑃𝑖𝑠𝑡)
is a function of the a vector of claim characteristics 𝑋𝑖, which includes the type of insurance plan as well as if the procedure was performed in an urban area, a dummy variable for if the state has a cap on non-economic damages 𝐶𝑠𝑡, a vector of state characteristics including other tort laws 𝐾𝑠𝑡, a state fixed effect 𝜌𝑠, a year fixed effect ϕt, and a random error term εist. The coefficient δ
that is associated with the implementation of a damage cap will give the effect of the cap’s implementation on the price of the service. It is possible for an omitted variable to bias the estimate of δ, if it was correlated with the price of medical services and with the implementation of each individual state cap.17
The above identification strategy also relies on the assumption that there were no pre-existing state specific trends that could explain changes in price attributed to the implementation of caps on non-economic damages. This parallel trends assumption proves difficult to test with a maximum of two years of data before a cap was implemented. Evidence from Malani and Reif
16
Though I refer to allowed or charged amounts as being part of a claim, the price is specific to the line item for the procedure in question. The procedures studied only show up once in a given claim.
17It is also possible that the implementation of a cap is endogenously related to the price of medical services.
However, such endogeneity would likely arise from a situation where a cap is passed because prices are rising. This would bias my estimates towards not finding a reduction in prices from the implementation of a cap.
11 (2010) shows that many medical malpractice tort reforms have sizable anticipation effects, so a test of the parallel trends assumption would likely falsely reject the null of parallel trends in the period before the cap was implemented.18 It should be noted that the existence of differential trends where the state enacting the damage cap has falling prices is unlikely, as caps tend to be passed in response to prolonged increases in the price of medical services.
The sample sizes used for analysis can be quite large, in some cases over 250 million observations. When sample sizes are so large, the usual critical values may not be entirely appropriate, as the chance of finding statistical significance grows disproportionately to the chance of rejecting a null that is true. To aid in interpretation I also report statistical significance based on the Leamer-Schwarz critical value as suggested by Deaton (1997). These critical values are set at �ln (𝑛), where n is the sample size, and are more appropriate for interpreting the significance of sample sizes in the multiple millions of observations as they require a larger magnitude of the estimate for significance. However, in smaller samples, the Leamer-Schwarz critical value is extremely conservative, and the usual critical values are more appropriate for interpretation.
6. Results
6.1 State Level Effects
At the state level, many allowed amounts decrease when caps on noneconomic damages are enacted. State level estimates of the effect of implementing a damage cap on the allowed amount for Ob-Gyn procedures are reported in Table 3-A. Each column of Table 3-A reports results from a separate regression for the allowed amount for a specific procedure. Left to right the procedures reported are: c-section, vaginal birth, transvaginal ultrasound, and abdominal ultrasound in the first trimester. The table only reports the effect of the cap and the constant term, estimates of the effects of control variables and fixed effects are suppressed.19 The first row gives the estimated effect of the cap in log points, followed by the robust standard error clustered at the state level in the second row. The third row gives the percent change in the price as a result of the cap. The allowed amount for a vaginal birth, transvaginal ultrasound and
18
The above identification strategies are incapable of identifying anticipation effects, and as such I underestimate the effect of a cap on the price of medical services.
19
12 abdominal ultrasound in the first trimester all show a negative and significant reaction to the implementation of a cap on non-economic damages. There was not a significant effect on the allowed amount for a c-section, but the estimate is suggestively negative.
Table 3-B reports estimates of the effect of implementing a damage cap on several non-Ob-Gyn procedures. The layout of Table 3-B is identical to the layout of Table 3-A, with the exception of the procedures reported. From left to right the procedures are: CABG, chest x-ray, 15 minute office visit, and tetanus shot. Only the estimates for the allowed amount for a CABG surgery and a tetanus shot show a negative and significant reaction to the implementation of a cap on non-economic damages. The effect on the allowed amount of a CABG surgery is much larger in magnitude than those estimated for Ob-Gyn procedures.
The decreases found at the state level in the allowed amounts are not found in the charged amounts. The effect of a damage cap on the price charged by physicians to the insurance
company is reported in Tables 4-A and 4-B. Tables 4-A and 4-B are identical in layout to 3-A and 3-B. The only result that shows up as statistically significant is that for 15 minute office visits. This estimate is positive and should be disregarded, at the regression is run on a sample of over 250 million observations and while significant based on usual measures is not statistically significant based on the Leamer-Schwarz critical value. All other estimates show no effect of damage caps on the amount doctors submit to insurance companies.
6.2 Urban vs Rural Differences
To further explore how price changes vary between urban and rural areas, I also estimate the following equation.
ln(𝑃𝑖𝑠𝑡) = 𝛼+ 𝛽𝑋𝑖+𝛿1𝑈𝐶𝑖𝑠𝑡 +𝛿2𝑅𝐶𝑖𝑠𝑡+𝛾𝐾𝑠𝑡+𝜌𝑠+𝜙𝑡+𝜀𝑖𝑠𝑡 (4)
Equation (4) is similar to equation (3), but has two variables of interest: 𝑈𝐶𝑖𝑠𝑡, a dummy variable for if the state has a damage cap and the procedure was performed in an urban area, and 𝑅𝐶𝑖𝑠𝑡, a dummy variable for if the state has a damage cap and the procedure was performed in a non-urban area. The coefficients of interest 𝛿1 and 𝛿2 give the effect of a damage cap on procedures
13 in urban and rural areas respectively. In the above specification, the vector 𝑋𝑖 does not include a dummy for whether the procedure was performed in an urban or rural location.
Tables 5-A and 5-B report results from equation (4). The first three rows show the effect of a cap on noneconomic damages on the allowed amounts in urban areas, and the next three rows show the effect in non-urban areas.20 The urban area estimates mirror the estimates for states as a whole reported in Tables 4-A and 4-B, but with slightly larger magnitudes. Estimates for non-urban areas show no reaction to the implementation of damage caps. This suggests that the effects found in Tables 4-A and 4-B are almost entirely driven by price changes in cities.
6.3 City Level Estimates
An alternative approach to identification of the effect of the damage cap is to use variation within a given city. I do this by restricting my sample to the 11 MSAs that cross the borders of the states that enacted caps after 2003 and estimating the following model.
ln(𝑃𝑖𝑚𝑠𝑡) = 𝛼+ 𝛽𝑋𝑖 +𝛿𝐶𝑠𝑡+𝛾𝐾𝑠𝑡+𝜓𝑚𝑡+𝜀𝑖𝑚𝑠𝑡 (5)
Equation (5) is similar to equation (3) with three differences, the new subscript 𝑚, denotes MSA, the vector 𝑋𝑖 does not include a control for urban areas, and the state and year fixed effects have been replaced by 𝜓𝑚𝑡a vector of MSA by year fixed effects. This specification gains
identification by comparing prices within the same MSA but on different sides of the state border. This specification effectively creates a natural experiment within an MSA, and removes a great deal of variation that may be omitted in the previous state level analysis. Because equation (5) controls for MSA specific trends, an omitted variable would need to change mid-year within an MSA while at the same time being correlated with both the price of medical services and the implementation of a damage cap to create bias. Such omitted variables are far less likely to occur than the type of omitted variables that would bias equation (3). The cross border specification in equation (5) does have a major drawback: since the model is dependent on variation found exclusively in urban areas, the results may not generalize. However, as shown
20
Results for charged amounts are available upon request, all charged amount estimates split by urban and rural are statistically insignificant.
14 in Tables 4-A and 4-B changes in the price are driven primarily by urban areas, so external validity (from the city to the state level) is not a big concern.
The cross border MSA analysis shows a much larger effect of implementing a damage cap. Estimates of the effect of a damage cap on the allowed amount for procedures using MSAs that cross state borders are reported in Tables 6-A and 6-B. Tables 6-A and 6-B follow the same layout as Tables 3-A and 3-B, but specification (5) is now used and standard errors are now clustered at the MSA level. All of the effects are negative and much greater in magnitude than those estimated using state level variation. Only the estimate for the price of a CABG surgery is statistically insignificant, which may be an artifice of the sample size being severely reduced when transitioning from the state level to the MSA level for this procedure.
Tables 7-A and 7-B report results for regressions where the charged amount is the dependent variable. The estimates of the effect of damage caps on the amount charged by physicians are insignificant for procedures in the Ob-Gyn specialty. The estimates for
procedures not in the Ob-Gyn specialty are very different. The non-Ob-Gyn procedures show negative and significant reductions in the amount charged, ranging from approximately one third the magnitude of the reduction in the allowed amount to approximately two thirds the magnitude of the reduction in the allowed amount.
6.4 Heterogeneous Effects on the Allowed Amount
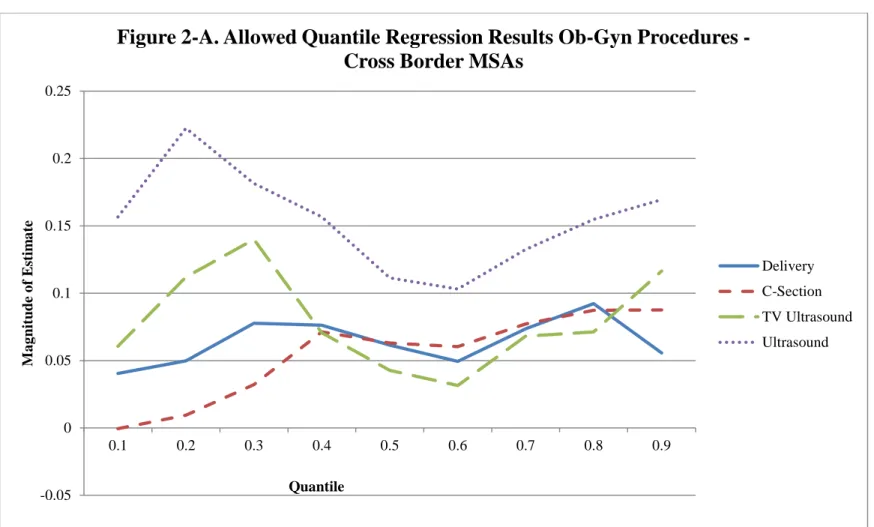
It is possible that the effect of a damage cap on the allowed amount of a medical procedure may vary across its price distribution. Physicians who have a higher price for their services may realize a greater (or smaller) percentage price reduction after a cap is enacted. To allow for this possibility I re-estimate equation (5) using quantile regression. I am then able to observe what the effect of a damage cap is on each conditional quantile in the procedure allowed amount distribution. The results of the quantile regressions are reported in Figures 2-A for Ob-Gyn procedures and 2-B for non-Ob-Ob-Gyn procedures.
For Ob-Gyn procedures there is a dip in the magnitude of the effect of a damage cap around the 60th percentile in the price distribution. This suggests that Ob-Gyns who have prices at the high and low end of the distribution have larger effects on prices than those in the middle. The exception to this is c-sections, which show increasing price reductions as the quantile
15 increases. General procedures do not show any strong pattern, although there does appear to be a slight positive relationship between the magnitude of the price reduction and quantile for chest x-rays.
6.5 Falsification Test
One way to test the robustness of these estimates is to see if I can find an effect of caps that never happened. If there are significant effects of nonexistent caps on the price of medical services, then the above results would be called into serious doubt. To do this I omit the states that enacted caps from the analysis and test the effect of the enacting of three false caps in states that did not share borders with states that enacted true caps on the price of services. I placed false caps in New York and Washington in 2005, and Nevada in 2004. These caps correspond to true caps enacted in Georgia and South Carolina in 2005, and in Illinois in 2004.
The effect of the false caps is reported in Table A for Ob-Gyn procedures, and Table 8-B for non-Ob-Gyn procedures. Tables 8-A and 8-8-B have the same layout and specification as tables 3-A and 3-B, but use false caps instead of real caps, and do not report percent changes in their allowed amounts. Not only is there is no significant effect for any of the procedures, but with the exception of 15 minute office visits, all of the standard errors are larger than the estimates.
7. Discussion and Conclusion
My analysis shows a relationship between caps on non-economic damages and the pricing of treatments by physicians, providing strong evidence that malpractice risk is passed through at least to insurance companies and possibly to consumers. My estimates are in some cases even larger in magnitude than the effects of defensive medicine on expenditures found by Kessler and McClellan (1996). This raises the question of whether quantity effects (defensive medicine) of medical malpractice risk are as large in magnitude as price effects. Further work would need to estimate both effects in tandem to satisfactorily answer this question.
Damage caps have a much larger effect on the allowed amount of a procedure than on the amount that a physician charges to the insurance company. This suggests that the mechanism by which prices are reduced is through the bargaining game between physicians and insurers.
Non-16 Ob-Gyns are willing to decrease their charged amounts slightly in response to a cap, and the full extent of the market price reduction is felt after the insurance company decides how much it is willing to reimburse. This is exacerbated with Ob-Gyns, who appear to be unwilling (or possibly unable) to decide to charge less after a damage cap is implemented, and all of the price reduction comes from the insurance company.
There does not appear to be a consistent link between the risk inherent in a particular procedure, and that procedure’s price sensitivity to damage caps. For Ob-Gyns, birthing is the most risky procedure performed, but the price of ultrasounds is far more sensitive to the
implementation of damage caps than the price of birthing. It is possible that Ob-Gyns spread the cost of the risk inherent in practice in general across the pricing of all procedures.
Overall, this work shows that the prices of medical services respond to changes in the strength of the malpractice liability system. The implementation of damage caps yields sizable reductions in the cost of some procedures, especially for those procedures in the Ob-Gyn field or for risky procedures such as CABG surgery. The costs savings from damage caps may in fact be quite sizable. For example, based on my results the cost savings from a caps’ price reduction for office visits alone in the state of Illinois in a single year comes to jest over $7.5million. For all 8 procedures estimated that number grows to almost $11.7 million. Further study of all medical procedures in the United States would be needed to know which procedures are price responsive, and which are not.
Finally, the estimated effect of caps does not mean that the same result would necessarily be felt if such caps were implemented in uncapped states or at a national level, as uncapped states may have smaller shares of malpractice risk being passed on to consumers. That is to say that states which pass caps may be self-selected on the proportion of prices which are attributed to malpractice risk pass through.
Acknowledgements
I would like to thank without implication Alexander Bogin, William Horrace, Thomas Kniesner, Sean Nicholson, Chris Rohlfs and seminar participants at the 2011 iHEA Congress, Abt
17 Associates, Syracuse University, and the University of Colorado Denver for their helpful
comments on previous drafts. Thank you to Mark Miller for excellent data management. The views expressed in this work are solely those of the author, any errors or omissions are my own. References
Baicker, Katherine and Amitabh Chandra, 2004. “The Effect of Malpractice Liability on the Delivery of Health Care,” NBER Working Paper No. 10709.
Currie, Janet and W. Bentley Macleod, 2008. “First Do No Harm? Tort Reform and Birth Outcomes,” Quarterly Journal of Economics, 123(2): 831 – 862.
Danzon, Patricia M., Mark V. Pauly, and Raynard S. Kington, 1990. “The Effects of Malpractice Litigation on Physicians’ Fees and Incomes,” The American Economic Review Papers and Proceedings, 80, 122-127.
Deaton, Angus, 1997. The Analysis of Household Surveys, Johns Hopkins University Press: Baltimore.
Friedson, Andrew I. and Thomas J. Kniesner, 2011 “Losers and Losers: Some Demographics of Medical Malpractice Tort Reform,” IZA Working Paper No. 5921.
Hyman, D. A., B. Black, C. Silver, and W. M. Sage, 2009. “Estimating the Effect of Damages Caps in Medical Malpractice Cases: Evidence from Texas.” Journal of Legal Analysis 1, 355-409.
Kessler, Daniel, and Mark McClellan, 1996. “Do Doctors Practice Defensive Medicine?” Quarterly Journal of Economics 111, 353-390.
Kessler, Daniel P., William M. Sage, and David J. Becker, 2005. “Impact of Malpractice Reforms on the Supply of Physician Services,” Journal of the American Medical Association 293(21): 2618-2625.
Klick, Jonathan, and Thomas Stratmann, 2007. “Medical Malpractice Reform and Physicians in High-Risk Specialties,” Journal of Legal Studies 35: 121-142.
King, Stephen P., 2011. “Does Tort Law Reform Help or Hurt Consumers?” The Economic Record 86: 563-577.
18 Lakdawalla, Darius and Seth Seabury, 2009. “The Welfare Effects of Malpractice Liability,”
NBER Working Paper No. 1538.
Mas-Colell, Andreu, Michael D. Whinston and Jerry R. Green, 1995. Microeconomic Theory, Oxford University Press New York.
Malani, Anup and Julian Reif, 2010. “Accounting for Anticipation Effects: An Application to Medical Malpractice Tort Reform,” NBER Working Paper No. 16593.
Manning, Willard G., Joseph P. Newhouse, Naihua Duan, Emmet B. Keeler, and Arleen Leibowitz, 1987. “Health Insurance and the Demand for Medical Care: Evidence from a Randomized Experiment,” The American Economic Review 77: 251-277.
Ormond, Barbara A., Stephen P. Zuckerman, and Aparna Lhila, 2000. “Rural/Urban Differences in Health Care Are Not Uniform Across States,” No. B-11 in Assessing the New Federalism. The Urban Institute: Washington D.C..
Phelps, Charles E., 2003. Health Economics, Addison Wesley: Boston.
Sloan, Frank, A., and Lindsey M. Chepke., 2008/ Medical Malpractice, The MIT Press: Cambridge.
Sloan, Frank A., Penny B. Githens, Ellen W. Clayton, Gerald B. Hickson, Douglas A. Gentile, and David F. Partlett, 1993. Suing for Medical Malpractice, University of Chicago Press: Chicago.
Thaler, Richard H., and Cass R. Sunstein, 2008. Nudge, Improving Decisions About Health, Wealth, and Happiness, Penguin Books: New York.
19 Table 1. Summary Statistics
Mean Allowed Std. Deviation Mean Charge Std.
Deviation Observations HMO PPO POS Urban Ob-Gyn Procedures
Cesarean Section 2180.44 674.07 3334.18 1238.18 552,113 0.099 0.279 0.256 0.938 Vaginal Birth 2008.83 573.35 2871.10 1039.31 1,112,030 0.113 0.281 0.238 0.928 Transvaginal Ultrasound (Not Pregnant) 99.33 64.86 207.28 121.37 4,713,055 0.086 0.286 0.236 0.948 Abdominal Ultrasound (1st Trimester) 115.55 67.47 210.72 117.10 922,141 0.081 0.263 0.260 0.951 Non Ob-Gyn Procedures
Single Coronary Artery Bypass Graft 1756.19 2120.38 4139.88 2899.56 6,919 0.085 0.287 0.117 0.927 Chest X-Ray 29.47 29.11 55.48 59.69 20,573,408 0.091 0.300 0.383 0.900 15 Minute Office Visit 52.92 27.21 75.07 433.58 257,882,996 0.093 0.299 0.200 0.897 Tetanus Shot 24.69 21.80 38.73 68.53 3,987,883 0.151 0.312 0.211 0.927
State Characteristics Mean Std. Deviation
Number of Doctors (Thousands) 14.38 17.44
Population (Thousands) 5538.99 6388.02
20 Table 2. State Malpractice Tort Law Changes 2003 – 2007a
State Year Implemented Change in Tort System
Florida 2003 Cap on Noneconomic Damages
Georgia 2005 Cap on Noneconomic Damages
Georgia 2005 Early Offer
Illinois 2004 Cap on Noneconomic Damages
Montana 2003 Cap on Punitive Damages
Ohio 2003 Cap on Noneconomic Damages
Oklahoma 2003 Cap on Noneconomic Damages
South Carolina 2005 Cap on Noneconomic Damages
Texas 2003 Cap on Noneconomic Damages
Washington 2006 Collateral Source Offset
Wisconsin 2005 Cap Ruled Unconstituional Wisconsin 2006 Cap on Noneconomic Damages a Italicized laws have no bearing on estimates of effect of a cap on noneconomic damages
21 Table 3-A. Effect of Damage Cap on Log Allowed (Ob-Gyn Procedures)a
Cesarean
Section Vaginal Birth
Transvaginal Ultrasound (Not Pregnant) Abdominal Ultrasound (First Trimester) Effect of Cap -0.017 -0.021** -0.021* -0.072***° (0.014) (0.009) (0.011) (0.017) Percent Change -1.669 -2.078 -2.095 -6.909 Constant 6.850***° 7.418***° 5.230***° 5.425***° (0.183) (0.221) (0.259) (0.461)
Controls YES YES YES YES
State Fixed
Effects YES YES YES YES
Year Fixed
Effects YES YES YES YES
R Squared 0.087 0.109 0.255 0.188 N 552,113 1,112,030 4,713,055 922,141
a Rejection of a single tail test p<0.1 denoted *, p<0.05 denoted **, p<0.01 denoted ***. Rejection of null based on
Leamer-Schwarz critical value denoted °. All standard errors are robust and clustered at the state level.
Table 3-B. Effect of Damage Cap on Log Allowed (Non-Ob-Gyn Procedures)a
Coronary Artery
Bypass Graft Chest X-Ray
15 Minute Office
Visit Tetanus Shot Effect of Cap -0.129** -0.014 0.002 -0.068*
(0.056) (0.013) (0.006) (0.035) Percent Change -12.103 -1.415 0.183 -6.570 Constant 10.698***° 3.337***° 4.303***° 2.357***°
(1.446) (0.518) (0.235) (0.409)
Controls YES YES YES YES
State Fixed Effects YES YES YES YES Year Fixed Effects YES YES YES YES
R Squared 0.058 0.164 0.162 0.346
N 6,919 20,573,408 257,882,996 3,987,883 a
Rejection of a single tail test p<0.1 denoted *, p<0.05 denoted **, p<0.01 denoted ***. Rejection of null based on Leamer-Schwarz critical value denoted °. All standard errors are robust and clustered at the state level.
22 Table 4-A. Effect of Damage Cap on Log Charges (Ob-Gyn Procedures)a
Cesarean
Section Vaginal Birth
Transvaginal Ultrasound (Not Pregnant) Abdominal Ultrasound (First Trimester) Effect of Cap 0.000 0.008 0.022 0.007 (0.013) (0.013) (0.020) (0.015) Percent Change 0.023 0.852 2.235 0.683 Constant 7.001***° 7.057***° 5.172***° 5.253***° (0.144) (0.158) (0.202) (0.297)
Controls YES YES YES YES
State Fixed Effects YES YES YES YES Year Fixed Effects YES YES YES YES R Squared 0.167 0.211 0.161 0.156 N 552,113 1,112,030 4,713,055 922,141
a Rejection of a single tail test p<0.1 denoted *, p<0.05 denoted **, p<0.01 denoted ***. Rejection of null based on
Leamer-Schwarz critical value denoted °. All standard errors are robust and clustered at the state level.
Table 4-B: Effect of Damage Cap on Log Charges (Non-Ob-Gyn Procedures)a
Coronary Artery
Bypass Graft Chest X-Ray
15 Minute Office
Visit Tetanus Shot
Effect of Cap 0.013 0.021 0.009* -0.007 (0.074) (0.032) (0.005) (0.007) Percent Change 1.313 2.143 0.904 -0.698
Constant 10.878***° 4.000***° 4.219***° 2.379***° (0.823) (0.313) (0.168) (0.305)
Controls YES YES YES YES
State Fixed Effects YES YES YES YES Year Fixed Effects YES YES YES YES
R Squared 0.126 0.080 0.142 0.402
N 6,919 20,573,408 257,882,996 3,987,883 a Rejection of a single tail test p<0.1 denoted *, p<0.05 denoted **, p<0.01 denoted ***. Rejection of null based on
23 Table 5-A: Effect of Damage Cap on Urban/Rural Log Allowed
(Ob-Gyn Procedures)a
Cesarean
Section Vaginal Birth
Transvaginal Ultrasound (Not Pregnant) Abdominal Ultrasound (First Trimester) Urban Effect of Cap -0.023 -0.026** -0.030* -0.077***°
(0.015) (0.011) (0.015) (0.015) Percent Change -2.274 -2.566 -2.955 -7.411 Rural Effect of Cap 0.053 0.032 0.085 -0.021 (0.030) (0.024) (0.052) (0.055) Percent Change 5.443 2.429 8.872 -2.078 Constant 6.820***° 7.391***° 5.176***° 5.402***°
(0.183) (0.219) (0.262) (0.466)
Controls YES YES YES YES
State Fixed Effects YES YES YES YES Year Fixed Effects YES YES YES YES R Squared 0.088 0.109 0.255 0.188 N 552,113 1,112,030 4,713,055 922,141 a Rejection of a single tail test p<0.1 denoted *, p<0.05 denoted **, p<0.01 denoted ***. Rejection of null based on
24 Table 5-B: Effect of Damage Cap on Urban/Rural Log Allowed
(Non-Ob-Gyn Procedures)a Coronary Artery
Bypass Graft Chest X-Ray
15 Minute Office
Visit Tetanus Shot Urban Effect of Cap -0.133** -0.023 0.000 -0.069* (0.055) (0.014) (0.006) (0.038) Percent Change -12.453 -2.274 0.000 -6.667 Rural Effect of Cap -0.044 0.061 0.014 -0.054*** (0.106) (0.047) (0.015) (0.019) Percent Change -4.305 -5.918 1.410 -5.257 Constant 10.650***° 3.345***° 4.315***° 2.360***° (1.415) (0.510) (0.235) (0.395)
Controls YES YES YES YES
State Fixed Effects YES YES YES YES Year Fixed Effects YES YES YES YES
R Squared 0.058 0.164 0.162 0.346
N 6,919 20,573,408 257,882,996 3,987,883 a
Rejection of a single tail test p<0.1 denoted *, p<0.05 denoted **, p<0.01 denoted ***. Rejection of null based on Leamer-Schwarz critical value denoted °. All standard errors are robust and clustered at the state level
25 Table 6-A: Effect of Damage Cap on Log Allowed (Ob-Gyn Procedures) -
Cross Border MSAsa
Cesarean Section Vaginal Birth
Transvaginal Ultrasound (Not Pregnant) Abdominal Ultrasound (First Trimester) Effect of Cap -0.085** -0.074***° -0.097** -0.147** (0.035) (0.021) (0.042) (0.061) Percent Change -8.193 -7.136 -9.256 -13.687 Constant 6.815***° 7.073***° 5.054***° 4.204***° (0.216) (0.169) (0.211) (0.181)
Controls YES YES YES YES
MSA by Year
Fixed Effects YES YES YES YES
R Squared 0.062 0.068 0.108 0.163
N 62,068 137,628 473,517 98,443
a Rejection of a single tail test p<0.1 denoted *, p<0.05 denoted **, p<0.01 denoted ***. Rejection of null based on
Leamer-Schwarz critical value denoted °. All standard errors are robust and clustered at the MSA level.
Table 6-B: Effect of Damage Cap on Log Allowed (Non-Ob-Gyn Procedures) - Cross Border MSAsa
Coronary Artery Bypass
Graft
Chest X-Ray 15 Minute Office Visit Tetanus Shot Effect of Cap -0.217 -0.157***° -0.043** -0.142*** (0.201) (0.038) (0.014) (0.043) Percent Change -19.508 -14.551 -4.164 -13.206 Constant 6.484***° 1.484***° 3.042***° 4.141***° (1.451) (0.388) (0.097) (0.158)
Controls YES YES YES YES
MSA by Year Fixed
Effects YES YES YES YES
R Squared 0.121 0.159 0.194 0.136 N 706 2,472,397 29,688,127 540,547 a Rejection of a single tail test p<0.1 denoted *, p<0.05 denoted **, p<0.01 denoted ***. Rejection of null based on
26 Table 7-A: Effect of Damage Cap on Log Charges (Ob-Gyn Procedures) -
Cross Border MSAsa
Cesarean Section Vaginal Birth Transvaginal Ultrasound (Not Pregnant) Abdominal Ultrasound (First Trimester) Effect of Cap -0.061 -0.033 -0.046 -0.051 (0.037) (0.029) (0.032) (0.034) Percent Change -5.872 -3.276 -4.538 -4.949 Constant 7.559***° 7.619***° 5.696***° 5.139***° (0.237) (0.147) (0.289) (0.184)
Controls YES YES YES YES
MSA by Year Fixed
Effects YES YES YES YES
R Squared 0.072 0.095 0.121 0.177 N 62,068 137,628 473,517 98,443 a
Rejection of a single tail test p<0.1 denoted *, p<0.05 denoted **, p<0.01 denoted ***. Rejection of null based on Leamer-Schwarz critical value denoted °. All standard errors are robust and clustered at the MSA level
Table 7-B: Effect of Damage Cap on Log Charges (Non-Ob-Gyn Procedures) - Cross Border MSAsa
Coronary Artery
Bypass Graft Chest X-Ray
15 Minute
Office Visit Tetanus Shot Effect of Cap -0.150 -0.124*** -0.038* -0.049***
(0.095) (0.033) (0.021) (0.015) Percent Change -13.952 -11.662 -3.729 -4.782 Constant 5.842***° 2.851***° 3.925***° 4.655***°
(0.974) (0.178) (0.068) (0.123)
Controls YES YES YES YES
MSA by Year Fixed
Effects YES YES YES YES
R Squared 0.200 0.110 0.206 0.167
N 706 2,472,397 29,688,127 540,547 a
Rejection of a single tail test p<0.1 denoted *, p<0.05 denoted **, p<0.01 denoted ***. Rejection of null based on Leamer-Schwarz critical value denoted °. All standard errors are robust and clustered at the MSA level.
27 Table 8-A: Effect of False (Incorrect State) Damage Cap on Log Allowed
(Ob-Gyn Procedures) a
Cesarean
Section Vaginal Birth
Transvaginal Ultrasound (Not Pregnant) Abdominal Ultrasound (First Trimester) Effect of False Cap 0.016 0.011 0.015 -0.019
(0.160) (0.013) (0.018) (0.023) Constant 6.814***° 7.351***° 5.054***° 5.283***°
(0.183) (0.221) (0.224) (0.468)
Controls YES YES YES YES
State Fixed Effects YES YES YES YES Year Fixed Effects YES YES YES YES R Squared 0.084 0.111 0.256 0.165 N 488,529 965,451 4,231,626 652,608 a
Rejection of a single tail test p<0.1 denoted *, p<0.05 denoted **, p<0.01 denoted ***. Rejection of null based on Leamer-Schwarz critical value denoted °. All standard errors are robust and clustered at the state level.
Table 8-B: Effect of False (Incorrect State) Damage Cap on Log Allowed (Non-Ob-Gyn Procedures) a
Coronary Artery
Bypass Graft Chest X-Ray
15 Minute Office
Visit Tetanus Shot Effect of False Cap 0.012 0.026 -0.022 -0.003
(0.786) (0.021) (0.018) (0.021) Constant 10.492***° 3.207***° 4.314***° 2.089***°
(1.533) (0.500) (0.234) (0.318)
Controls YES YES YES YES
State Fixed Effects YES YES YES YES Year Fixed Effects YES YES YES YES R Squared 0.048 0.150 0.136 0.394 N 6,089 18,057,457 226,717,775 3,463,383 a
Rejection of a single tail test p<0.1 denoted *, p<0.05 denoted **, p<0.01 denoted ***. Rejection of null based on Leamer-Schwarz critical value denoted °. All standard errors are robust and clustered at the state level
28 0 20 40 60 80 100 120 140 160 180 2003 2004 2005 2006 2007 A v era g e P ri ce (D o ll a rs ) Year
Figure 1. Average Allowed Amount for an Abdominal Ultrasound (1st
Trimester)
29 -0.05 0 0.05 0.1 0.15 0.2 0.25 0.1 0.2 0.3 0.4 0.5 0.6 0.7 0.8 0.9 M a g n itu d e o f E sti m a te Quantile
Figure 2-A. Allowed Quantile Regression Results Ob-Gyn Procedures -
Cross Border MSAs
Delivery C-Section TV Ultrasound Ultrasound
30 0 0.05 0.1 0.15 0.2 0.25 0.3 0.35 0.4 0.45 0.1 0.2 0.3 0.4 0.5 0.6 0.7 0.8 0.9 M ag ni tu de of E st im at e Quantile
Figure 2-B. Allowed Quantile Regression Results Non-Ob-Gyn Procedures -
Cross Border MSAs
CABG Chest X-Ray Tetanus Shot 15 Min Office Visit