Master Programme in Economic Growth,
Innovation and Spatial Dynamics
The Gender Digital Divide
Yanfei Zhao
[email protected]
Abstract:
Gender not only pervades how people use the ICT, but also influences
whether or not and how much they use them. This study, making use of the latest
possible secondary data, studies the possible gender digital divide among users of
ICT in both developed and developing countries. I move the study of gender digital
divide from an early narrow perspective of ICT access and usage patterns among
biologically identifiable men and women to a wider exploration of its statistical
evidences, its important aspects, and its crossing through four Es. Fewer economic
resources, lower levels of awareness, literacy and education, gendered ICT training
and gendered ICT sector are identified as important contributes to gender digital
divide which can supposedly be bridged through four Es: education in ICT
competency, equality of ICT access, employment in ICT-related occupations and
ICT–enabled jobs, and empowerment by ICT use.
Key words:
gender; digital divide; ICT; segregation; feminism; technology
EKHR71
Master thesis, first year (15 credits ECTS)
June 2013
Supervisor: Jonas Ljungberg
Examiner: Anders Nilsson
2 ACKNOWLEDGEMENT
I want to express my gratitude to all those who made it possible for me to complete this thesis. My sincerest gratitude goes to Jonas Ljungberg, my supervisor. He reads this thesis and comments on it again and again, providing me with both revelation and encouragement. The completion of this research would never been possible without his patient and enlightening guidance. I‘d like to thank all the teachers teaching the courses in the programs of Economic History in Lund University, from whom I've learned a lot and developed both interest and competence in researches of issues related with economic history. Living and studying in Lund has been and would be forever, a most memorable, joyful, and inspirational experience of my life. I love the clear blue sky, the cute architecture, and the kind, helpful friends I made in Lund. I‘d also like to thank my parents for their unconditional love and support to me. In the end I have to say: I will always treasure my fond memory of the kind, energetic and intelligent Swedish people: Hugo, Lena, Hilda, Julius, Tim, Susanne, Eva, Monica, Gunn, Gunnel, Adam, Daniel and Gudrun.
3 CONTENTS
CHAPTER ONE: INTRODUCTION ---5
1.1 Background ---5
1.2 Objectives ---5
CHAPTER TWO: LI TERATURE --- ---6
2.1 Work Segregation ---6
2.1.1 Horizontal Segregation---6
2.1.2 Vertical Segregation---6
2.2 Feminist Theories of Technology --- ---7
2.2.1 Technology as Culture---7
2.2.2 Technology as Gendered--- 8
2.2.3 Contemporary Approaches---8
2.3 Digital Divide --- ---8
CHAPTER THREE: METHOD ---9
3.1 Design and Data --- ---9
3.2 Advantages and Disadvantages ---10
CHAPTER FOUR: STATISTICAL EVIDENCES OF GENDER DIGITAL DIVIDE---10
4.1 Magnitude of Gender Digital Divide ---10
4.2 Frequency of ICT Use ---12
4.3 Location of ICT Use ---14
4.4 Patterns of ICT Use ---15
CHAPTER FIVE: IMPORTANT ASPECTS OF GENDER DIGITAL DIVIDE ---18
5.1 Fewer Economic Resources --- ---19
5.2 Lower Levels of Awareness, Literacy and Education ---22
5.2.1 Awareness--- ---23
5.2.2 Literacy---24
5.2.3 Education---26
5.3 Gendered ICT Training --- ---27
5.4 Gendered ICT Sector ---30
CHAPTER SIX: CROSSING GENDER DIGI TAL DIVIDE THROUGH FOUR E’S ---33
6.1 The Evolving Gender Digital Divide ---33
6.2 The 1st E — Education in ICT Competency ---35
6.3 The 2nd E — Equality of ICT Access ---36
6.4 The 3rd E — Employment in ICT-Related Occupations and ICT-Enabled Jobs ---37
6.5 The 4th E — Empowerment by ICT Use ---38
CHAPTER SEVEN: CONCLUSION ---39
4
7.2 Limitations and Future Directions ---41
References --- ---43
ABLES AND CHARTS TABLES Table 1: Percentage of Women and Men Using the Internet in China ---11
Table 2: Female Internet Access Rates by Focus Country and Region ---12
Table 3: Gender Digital Divide: Percentage of Women and Men Aged 15 to 74 Using the Internet ---12
Table 4: Frequency of Use of the Internet by Recent Internet Users, by Sex, UK, 2006, 2007 & 2008 (Per cent)-13 Table 5: Frequency of UK Users Using Mobile Search by Gender, 2010 % of Respondents ---13
Table 6: Places where Internet has been used1 by Women and Men2, Selected Countries, 2005---14
Table 7: Share of Time Spend Online: Females vs. Males---16
Table 8: Top Indexing Categories: % Reach for Females vs. Males---17
Table 9: Share of Time Spent on Social Networking, Email, and IM---17
Table 10: Consumer Usage of Twitter in the U.S.---18
Table 11: Percentage of Individuals Aged 16 and Older Using the Internet (%), by Income, in Selected African Countries, 2007/2008*---20
Table 12: Percentage of Households with Computer/Internet and Gender Digital Divide---22
Table 13: Knowing about the Internet and Using it: the Gender Divide, 2007/2008*---23
Table 14: Statistics and Indicators on Women and Men Literacy (Left) And % Population (Internet Penetration) (Far Right)--- ---25
Table 15: Gender Segregation in the Field of Study---28
Table 16: Women Drop-Out Rate for Tertiary ICT Studies and ICT Careers in Focus Countries, in 2009---29
Table 17: Var iables and Barriers Influencing Women Succeeding in the ICT Sector---32
CHARTS Chart 1: Percentage of Individuals Aged 16 or Older Using the Internet, by Highest Educational Level Attained in Selected African Countries, 2007/2008---26
Chart 2: Core ICT Workers by Gender, in South Africa, in 2005---31
5 CHAPTER ONE: INTRODUCTION Background and Objectives
1.1 Background
The second half of the last century witnessed human kind conducting a massive task of making our huge store of knowledge and information more accessible (Bush, 1945). The task is not finished, but its current results have turned on irrevocable social, productive, political and cultural changes (Geldof & Unwin, 2005) made possible by Information and Communication Technology (ICT) in all forms and functions. In all these changes lies the question of getting accessed to the huge digital store of knowledge and information, and in particular, who gets advanced digitally by use of these new inventions and who is digitally marginalized in the Internet age.
As a contribution to this ongoing discussion, this study analyzes how women differ from men in their access to and use of ICT in the selected countries. First I make a literature review which shows that: gender segregation exists not only at home but also at work, and hence women tend to be segregated from men horizontally across occupations and vertically at positions; technology is not only cultured with strong masculinity but also gendered accordingly much to the disadvantages of women; dominating as it is, technology is shaped in turn by various gender factors; in all these mutual actions between technology, culture and gender, digital divide still occurs between genders in terms of the actual physical ICT possession, access to the Internet and the quantity and intensity of ICT use. Then I seek and present statistical evidences of gender digital divide not only about its magnitude across the world, but also about its frequency, location and patterns in use. Finding that the inequality in employment, income and education affecting female ICT use negatively, I go on to explore the important aspects of gender digital divide, namely, fewer economic resources; lower levels of awareness, literacy and education; gendered ICT education; and gendered ICT sector. Mapping the evolving changes in gender digital divide, I bring the study to an end by investigating crossing gender digital divide through four Es: education in ICT competency, equality of ICT access, employment in ICT-related occupations and ICT-enabled jobs, empowerment by ICT use.
1.2 Objectives
The objectives of this study are:
●To track statistical evidences of gender digital divide so as to answer the question of How great is gender digital divide?
●To explore important aspects of gender digital divide so as to answer the question of What are the barriers to ICT use for women?‖
●To seek possible solutions to gender digital divide so as to answer the question of In what ways gender digital divide could be bridged?
6 CHAPTER TWO: LITERATURE
Work Segregation, Feminist Theories of Technology, Digital Divide
The following sets of literatures in feminism and media are most relevant and beneficial to the present study. 2.1 Work Segregation
Work segregation refers to the tendency of women and men to work in different sectors and occupations. An illustration from the labor market is such as one of the genders dominates a given professional category (De Meyer et al., 1999). Two types of work segregations could be distinguished.
2.1.1 Horizontal Segregation
Hor izontal segregation refers to over/under presence of a certain group in occupations or sectors which is not ordered by any criterion ( Bettio and Verashchagina, 2009). It is understood as the concentration of women and men in professions or sectors of economic activity. Horizontal segregation is believed to be a constant phenomenon in the labor market in all OECD countries (Rubery and Fagan, 1993). Being a near ly immutable and universal characteristic of contemporary socio-economic systems (Anker, 1998), horizontal segregation is anticipated to be staying on or to be even accentuated (Jonung, 1998). It also explains a part of the gender pay gap (Blau and Ferber, 1987). Abundant evidence shows that women enter scientific fields in higher numbers when men do not choose to enter these fields, and science, engineering and technology sectors as well as ICT have always been dominated by men in almost all European states (Thewlis et al, 2004).
2.1.2 Vertical Segregation
Vertical segregation refers to over/ under representation of a certain identif iable group in occupations or sectors at the top of an ordering based on such ‗desirable‘ contributes as income, prestige, job stability, etc, independent from the sector of activity. Under-representation at the top of occupation-specific ladders, categorized into the heading of ‗vertical segregation‘ in the past, is now more commonly expressed as ‗hierarchical segregation‘(Bettio and Verashchagina, 2009). In gender studies, vertical segregation is sometimes referred to by the ―glass ceiling‖ indicating visible or invisible obstacles that result in a certain rarity of women in power and decision positions in organizations or enterprises. The concept of barriers preventing the ascension of women is completed by another one of ―sticky floor‖, describing the forces holding women at the lowest levels in the organizational pyramid (Maron and Meulders, 2008). Vertical segregation is evidenced by many reports. Research conducted for an ITU (2012b) study in both developed and developing countries found classic cases of vertical gender segregation, with women on average accounted for 30 per cent of operations technicians, only 15 per cent of managers and a mere 11 per cent of strategy and planning professionals. The widening women‘s work in information and communication technology ( Valenduc et al, 2004) reports that in ICT organizations across Europe there exists a flat structure with little hierarchy, inducing an informal working environment in which career ladders could be nonexistent. A lack of formal progression proc esses can make it especially hard for
7
women to achieve career advancement. This can be a hinder to women because they are more likely to advance where career paths are clear (Wickham et al, 2008).
In feminism, the terms of glass ceiling effect and sticky floor effect have been transplanted from economics. The glass ceiling is ―the unseen, yet unreachable barrier that keeps minorities and women from rising to the upper rungs of the corporate ladder, regardless of their qualifications or achievements ‖ (Federal Glass Ceiling Commission, 1995). Initially, the metaphor was used to describe barriers faced by working women but was quickly extended to refer to obstacles impeding the advancement of minority men, as well as women. Four distinctive characteristics of the glass ceiling inequality have been def ined by Cotter, et al. (2001):
●A glass ceiling inequality represents a gender or racial difference that is not explained by other job-relevant characteristics of the employee. (p.657)
●A glass ceiling inequality represents a gender or racial difference that is greater at higher levels of an outcome than at lower levels of an outcome. (p. 658)
●A gender or racial inequality represents a gender or racial inequality in the chances of advancement into higher levels, not merely the proportions of each gender or race currently at those higher levels. (p. 659)
●A glass ceiling inequality represents a gender or racial inequality that increases over the course of a career. ( p. 661)
By comparison, the term ―sticky floor‖ is applied to describing a discriminatory employment pattern which keeps at the bottom of the job scale a certain group of people. Those who experience the ―sticky floor‖ are often ―pink collar workers,‖ such as secretaries, nurses, or waitresses.
2.2 Feminist Theories of Technology
Feminist theories of technology conceptualize the link between gender and technology.
2.2.1 Technology as Culture
Defined in terms of male activities, technology is traditionally equaled with industrial machinery and military weapons, namely the tools of work and war, dwarfing other technologies used widely in daily life; initially, feminists try to prove that the biological sex difference does not necessarily result in the identif ication between technology and manliness, arguing that the taken-for-granted connection between men and machines comes mainly from the historical and cultural making of gender (Wajcman, 2009). Just as mainstream science and technology studies (STS) do, feminists believe that socio-technical relations exist not only in phys ical objects and institutions but also in symbols, language and identities (McNeil, 2007), asserting that science and technology (technoscience) are a notion of culture or ‗material-semiotic practice‘. In contemporary Western society, the hegemonic form of masculinity is still strongly associated with technic al prowess and power (Wajcman, 1991). Although women‘s opportunities in the new knowledge economy increase, men continue to dominate technical
8
work. Women‘s employment in the information technology, electronics and communications (ITEC) sector has been much lower than their participation in the workforce generally, and it is declining in most industrialized countries (Wajcman, 2009). Labour market economists tend to contribute such sex segregation to differences in human capital, domestic responsibilities disproportionately given to women, and employment discrimination (Becker, 1991). In their opinion, to remedy the ‗gender deficit‘, a combination of different socialization processes and equal opportunity policies need to be exercised.
2.2.2 Technology as Gendered
Because of the complexity of the relationship between women and technology, by the 1980s feminists efforts shift from exploring women‘s access to technology to examining the very processes by which technology is developed and used, as well as those by which gender is constituted (Wajcman, 2009). For radical feminism, women are fundamentally different from men. Their power, culture and pleasure are supposedly controlled and dominated systematically by men in the framework of patriarchal institutions. While radical feminists argue that gender power relations are embedded more deeply within technoscience, liberal feminism sees the problem in terms of male control of neutral technologies (Wajcman, 2009). When radical feminism focuses on women‘s bodies and sexuality, socialist feminism centers on the relationship between women‘s work and technology, arguing that, far from being an autonomous force, technology itself is crucially affected by the antagonistic class relations of production, and that women‘s exclusion from technology is a consequence of the male domination of skilled trades that develops during the Industrial Revolution ( Bradley, 1989; Cockburn, 1983). The socialist feminist frameworks see masculinity as embedded in the machinery itself, highlighting the role of technology as a key source of male power (Cockburn, 1985).
2.2.3 Contemporary Approaches
If feminists of the 1980s are rather pessimistic about the prospects for women offered by the microelectronic revolution, feminist approaches from the 1990s till today, being centered on the mutual shaping of gender and technology and regarding technology as both a source and consequence of gender relations, are positive about the possibilities of ICT to empower women and transform gender relations (Green and Adam, 1999; Kemp and Squires, 1998). A social constructivist framework now is widely adopted by feminist STS scholars (Berg, 1996), conceiving of technology as both a source and consequence of gender relations (Wajcman, 2004). Moreover, the concept of gender itself is now understood as a performance or social achievement, constructed in interaction (Butler, 1990). Rather than conceiving of gender as fixed and existing independently of technology, the notion of performativity, or ‗gender as doing‘, sees the construction of gender identities as shaped together with the technology in the making (Wajcman, 2009).
2.3 Digital Divide
The digital divide is ―the gap between individuals, households, businesses and geographic areas at different socio-economic levels with regard both to their opportunities to access ICT and to their use of the Internet for a
9
wide variety of activities‖ (OECD, 2001). Existing globally between developed and developing countries, or nationally within a country, the digital divide can show itself in different demographic characteristics of the population, such as age, gender and income, or in different locations, such as urban and rural (ITU, 2010). As study goes further, academic literature has commonly distinguished between first and second digital divide (Attewell, 2001). First digital divide refers to an actual physical gap between those who have ICT, such as computers, scanners and camcorders, as well as access to the Internet. For example, according to ITU (2011), the gender gap in the Internet use in 2010 is still quite high in some countries/regions, and the largest differences of women - men are found in Turkey (-20.2) and Azerbaijan (-17.9). Second digital divide describes the gap in the quantity, intensity,efficacy, pattern of ICT use, psychological attitudes (Adams et al., 2005), motivations and Internet skills (Min, 2010).
More specifically, the gender digital divide, which is assumed to be synonymous with and about women in this study, indicates the under-representation of women in the ICT-related fields (Fink and Kenny, 2003).
CHAPTER THREE: METHOD
Design and Data, Advantages and Disadvantages
3.1 Design and Data
In this study, ICT refers to the Internet and, by extension, the computer, but traditional mediums such as mobile phones, print media, radio and televis ion are subsumed under this acronym, for they expand the reach of ICT initiatives and facilitate the spread of information. The gender digital divide in focus refers to inequalities of ICT in terms of access, actual usage, literacy, skills and employment, etc.
To fulfill the three objectives and answer the three questions as mentioned above, this study goes by four steps.
Step 1: Reviewing related literatures supporting the study of gender digital d ivide (presented in Chapter 2) Step 2: Tracking statistical evidences of gender digital divide (presented in Chapter 4)
Step 3: Exploring important aspects of gender digital divide (presented in Chapter 5) Step 4: Seeking possible solutions to gender digital divide (presented in Chapter 6)
For secondary analysis, I collect and examine statistical data mainly from the following fifteen sources: intel, an Amer ican multinational semiconductor chip maker corporation; CNNIC, the China Internet Network Information Center; ITU, a United Nations specialized agency for information and communication technologies ; Turk Stat, the Turkish Statistical Institute; ONS, the Office for National Statistics of UK; eMarketer, based in London, covering digital marketing, media and commerce; OECD, the Organization for Economic Co-operation and Development, based in Paris; comScore, based in Virginia, USA, measuring and studying what users of the Internet do as they navigate the digital world; DESA, the Department of Economic and Social Affairs, UN;
10
Internet World Stats, dealing with the collection, classification, analys is, interpretation, and presentation of masses of numerical data; The World Bank , a source of financial and technical assistance to developing countries around the world; European Schoolnet, the network of 30 European Ministries of Education based in Brussels; UNCTAD, the United Nations Conference on Trade and Development; Catalyst, the leading nonprofit membership organization expanding opportunities for women and business ; meraka, an African advance institute for information and communication technology and ACS, the Australian Computer Society.
After collecting the data from the fifteen secondary sources listed above I make some necessary editing, examining them to discover any unrelated elements, rearranging them to make them more logical and combining some with some others to make them more convincing.
3.2 Advantages and Disadvantages
This empirical study is based on and supported by secondary data, the choice of which is made mainly due to two factors: the data availability/quality and the point view of developing/ developed countries.
This type of empirical study has both its advantages and disadvantages. According to Boslaugh (2007), in working with secondary data there are three advantages: the task economically convenient, the data widely available, and the data quality professional and accurate. Tow disadvantages could be cited: the data are not collected in the first place to answer my specific study questions; I am not involved in any of the planning and execution of the original data collection process, so I don't know exactly how it is done.
CHAPTER FOUR: STATISTICAL EVIDENCES OF GENDER DIGITAL DIVIDE
Magnitude of Gender Digital Divide, Frequency of ICT Use, Location of ICT Use, Patterns of ICT Use
An investigation seeking statistical evidences is not only indispensible to the exploration of the important aspects of gender digital divide, but also absolutely necessary if the adverse impact of the current trends of ICT access and ICT use on women worldwide could be dealt with and the potential of ICT could be enhanced to become an effective tool for women‘s advancement.
4.1 Magnitude of Gender Digital Divide
According to ITU (2013), in 2013 globally women are far more outnumbered by men in using the Internet: only 37% of all women are Internet users, compared with 41% of all men; in addition, the greater gender gap exists more widely in the developing world, ―where 16% fewer women than men use the Internet, compared with only 2% fewer women than men in the developed world.‖
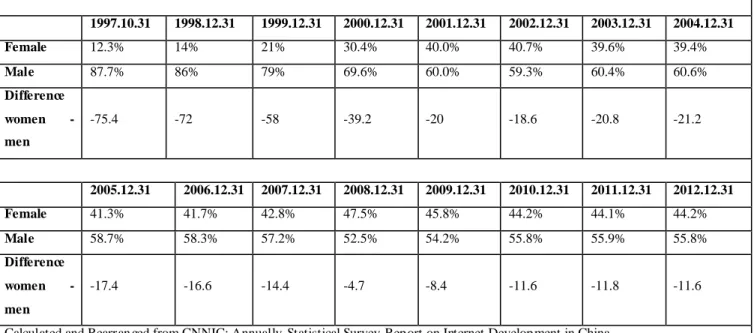
Table 1 below reveals the gender distribution of the Internet users in China from 1997 to 2012: in China the Internet is mostly dominated by men, especially from 1997 to 2004. The female-male difference, however, closes
11
down as the time continues, reaching the narrowest at -4.7 by the end of 2008 when it turns larger and larger again, climaxing at -11.8 by the end of 2011.
Table 1: Percentage of Women and Men Using the Internet in China
1997.10.31 1998.12.31 1999.12.31 2000.12.31 2001.12.31 2002.12.31 2003.12.31 2004.12.31 Female 12.3% 14% 21% 30.4% 40.0% 40.7% 39.6% 39.4% Male 87.7% 86% 79% 69.6% 60.0% 59.3% 60.4% 60.6% Difference women - men -75.4 -72 -58 -39.2 -20 -18.6 -20.8 -21.2 2005.12.31 2006.12.31 2007.12.31 2008.12.31 2009.12.31 2010.12.31 2011.12.31 2012.12.31 Female 41.3% 41.7% 42.8% 47.5% 45.8% 44.2% 44.1% 44.2% Male 58.7% 58.3% 57.2% 52.5% 54.2% 55.8% 55.9% 55.8% Difference women - men -17.4 -16.6 -14.4 -4.7 -8.4 -11.6 -11.8 -11.6
Calculated and Rearranged from CNNIC: Annually Statistical Survey Report on Internet Development in China
For the benefit of comparison, let‘s see data about the United States from eMarketer (2013): in 2013, 52.1 percent of the U.S. Internet population is women, while the percentage of men is 47.9. This means women in the United States are not only far more likely than women in China to have Internet access, but also more likely than their male peers in the United States to have Internet access.
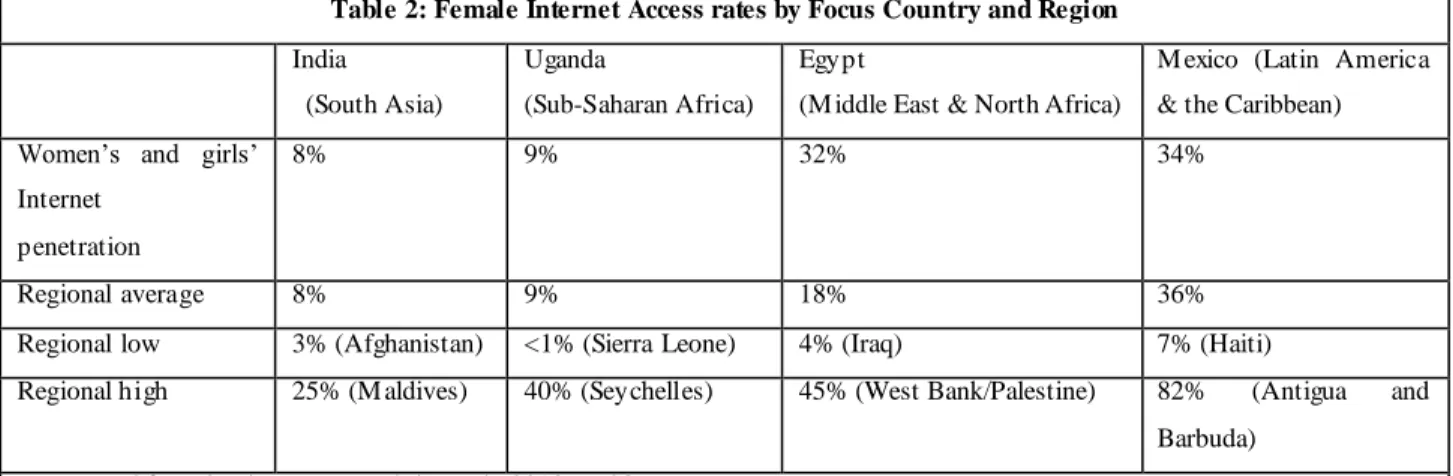
Table 2 below indicates that only 8 percent of Indian women and 9 percent of Uganda women are online; in Egypt and Mexico, rates of female Internet access are much higher, 32 percent and 34 percent respectively. Mexican women enjoy signif icantly higher rates of access than other women in South Asia, Sub-Saharan Africa, Middle East and North Africa, while women‘s access levels in India and Uganda are roughly on par with regional levels. What is stupendous is the extremely wide gap existing between the regional lows and regional highs as seen in the last two lines, which indicates there is not only a big geographical digital divide but also an unbalanced social-economic development among developing countries.
12
Table 2: Female Internet Access rates by Focus Country and Region
India (South Asia)
Uganda
(Sub-Saharan Africa)
Egypt
(M iddle East & North Africa)
M exico (Latin America & the Caribbean) Women‘s and girls‘
Internet penetration
8% 9% 32% 34%
Regional average 8% 9% 18% 36%
Regional low 3% (Afghanistan) <1% (Sierra Leone) 4% (Iraq) 7% (Haiti)
Regional high 25% (M aldives) 40% (Seychelles) 45% (West Bank/Palestine) 82% (Antigua and Barbuda)
Rearranged from intel: Women and the Web, 2013, p. 23
One direct cause of women being greatly outnumbered by men in ICT use may be that, in many developing countries, women make less money and hence have less access to education. Studies such as the one by Milek et al. (2011) have discovered that women are likely to earn less than men even when they are equal in work qualif ications and experience. Lower income level often leads to less affordability to ICT access for women. Additionally, women‘s lower level of education would also result in an income imbalance between the genders.
In contrast, Table 3 below, showing the percentage of women and men aged 15 to 74 using the Internet in a descending manner, indicates that within a developed country/region, gender digital divide is much smaller, and that it differs only slightly between them. This is illustrated by the women-men differences, in the last column, of Japan (-3.7%), Israel (4.5%), EU 27 (-5.4), Switzerland (5.9%), Macao of China (6.1%), Hong Kong of China (6.2%), Singapore (8.1%) and Korea (Rep.) (8.4%).
Table 3: Gender Digital Divide: Percentage of Women and Men Aged 15 to 74 Using the Internet
Source: ITU World Telecommunication/ICT Indicators database
Country/ Region Reference Year Women Men Difference Women - Men
Japan 2009 83.8 87.5 -3.7
Israel 2009 64.2 68.7 -4.5
EU27 2010 68.5 74.0 -5.4
Switzerland 2010 86.0 91.9 -5.9
M acao, China 2009 53.7 59.9 -6.1
Hong Kong, China 2009 69.2 75.3 -6.2
Singapore 2009 63.3 71.4 -8.1
Korea (Rep.) 2009 78.5 86.9 -8.4
Selected and rearranged from ITU:M easuring the Information Society, 2011,p. 117
4.2 Frequency of ICT Use
As part of the issues representing the intensity of ICT use, frequency of use represents a second, and more critical, digital divide that should be studied and br idged in order for women to share in the benefits of an information
13
society, for ―the ability to access, adapt, and create new knowledge using new information and communication technology [ICT] is critical to social inclusion in today‘s era‖ (Warschauer, 2003a).
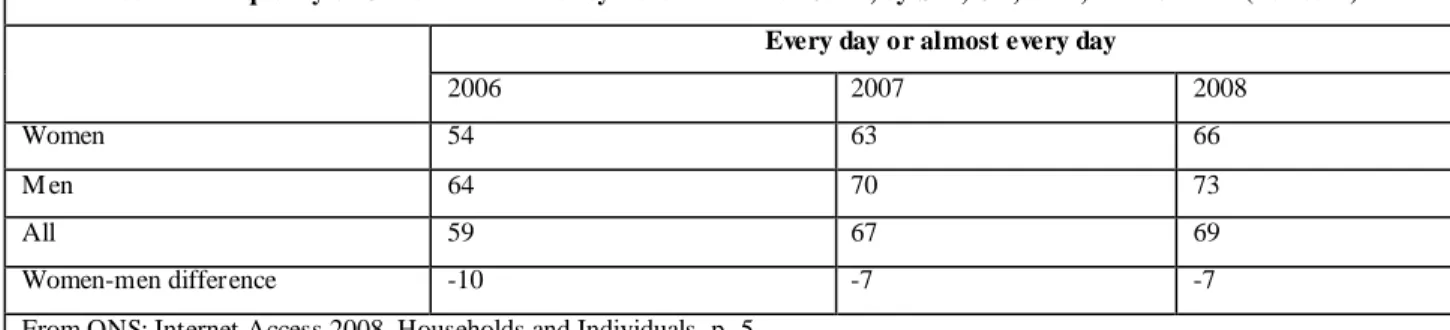
In the developed UK, Individuals‘ use of the Internet is gendered as is shown in Table 4 below. In 2008, almost three quarters of British men (73 per cent) use the Internet every day or almost every day, compared with two thirds of British women (66 per cent).
Table 4: Frequency of Use of the Internet by Recent Internet Users, by Sex, UK, 2006, 2007 & 2008 (Per cent) Every day or almost every day
2006 2007 2008
Women 54 63 66
M en 64 70 73
All 59 67 69
Women-men difference -10 -7 -7
From ONS: Internet Access 2008, Households and Individuals, p. 5
In the mobile Internet use, gendered frequency is also present in UK. Table 5 below reveals a familiar pattern: males more frequently search online by the mobile Internet.
Table 5: Frequency of Using Mobile Search According to UK Internet Users, by Gender, 2010 (% of Respondents)
Source: Tamar, "2010 Search Attitudes Report," June 1, 2010
Male Female
Daily 10% 3%
Once a week 14% 6%
Once a month 6% 5%
Once every 3 months 3% 3%
Once every 6 months 4% 2%
Once a year 2% 4%
Never 56% 72%
Don‘t know 1% 1%
Do not have mobile phone 4% 4%
From eM arketer: UK Internet Users and Usage: Top 2010 Trends, November 2010, p. 14
This disproportionate share in mobile use could be understood by a few possible explanations. First, men adopt the ICT earlier than women, suggesting that this is yet another area in which they are to lead the trend. Second, men tend to be making more money than women, thus enabling them to purchase a costly Smartphone and pay for a monthly data plan. comScore MobiLens data in the U.S. and in the E.U. also indicate that the vast majority of mobile users whose mobile phone plans are at least partially paid for by their employer are male (comScore, 2010).
14 4.3 Location of ICT Use
Where the Internet is accessed is important because the accessing location is often associated with imbalances in access to physical infrastructure, such as computers and Internet, or even conventional communication infrastructure like fixed telephone lines. So another dimension of the gender divide study is from where women access and use ICT.
Across the world, the key categories of accessing locations are: ―home, office, school, library, public, cyber café, gaming (Internet access in gaming establishment), kiosk, mobile, access points (wireless access via Wi-Fi & Bluetooth)‖ (eTForecasts, 2012). Table 6 below shows that except in the Slovak Republic, ―at home‖ is the most common place for both women and men to use the Internet, leaving ―at work‖ far behind in most of the countries in terms of access except in the Czech Republic, Greece, or Portugal. Data from the same source also indicate that in all countries except Brazil, Korea and the Netherlands, women are less likely to access the Internet from home than men. Gender differences in workplace access are both unfavorable and favorable to women: they are to the detriment of women in Austria, Korea, Luxembourg, the Netherlands and Norway, and to their benefit in Finland, Poland and the Slovak Republic.
Table 6: Places where Internet has been Used1 by Women and Men2, Selected Countries, 2005
Source: Eurostat, Newcronos database 2006, Statistics Canada, Australian Bureau of Statistics, and Brazilian Network Information Center.
At home At work At place of education 3 At other people’s house
Women M en Women M en Women M en Women M en
Netherlands 93.4 93.1 40.1 50.9 10.3 11.0 3.6 3.9 Denmark 92.7 93.3 47.7 48.7 14.9 13.7 .. .. Luxembourg 92.3 94.5 28.3 45.4 14.9 13.1 3.1 4.9 Iceland 87.5 91.5 52.3 56.1 19.7 20.0 11.5 15.5 Germany 86.1 89.0 27.7 34.0 12.9 14.6 6.3 10.0 Sweden 84.8 88.7 47.7 49.7 16.8 12.5 5.1 7.2 Norway 83.0 85.7 54.0 62.3 17.9 13.3 7.0 11.0 United Kingdom 83.0 83.2 44.9 48.3 17.5 14.1 21.0 26.9 Belgium 79.4 83.0 29.7 31.4 9.2 7.5 4.8 5.7 Finland 74.1 80.8 53.3 50.8 .. .. 5.5 9.1 Austria 73.6 75.2 41.4 47.7 9.4 8.3 1.9 3.8 Italy 68.9 74.1 44.8 49.1 13.5 9.9 9.3 12.1 Ireland 66.8 71.1 44.4 47.2 10.9 9.7 6.3 9.2 Greece 60.9 65.9 40.4 46.5 18.9 14.8 10.0 13.1 S pain 60.7 65.9 44.2 47.2 19.9 17.5 23.3 24.1 Canada 60.3 61.5 25.2 27.4 11.3 12.0 .. .. Czech Republic 59.9 62.9 43.2 43.8 23.2 19.7 6.5 7.0 Portugal 58.4 63.2 47.0 49.3 28.6 20.7 13.8 15.5 Poland 56.5 59.5 34.2 29.3 28.1 28.7 15.4 18.9 Hungary 52.8 59.0 43.9 46.5 18.9 19.8 15.5 15.3
15
Although accessing the Internet at educational establishments is less common compared with at work or at home, women in all the selected countries are generally more likely to access the Internet from these places than men (Brazil, Canada, Germany, Hungary, the Netherlands, Poland are an exception).
4.4 Patterns of ICT Use
Once accessed, women and men may have different usages online which lead to many studies of various gender-specific usage patterns with the focus on differences in how women and men use ICT (Bonfadelli, 2002). It is found, for instance, that: girls tend to exchange instant messaging and chat online by Internet, whereas boys would download games and music, conduct business and trading online, and create Web pages of their own (Lenhart, Rainie, & Lewis, 2001; Roberts and Foehr, 2004); women regard the Internet as an efficiency booster, keeping family plans and reading at magazine, health and retail sites for helpful information to aid their daily routines, while men like downloading software programs and use the Internet as a form of fun in spare time; (Janis, 2011); women like the Internet for the human connections it promotes, while men like it for the experiences it offers (PEW/INTERNET, 2005). Similar but more inclusive findings in this regard are made by Buchmuller, et al. (2011, p. 756):
● Women used ICT more for emotional or organizational connectedness.
● Women were more concerned about interpersonal communication or care for others, while men used ICT in a more self-referential way.
● Men used ICT more for entertainment purposes throughout all generations.
● ―Availability‖ and ―asking for help‖ were critical and ambivalent issues for women, while men stated not having any problems being unavailable or out of reach for others.
● Women were generally concerned with more and diverse topics (e.g., privacy, friendship, partnership, children, family, housekeeping, care, traveling, health, wellness, fitness, emotions, beauty, and style) than men (professional life, entertainment, and health).
● Women‘s lives posed more challenges in coordinating different life spaces as well as mediating between their own and other people‘s needs.
Australia 50.0 53.0 28.0 31.0 9.0 8.0 20.0 18.0
Brazil 46.5 37.6 31.2 21.7 17.1 25.5 18.7 16.6
Slovak Republic 34.0 45.4 56.2 51.8 23.7 20.3 22.1 24.5
1. Used in the last three months for EU countries, past 12 months for Australia and Canada.
2. People aged 16 to 74 for EU countries, 10 and over for Brazil, and 18 and over for Australia and Canada. 3. Technical and further education or Tertiary Institution for Australia, school for Canada and Brazil. Rearranged from OECD: Working Party on the Information Economy, ICT AND GENDER, p. 35
16
● Women often regarded ICT from a perspective of daily purposefulness and anticipated less technical limits than men, while men were more qualified in more technical details and showed a higher degree of technical differentiation.
Table 7 below ranks online categories in two columns, each being followed by the shares of both females‘ and males‘ total time online. The index value listed in a descending order for each column points out the relative degree by which females are more likely to stay at a certain category when compared to males. Indices above 100 indicate categories at which females spend more than their ‗fair share‘ of time online. Conversely, indices under 100 imply categories at which females spend less than their ‗fair share‘ of time online.
Table 7: S hare of Time S pend Online: Females vs. Males
Worldwide Audience (15+ accessing from Work or Home), April 2010 Source: M edia M etrix Worldwide
Site categories Females Males Index Site categories Males Females Index
Social networking 16.3% 11.7% 139 M ultimedia 6.3% 5.2% 82
Instant messengers 11.3% 10.4% 108 Search/Navigation 2.9% 2.8% 96
Email 7.7% 6.8% 114 Directories/Sources 2.4% 2.2% 91
Retail 2.9% 2.4% 120 Business/Finance 1.7% 1.5% 89
Online gaming 2.7% 2.2% 124 Auctions 1.6% 1.5% 98
Community 2.2% 1.8% 123 General news 1.1% 0.9% 79
Education 1.1% 0.8% 140 Banking 0.8% 0.7% 97
Photos 1.0% 0.8% 125
Blogs 0.9% 0.8% 120
From comScore: Women on the Web, How Women are Shaping the Internet, June, 2010, p. 7
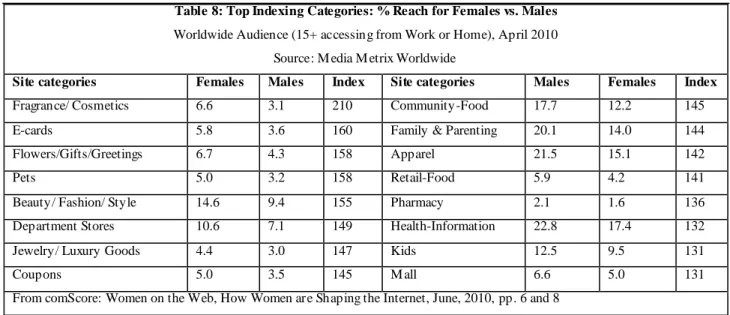
Approaching the question from a related but slightly different point of view, Table 8 below offers the highest reach indices for women compared to men, revealing the categories in which the difference between male and female behavior is greatest. It‘s not terribly surprising that women over-index most heavily in the following categories: Fragrances/Cosmetics (210), E-cards (160), Flowers, Gifts and Greetings (158) and Pets (158).
17
Table 8: Top Indexing Categories: % Reach for Females vs. Males
Worldwide Audience (15+ accessing from Work or Home), April 2010 Source: M edia M etrix Worldwide
Site categories Females Males Index Site categories Males Females Index
Fragrance/ Cosmetics 6.6 3.1 210 Community-Food 17.7 12.2 145
E-cards 5.8 3.6 160 Family & Parenting 20.1 14.0 144
Flowers/Gifts/Greetings 6.7 4.3 158 Apparel 21.5 15.1 142
Pets 5.0 3.2 158 Retail-Food 5.9 4.2 141
Beauty/ Fashion/ Style 14.6 9.4 155 Pharmacy 2.1 1.6 136
Department Stores 10.6 7.1 149 Health-Information 22.8 17.4 132
Jewelry/ Luxury Goods 4.4 3.0 147 Kids 12.5 9.5 131
Coupons 5.0 3.5 145 M all 6.6 5.0 131
From comScore: Women on the Web, How Women are Shaping the Internet, June, 2010, pp. 6 and 8
Table 9 below indicates that although social networking varies in its relative importance — reflective, perhaps, of overall cultural differences, no matter in what region they are across the world, women are consistently more social on the Internet than their regional, male counterparts. For the Internet and online knowledge networking provide open space for them to freely voice and share their opinions, stories, worries and experiences, which is also conducive to their empowerment (Jain, 2006). Studies by individual researchers arrive at the same conclusion that females are more social online: women are more likely to use emails to stay in touch with relatives (Boneva, Kraut, & Frohlich, 2001); girls aged 15-17 years old spend more time online than boys of the same ages and are more likely to use emails, instant messaging, and text messaging through mobile phones (Valkenburg, 2004). In using emails, forums, instant messages, getting health and spiritual information, and playing online interactive games, women can enlarge the scope of activities and participate in discussions previously beyond their capacity. Among college students, gender continues to be a significant predictor of types of Internet use. For instance, Fortson et al. (2007) confirms that male college students are more likely to use the Internet for recreation, whereas female college students tend to surf the Web for communicative and educational ends.
Table 9: S hare of Time S pent on S ocial Networking, Email, and IM
Worldwide Audience (15+ accessing from Work or Home), M arch 2010 Source: M edia M etrix Worldwide
% of Total Minutes % of Total Minutes for Females 18+
Region Female 18+ Male 18+ S ocial networking E-mail Instant Messenger
World-Wide 33% 27% 15% 8% 11%
Latin America 52% 45% 18% 10% 24%
Europe 37% 30% 19% 6% 12%
North America 30% 25% 13% 13% 4%
Asia Pacific 20% 17% 10% 4% 6%
18
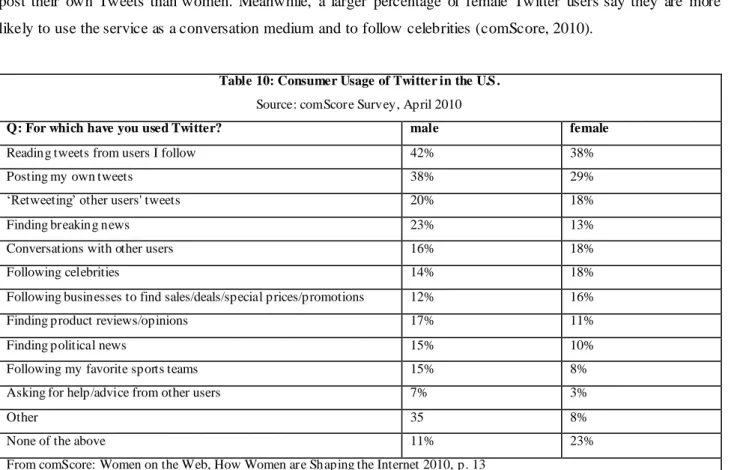
Twitter seems,however, to vary in its function for women versus men by context. In an April 2010 comScore survey (Table 10), consumers in US are investigated about how they use Twitter. Though the site has been proved pleas ing to both genders, it is not surprising that men and women differ in Twitter uses. Men are far more likely to post their own Tweets than women. Meanwhile, a larger percentage of female Twitter users say they are more likely to use the service as a conversation medium and to follow celebrities (comScore, 2010).
Table 10: Consumer Usage of Twitter in the U.S .
Source: comScore Survey, April 2010
Q: For which have you used Twitter? male female
Reading tweets from users I follow 42% 38%
Posting my own tweets 38% 29%
‗Retweeting‘ other users' tweets 20% 18%
Finding breaking news 23% 13%
Conversations with other users 16% 18%
Following celebrities 14% 18%
Following businesses to find sales/deals/special prices/promotions 12% 16%
Finding product reviews/opinions 17% 11%
Finding political news 15% 10%
Following my favorite sports teams 15% 8%
Asking for help/advice from other users 7% 3%
Other 35 8%
None of the above 11% 23%
From comScore: Women on the Web, How Women are Shaping the Internet 2010, p. 13
In short, as indicated by findings above, gender differences in specific uses of the Internet do clearly seem to exist, but they appear to result primarily from differences in Internet experience. Although this understanding agrees with the present findings, it is only tentative at best. In summary, results from above investigations show that women use the Internet primarily for interpersonal communication and educational assistance, whereas males use it often for purposes related to entertainment and leisure.
CHAPTER FIVE: IMPORTANT ASPECTS OF GENDER DIGITAL DIVIDE Fewer Economic Resources, Lower Levels of Awareness Literacy and Education, Gendered ICT Training, Gendered ICT Sector
Different socioeconomic and cultural variables determine the adoption and effective use of ICT, thus creating a digital divide or more specifically a gender digital divide, the focus of this study. Dimensions of gender digital divide have been explored by researchers and organizations. Walterova(2012) finds that apart from age, education and income, other major contributes to gender digital divide are: ―geographical factors‖, ―gender inequality‖, ―lack of computers at home‖, ―lack of computers available for the public from government/municipalities‖, lack
19
of basic ICT skills‖, and ―permanent social isolation‖. (p. 349). ICRW (2010) lists four barriers hindering women‘s access to and use of technologies:
Exclusion from technology education and design — not only do men overwhelmingly constitute the users of diverse types of technologies worldwide, but they also dominate the innovation process as developers, creators, and designers; little free time — across developing countries, women bear a disproportionate burden of household and family responsibilities, such as cooking, cleaning, and fetching fuel or water, as well as child and elder care; social norms favoring men — throughout the world, technologies are often considered to be within the purview of men; financial and institutional constraints — women tend to lack the financial resources to use, rent, or purchase established and new technologies.(p. 7)
Warschauer (2003b) states that the determining variables could be divided into four groups, namely: physical — computers and connectivity; digital — content and language; human — literacy and education; and social — communities and institutions.
A two-group division developed by Bridges.org (2002) and used to assess the extent to which ICT is usefully available, not just physically present, encompasses a range of dimensions as follows:
●Physical Availability —Presence of ICT and connectivity around;
●Non-Physical Availability — Affordability to use;Capacity to use;Locally relevant content and language; Integration into daily routines;Socio-cultural inequality in gender, race, or other soc io-cultural factors; Appropriateness to both local and personal needs and conditions;Trust in ICT in terms of privacy, security, or cybercrime;Legal environment for laws and regulations limiting ICT use;Local economics favorable to ICT use; Macroeconomics in terms of transparency, deregulation, investment, and labor issues; Political will to enable ICT use.
These variables and dimensions shed light on my choice of the most important aspects of gender digital divide to be explored as follows.
5.1Fewer Economic Resources
Studies of ‗digital inequalities‘ reveal that use of ICT reflects inequalities with regard to the access to economic, cultural, and social resources outside them (Hargittai, 2004).
Table 11 below offers information rearranged both on income levels in selected African countries and percentage of individuals using the Internet. In Côte d'Ivoire, only four per cent of the first three quartiles in terms of disposable income are users of the Internet. In comparison, for people earning in the top quartile, Internet use
20
or more than doubled, by men in terms of the percentage using the Internet. As is indicated, in all of the selected African countries, there is both a clear link between income and Internet use and a clear gender divide, with women outnumbered twice by men in most of the selected countries in using the Internet.
Table 11: Percentage of Individuals Aged 16 and Older Using the Internet (%), by Income, in Selected African Countries, 2007/2008*
Source: Research ICT Africa (RIA)
Countries Lowest three
disposable income quartiles
Top disposable income quartile Men ** Women *** Ethiopia 0 3 0.9 0.4 Uganda 1 7 3.7 1.1 Zambia # 1 13 5.6 1.7 Tanzania 1 4 1.9 2.3 Ghana 5 8 8.1 3.2 Côte d'Ivoire 4 14 8.1 4.0 Botswana 2 19 10.1 4.0 Benin 6 16 11.9 5.3 Senegal 9 14 14.4 6.7 Nigeria # 10 22 16.4 7.6 Namibia 4 25 11.2 7.2 South Africa 7 38 20.4 11.3 Kenya 9 32 21.1 11.5
Note: * Surveys were conducted between August 2007 and April 2008 (most countries having finished already in 2007).
† Not nationally representative, but extrapolation was adjusted to reflect the national level.
Source: Research ICT Africa (RIA).
Note: * Surveys were conducted between August 2007 and April 2008 (most countries having finished already in 2007).
** As a percentage of men aged 16 or older. *** As a percentage of women aged 16 or older.
† Not nationally representative, but extrapolation was adjusted to reflect the national level.
Source: Research ICT Africa (RIA). Note: * Surveys were conducted between August 2007 and April 2008 (most countries having finished already in 2007). ** As a percentage of men aged 16 or older.
*** As a percentage of women aged 16 or older.
# Not nationally representative, but extrapolation was adjusted to reflect the national level. Combined from ITU: M easuring the Information Society, 2011, pp. 114 and 118
ICT uses have to be affordable if people are to benefit from them. As with other technological advancements, the possession of computer and Internet determines both how many people will be their user and how often they are used. Therefore it is important that any study of gender digital divide should not only consider and understand building of ICT infrastructure but also take into account the households with computer and Internet.
21
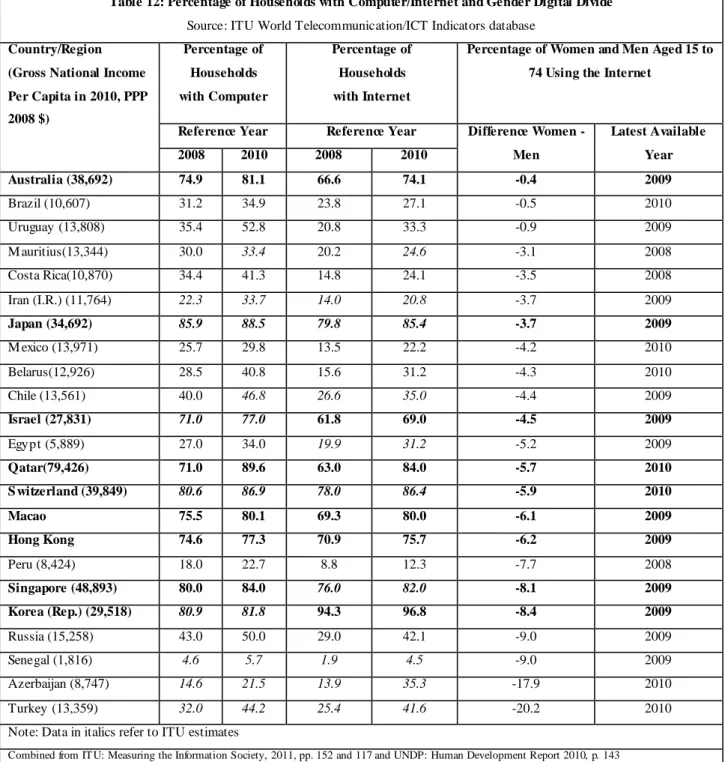
Table 12 below, showing the percentage of households with computer/Internet and the gender digital divide, offers two important revelations. On one hand, the percentage of households with computer and Internet is seen, on the whole, in a direct proportion to the percentage of women and men aged 15 to 74 using the Internet. On the other hand, surprisingly, the blackened relatively developed countries/regions, which are relatively high both in Gross National Income Per Capita and with high percentages of households with computer and Internet, also have an average gender digital divide of – 5.44 in terms of the percentage of women and men aged 15 to 74 using the Internet, as compared with an average gender digital divide of -6.69 for the other relatively less developed countries (as calculated from data of Difference Women – Men in Table 12). This surprising fact indicates that apart from fewer economic resources, there must be other contributes to the gender digital divide which are to be elaborated in details below.
22
Table 12: Percentage of Households with Computer/Internet and Gender Digital Divide
Source: ITU World Telecommunication/ICT Indicators database
Country/Region
(Gross National Income Per Capita in 2010, PPP 2008 $) Percentage of Households with Computer Percentage of Households with Internet
Percentage of Women and Men Aged 15 to 74 Using the Internet
Reference Year Reference Year Difference Women - Men Latest Available Year 2008 2010 2008 2010 Australia (38,692) 74.9 81.1 66.6 74.1 -0.4 2009 Brazil (10,607) 31.2 34.9 23.8 27.1 -0.5 2010 Uruguay (13,808) 35.4 52.8 20.8 33.3 -0.9 2009 M auritius(13,344) 30.0 33.4 20.2 24.6 -3.1 2008 Costa Rica(10,870) 34.4 41.3 14.8 24.1 -3.5 2008 Iran (I.R.) (11,764) 22.3 33.7 14.0 20.8 -3.7 2009 Japan (34,692) 85.9 88.5 79.8 85.4 -3.7 2009 M exico (13,971) 25.7 29.8 13.5 22.2 -4.2 2010 Belarus(12,926) 28.5 40.8 15.6 31.2 -4.3 2010 Chile (13,561) 40.0 46.8 26.6 35.0 -4.4 2009 Israel (27,831) 71.0 77.0 61.8 69.0 -4.5 2009 Egypt (5,889) 27.0 34.0 19.9 31.2 -5.2 2009 Qatar(79,426) 71.0 89.6 63.0 84.0 -5.7 2010 S witzerland (39,849) 80.6 86.9 78.0 86.4 -5.9 2010 Macao 75.5 80.1 69.3 80.0 -6.1 2009 Hong Kong 74.6 77.3 70.9 75.7 -6.2 2009 Peru (8,424) 18.0 22.7 8.8 12.3 -7.7 2008 Singapore (48,893) 80.0 84.0 76.0 82.0 -8.1 2009 Korea (Rep.) (29,518) 80.9 81.8 94.3 96.8 -8.4 2009 Russia (15,258) 43.0 50.0 29.0 42.1 -9.0 2009 Senegal (1,816) 4.6 5.7 1.9 4.5 -9.0 2009 Azerbaijan (8,747) 14.6 21.5 13.9 35.3 -17.9 2010 Turkey (13,359) 32.0 44.2 25.4 41.6 -20.2 2010
Note: Data in italics refer to ITU estimates
Combined from ITU: Measuring the Information Society, 2011, pp. 152 and 117 and UNDP: Human Development Report 2010, p. 143
5.2 Lower Levels of Awareness, Literacy and Education
Levels of awareness, literacy and education related with ICT are an important indicator in measur ing the gender digital divide. Basic literacy and numeracy are required to read and compose simple messages, surf the Internet, and perform commands in software applications. As women account for nearly two-thirds of the world‘s illiterates, and one out of every two women in developing countries is illiterate, they are more likely than men to be in need of the basic literacy and computer skills which would enable them to benefit from the new opportunities provided by the new global communication network(P. Fraser-Abder and J.A. Mehta, 1995).
23
5.2.1 Awareness
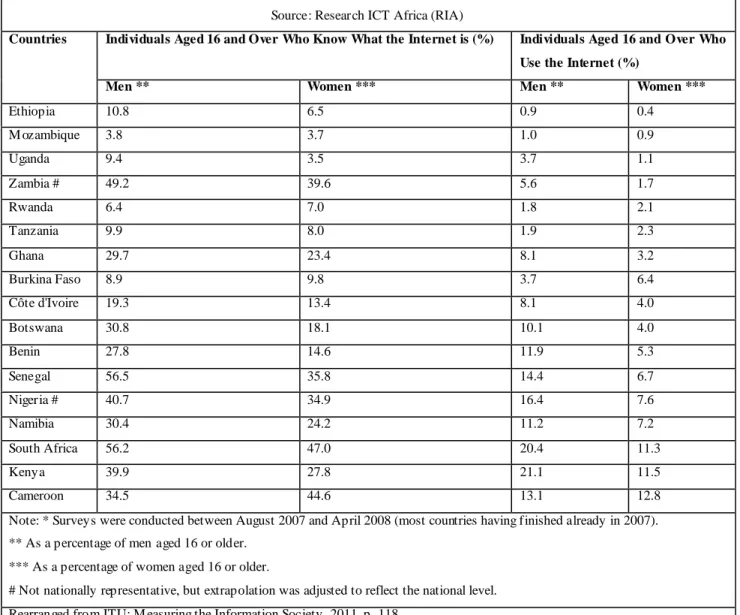
One has to be aware of the existence and benefit of ICT so as to use them. Results from an investigation of African citizens as shown in Table 13 below reveal a seemingly striking fact that a lot of people stay offline simply because they are not aware of the existence of the Internet and what it might bring to them. In Africa, on the whole more women than men are unaware of the Internet and its benefits. In Uganda, Zambia, Ghana, Côte d'Ivoire, Botswana, Benin, Senegal, Nigeria, Namibia, South Africa and Kenya, for example, on the whole, men know more about the Internet and consequently they are more likely to be users of the Internet. In Cameroon where there are as many women as (or more women than) men being aware of the Internet, the digital gender divide, in terms of the Internet use, remains slightly small. While being unaware could be impeding the Internet adoption, other factors, being poor and being illiterate, are likely to function as barriers, too.
Table 13: Knowing about the Internet and Using it: the Gender Divide, 2007/2008*
Source: Research ICT Africa (RIA)
Countries Individuals Aged 16 and Over Who Know What the Internet is (%) Individuals Aged 16 and Over Who Use the Internet (%)
Men ** Women *** Men ** Women ***
Ethiopia 10.8 6.5 0.9 0.4 M ozambique 3.8 3.7 1.0 0.9 Uganda 9.4 3.5 3.7 1.1 Zambia # 49.2 39.6 5.6 1.7 Rwanda 6.4 7.0 1.8 2.1 Tanzania 9.9 8.0 1.9 2.3 Ghana 29.7 23.4 8.1 3.2 Burkina Faso 8.9 9.8 3.7 6.4 Côte d'Ivoire 19.3 13.4 8.1 4.0 Botswana 30.8 18.1 10.1 4.0 Benin 27.8 14.6 11.9 5.3 Senegal 56.5 35.8 14.4 6.7 Nigeria # 40.7 34.9 16.4 7.6 Namibia 30.4 24.2 11.2 7.2 South Africa 56.2 47.0 20.4 11.3 Kenya 39.9 27.8 21.1 11.5 Cameroon 34.5 44.6 13.1 12.8
Note: * Surveys were conducted between August 2007 and April 2008 (most countries having finished already in 2007). ** As a percentage of men aged 16 or older.
*** As a percentage of women aged 16 or older.
# Not nationally representative, but extrapolation was adjusted to reflect the national level. Rearranged from ITU: M easuring the Information Society, 2011, p. 118
24
Women in developing countries require more information on the potential of ICT for their individual advancement, a subject that should be increasingly and concertedly pushed forward among all women-related organizations. Women, especially in the developing world, must be made aware of ICT as a tool which can update and increase their access to life-long learning, new job and business opportunities, health information, political participation, and which can even create alternatives and solutions to difficult situations women might face, such as violence, harassment or discrimination.
5.2.2 Literacy
Literacy is ―the ability to understand and employ printed information in daily activities, at home, at work, and in the community — to achieve ones‘ goals and to develop one‘s knowledge and potential,‖ which is determined by reading literacy or prose literacy, namely functional command of common texts; scientific literacy or document literacy, namely identifying evidence, evaluating and communicating conclusions, the understanding and using data in contexts such as maps, tables, forms and charts; and quantitative literacy or mathematical literacy, namely manipulating numbers in circumstances that might be encountered in occupational or private life (OECD, 2000).
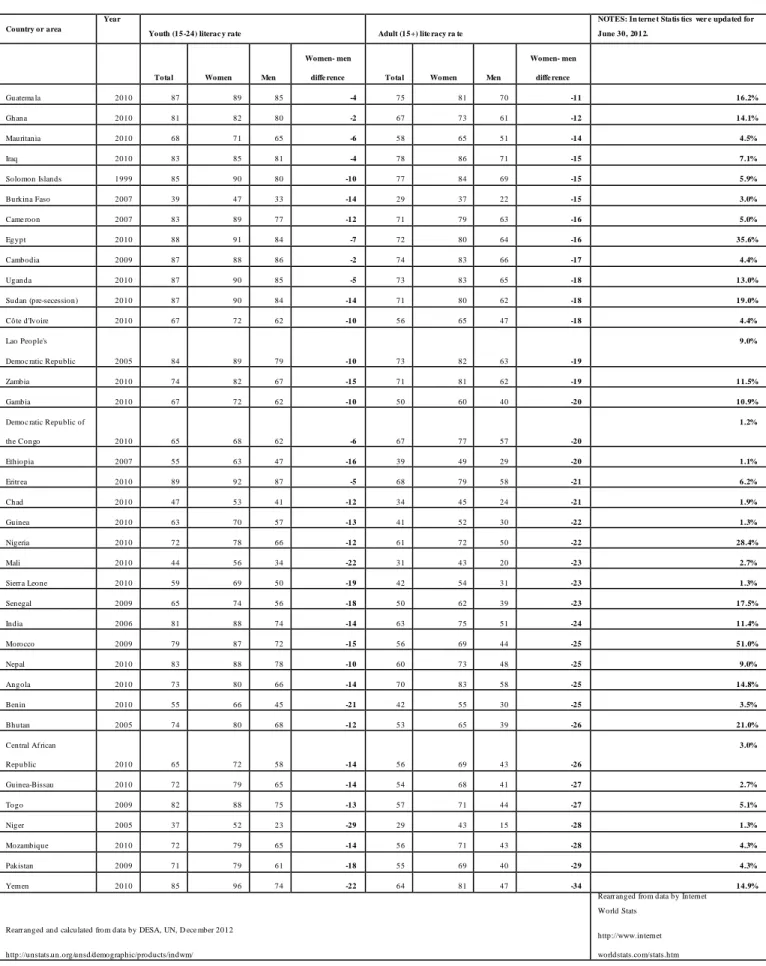
Low literacy levels can affect Internet use by causing frustration with the internet. Across the world, especially in developing countries in Afr ica, Asia, Middle East and Latin Amer ica / Caribbean, the gap between literacy levels by gender is extremely large, some as large as -34%, which is shown (Table 14) in a clear proportion to the corresponding low percentage of population in terms of Internet penetration.
25 Table 14: Statistics and Indicators on Women and Men Lite racy (L eft )
And % Population (Int erne t Pen etration ) ( Far Righ t)
Country or area
Year
Youth (15-24) literac y rate Adult (15+) lite racy ra te
NOTES: In terne t Statis tics wer e updated for June 30, 2012.
Total Women Men
Women- men
diffe rence Total Women Men Women- men diffe rence Guatema la 2010 87 89 85 -4 75 81 70 -11 16.2% Ghana 2010 81 82 80 -2 67 73 61 -12 14.1% Mauritania 2010 68 71 65 -6 58 65 51 -14 4.5% Iraq 2010 83 85 81 -4 78 86 71 -15 7.1% Solomon Islands 1999 85 90 80 -10 77 84 69 -15 5.9% Burkina Faso 2007 39 47 33 -14 29 37 22 -15 3.0% Came roon 2007 83 89 77 -12 71 79 63 -16 5.0% Egypt 2010 88 91 84 -7 72 80 64 -16 35.6% Cambodia 2009 87 88 86 -2 74 83 66 -17 4.4% Uganda 2010 87 90 85 -5 73 83 65 -18 13.0% Sudan (pre-secession) 2010 87 90 84 -14 71 80 62 -18 19.0% Côte d'Ivoire 2010 67 72 62 -10 56 65 47 -18 4.4% Lao People's
Democ ratic Republic 2005 84 89 79 -10 73 82 63 -19
9.0%
Zambia 2010 74 82 67 -15 71 81 62 -19 11.5%
Gambia 2010 67 72 62 -10 50 60 40 -20 10.9%
Democ ratic Republic of
the Congo 2010 65 68 62 -6 67 77 57 -20 1.2% Ethiopia 2007 55 63 47 -16 39 49 29 -20 1.1% Eritr ea 2010 89 92 87 -5 68 79 58 -21 6.2% Chad 2010 47 53 41 -12 34 45 24 -21 1.9% Guinea 2010 63 70 57 -13 41 52 30 -22 1.3% Nigeria 2010 72 78 66 -12 61 72 50 -22 28.4% Mali 2010 44 56 34 -22 31 43 20 -23 2.7% Sierr a Leone 2010 59 69 50 -19 42 54 31 -23 1.3% Senegal 2009 65 74 56 -18 50 62 39 -23 17.5% India 2006 81 88 74 -14 63 75 51 -24 11.4% Morocco 2009 79 87 72 -15 56 69 44 -25 51.0% Nepal 2010 83 88 78 -10 60 73 48 -25 9.0% Angola 2010 73 80 66 -14 70 83 58 -25 14.8% Benin 2010 55 66 45 -21 42 55 30 -25 3.5% Bhutan 2005 74 80 68 -12 53 65 39 -26 21.0% Central Af rican Republic 2010 65 72 58 -14 56 69 43 -26 3.0% Guinea-Bissau 2010 72 79 65 -14 54 68 41 -27 2.7% Togo 2009 82 88 75 -13 57 71 44 -27 5.1% Niger 2005 37 52 23 -29 29 43 15 -28 1.3% Mozambique 2010 72 79 65 -14 56 71 43 -28 4.3% Pakistan 2009 71 79 61 -18 55 69 40 -29 4.3% Yemen 2010 85 96 74 -22 64 81 47 -34 14.9%
Rearr anged and calculated from data by DESA, UN, D ece mber 2012
Rearr anged from data by Internet World Stats
26
The causal link between literacy and ICT use can be evidenced even in the developed UK. According to the National Literacy Trust, low levels of internet penetration in the North East could result from literacy levels. In the North East, which has the lowest levels of internet use in the UK, at just 29%, there are one in six people struggling with literacy; and a US study has also found that people with low levels of literacy often have problems using websites. People with low levels of literacy feel ―frustrated and exhausted‖ when it comes to using the internet according to the Nielsen Norman Group (BBC, 2010).
5.2.3 Education
Investigations of Internet use by level of education across the world indicate without exception that Internet is used much more among users with higher level of education, because a higher educational level generally leads to higher income and greater computer literacy which are important driving force of Internet use. Chart 1 below suggests that in the selected African countries, there is a direct correlation between level of education and level of Internet use. As is indicated, while few Africans with only a primary education are online in 2007/2008, the major ity of those with a tertiary education are using the Internet. At the same time, even the more highly educated population differ considerably in Internet user penetration rates, with Rwanda standing at over 90 per cent and Uganda at less than 20 per cent.
Chart 1: Percentage of Individuals Aged 16 or Older Using the Internet, by Highest Educational Level Attained in Selected African Countries, 2007/2008
Source: Research ICT Africa (RIA)
Note: * Surveys were conducted between August 2007 and April 2008 (most countries having finished already in 2007).
† Not nationally representative, but extrapolation was adjusted to reflect the national level. From ITU:M easuring the Information Society, 2011, p. 113
Many factors contribute to a female‘s level of education. Elnaggar (2008) finds that family support or its non-existence affects nearly all women's decisions. The family approval is vital in women's choice of education,
27
occupational field, workplace location, as well as working hour‘s length (Chatty, 2000). In her study on the obstacles to female formal educational attainment in Ghana, Amua-Sekyi (1998) finds that the value of reproductive and traditional duties of females are generally considered higher than the accomplishments such as education and career. Because societal ideas of female roles are more domestic or concerning marriage and raising children, girls are expected not to achieve much in formal education. Social class factors also influence the state of a female‘s level of education. High social class status of women may remove for them some of the barriers they face in getting a higher education. An example of this is that upper class women would pay for domestic labor by other women in order to pursue their own educational goals (King & Hill, 1993). This phenomenon could be found in many developed and developing countries.
There are also barriers which arise due to the ways in which institutions make their education programs available, for example: fixed hours; attendance requirement; lack of childcare facility. In the case of scientif ic and technical studies, further barriers experienced by women include: lack of female teachers, male orientation in courses, inflexible entry requirements, heavy attendance requirements, male oriented language (Evans & King, 1991).
Other barriers to girls' education can be health-related issues, situations of crisis and instability, no school close to home, poor quality environment, violence (physical and psychological), poor quality content, inadequate learning materials, biased or inappropriate content, poor quality learning processes, conflict and instability, inadequate legal framework in such areas as compulsory education, child labor and re-entry into school, lack of enforcement of existing laws and policies relating to corporal punishment and unlawful school fees, insufficient national budgetary allocations to primary and secondary education, isolation of education from existing national frameworks, lack of political will (UNICEF, 2002).
5.3 Gendered ICT Training
Worldwide, women are seriously under-represented in the training of computer science and computer engineering (CS/CE) and, thus, in the ICT workforce across the world. This is a grim situation for both the women whose potential remains unutilized and the societies which are dependent on women‘s contribution to ICT.
The gender differences in training trajectories originate ear ly and become larger as young males and females continue their schooling. This can be illustrated by data from UNESCO/UIS database (The World bank, 2012) that ―In 63 percent of countries (109 of 172), the fraction of women enrolled in general secondary education is higher than that of women enrolled in vocational secondary education (The World Bank, 2012, p. 115)‖ where ICT training is more likely to be offered. The causes of this difference may be found in varieties of studies of primary and secondary schools in which girls not only report less experience with computer programming (Barron, 2004) but also express less confidence in their computing and Internet skills (Bunz, 2005) and less interest in computers (Vale & Leder, 2004).