Private operators and time-of-day tolling
on a congested road network
January 1, 2007
André de Palma
Université de Cergy-Pontoise and ENPC Member of the Institut Universitaire de France
Thema, 33 Bd du Port, F-95011 Cergy-Pontoise
FRANCE
andre.depalma@u-cergy.fr
Robin Lindsey (Corresponding author) Department of Economics University of Alberta Edmonton, Alberta CANADA T6G 2H4 Telephone: 1-780-492-7642 FAX: 1-780-492-3300 rlindsey@ualberta.ca Fang Wu Department of Marketing School of Business University of Alberta Edmonton, Alberta CANADA T6G 2H4 fangw@ualberta.ca
Abstract
Private-sector involvement in the construction and operation of roads is growing around the world and private toll roads are seen as a useful tool in the battle against congestion. Yet serious concerns remain about exercise of monopoly power if private operators can set tolls freely. A number of theoretical studies have investigated private toll-road pricing strategies, and compared them with first-best and second-best public tolls. But most of the analyses have employed simple road networks and/or used static models that do not capture the temporal dimension of congestion or describe the impacts of tolling schemes that vary by time of day.
This paper takes a fresh look at private toll road pricing using METROPOLIS: a dynamic traffic simulator that treats endogenously choices of transport mode, departure time and route at the level of individual travellers. Simulations are performed for the peak-period morning commute on a stylized urban road network with jobs concentrated towards the centre of the city. Tolling scenarios are defined in terms of what is tolled (traffic lanes, whole links, or toll rings) and how tolls are varied over time.
Three administration regimes are compared. The first two are the standard polar cases: social surplus maximization by a public-sector operator, and unconstrained profit maximization by a private-sector operator. The third regime entails varying tolls in steps to eliminate queuing on the tolled links. It is a form of third-best tolling that could be implemented either by a public operator or by the private sector under quality-of-service regulation.
Amongst the results it is found that the no-queue tolling regime performs favourably compared to public step tolling, and invariably better than private tolling. Another provisional finding is that a private operator has less incentive than does a public operator to implement time-of-day congestion pricing.
Private-sector involvement in the construction and operation of roads is growing around the world. There are several reasons for this trend. First, public funding is insufficient to keep up with needs for building and maintaining roads. Second, the principle of user-pays is now widely accepted, and user charges are perceived as an important – if not essential – means of financing infrastructure. Third, the private sector is seen as better at identifying attractive investment projects, and able to build infrastructure more quickly and cheaply at lower risk. Fourth, commercial pressures can spur private operators to achieve lower maintenance, toll collection and other operating costs than the public sector. And fifth, economic theory suggests that private firms have an incentive to account for the congestion and other user costs borne by their
customers.1 Indeed, private roads have been promoted by various economists since Knight (1924) – who criticized Pigou (1920) on the grounds that, in a competitive market, efficient charges would be levied on roads and there would be no role left for government.2
The merits of private roads notwithstanding they are still widely opposed. The overriding objection is that a private operator will exercise its monopoly power and gouge travelers. Indeed, in some countries availability of reasonable toll-free alternative routes (or at least good public transport services) is required by law as a precondition even for public toll roads. However, competition reduces the profitability of roads, and concession agreements sometimes include non-compete clauses that prohibit construction or improvement of alternatives.3
A number of studies have analyzed the allocative efficiency of private roads. A majority follow the lead of Pigou (1920) and Knight (1924) and consider a simple road network with one origin and one destination connected by two parallel routes. The main insights from these studies will be reviewed in Section 2. A few studies have adopted a simulation approach and examined the behaviour of private operators on larger road networks.4 However, except for the
two-1
See for example Spence (1975), DeVany and Saving (1980) and Mohring (1985).
2
Other notable proponents amongst economists and engineers include Block (1979, 1983), Roth (1996), Poole (1996, 2003), Winston (2000) and Samuel, Poole and Holguin-Veras (2002). See also the various contributions in Roth (2006).
3
The “problem” of competition from free roads can be alleviated by compensating a private operator using shadow tolls based on traffic counts. But this of course does not constitute road pricing in the traditional sense, let alone congestion pricing.
4
See Yang and Woo (2000), Yang, Tang, Cheung and Meng (2001), Yang, Zhang and Meng (2003), Zhang and Levinson (2004) and Xiao, Yang and Han (2005).
parallel-routes studies by De Palma and Lindsey (2000, 2002) there has been no analysis of time-of-day pricing by private operators.
Since congestion is inherently a dynamic phenomenon, and since most roads are links on networks, including both dynamics and networks should be a high priority for studying
congestion and congestion pricing. There is a growing literature on dynamic congestion pricing on public (i.e. social-surplus maximizing) toll roads5, but – as just noted – very little yet for private roads. Furthermore, although many toll roads around the world are privately operated, most are regulated – and many do not get congested – so that there is little practical experience to draw on.
The goal of this paper is to help begin to fill the gap. An obvious priority for the analysis is to include not only a road network but also a satisfactory specification of trip-timing decisions in order to assess the impacts of tolling schemes that vary by time of day. Unfortunately,
computation of second-best tolls on medium- and large-scale networks is computationally challenging even with static models (Verhoef, 2002) and with dynamic models analytical solutions are impossible even on relatively simple networks (De Palma, Lindsey and Quinet, 2004). Similar difficulties arise with computation of profit-maximizing tolls. The paper therefore takes a simulation approach using the software METROPOLIS: a dynamic traffic simulator in which transport mode, departure time and route choice decisions are modeled endogenously at the level of individual travellers.
The analysis is focused on two considerations: the allocative efficiency of tolling by private operators, and the profitability of employing time-of-day tolls vis à vis flat (time-invariant) tolls. Three tolling regimes are featured. The first two are the standard polar cases: social surplus maximization by a public-sector operator, and unconstrained profit maximization by a private-sector operator. Hereafter, they are referred to as public tolling and private tolling. Since all the tolling configurations considered cover only part of the road network (see Section 3), public tolling is an exercise in second-best pricing in which the impacts of tolling on usage of the untolled infrastructure must be accounted for. In contrast, private tolling disregards network spillover effects except to the extent that they affect traffic volumes on the toll road(s).
5
The third tolling regime to be considered was introduced in De Palma, Kilani and Lindsey (2005b) and dubbed no-queue tolling.6 It entails setting time-varying tolls to suppress queuing on the tolled links without reducing throughput below capacity. As discussed in De Palma, Kilani and Lindsey (2005b) although no-queue tolling is a third-best pricing scheme it has several merits. One is that no-queue tolling only requires information on traffic flows and delays on the tolled links, whereas the formulae for second-best tolls include information on demand and link capacities throughout the network (Verhoef, 2002). A second advantage is that
eliminating queues is a well-defined and readily explained goal that is likely to be more saleable to politicians and the public than complicated second-best schemes. Third, though no-queue tolling has not been adopted as a third-best policy per se anywhere in the world, High
Occupancy Toll (HOT) lane projects in the US7, as well as the electronic road pricing system in Singapore, embody similar or effectively identical goals to no-queue tolling. 8 Fourth,
eliminating queues without compromising throughput is a visible and hence verifiable objective that could be delegated to a private-sector operator under a quality-of-service type contract. For this reason no-queue tolling is treated agnostically here rather than classifying it as “public” or “private”.
The public and no-queue tolling regimes were studied in De Palma, Kilani and Lindsey (2005b). To achieve economies of scope this paper uses the same road network and avails itself of some of the simulation results in De Palma, Kilani and Lindsey (2005b). It goes further by adding the private tolling regime, adding a lane-tolling configuration, and exploring some of the earlier results in greater depth.
Section 2 provides a selective and analytical review of the literature on congestion pricing on public and private toll roads. Section 3 presents a brief overview of the METROPOLIS software and explains the simulation experiments. Section 4 describes the simulation results, and Section 5 concludes.
6
No-queue tolling is equivalent to the “fine toll” studied by Vickrey (1969) and Arnott et al. (1990, 1993) with the bottleneck model.
7
Five HOT lane facilities are currently in operation: State Route 91 and Interstate 15 in California, Interstate 10 & US 290 in Houston, Texas, and Interstate 394 in Minneapolis-St. Paul. A rapidly growing number of additional facilities are being planned.
8
The toll schedules in Singapore are adjusted every three months to maintain a speed range of 45 to 65 km/h on expressways and 20 to 30 km/h on arterial roads (Singapore Land Transport Authority, 2007). Similar rules are employed for the toll roads in Santiago de Chile (Commission for Integrated Transport, 2005).
2 RELATED LITERATURE
Most studies that consider the allocative efficiency of second-best (public) and/or private tolling have employed a prototypical road network with one origin and one destination connected by two routes in parallel. This network will be called the two-links-in-parallel network. The summary here is modeled on Verhoef et al. (1996).9
Suppose that one of the two links is tolled. Call it Link T and the other (free) link Link F. Let and denote the numbers of users of the links, and
T
N NF C NT
( )
T and the respectiveprivate user costs. Further, let
(
F F
C N
)
( )
p N be the inverse demand curve for trips where
is the total number of users. Assume that any operating and maintenance costs on the links are independent of usage. The second-best (public) toll on Link T works out to
T F N =N +N TPub T T T F F F p N C N N C N p N N τ = ∂ − ∂ ∂ ∂ ∂ ∂ ∂ + ∂ ∂ ∂ F F C N , (1)
where ∂ ∂p N is the absolute slope of the inverse demand curve. The profit-maximizing (private) toll is10 TPriv T T F F T F F C N p N C N N C N p N τ = ∂ + ∂ ∂ ∂ ∂ ∂ ∂ ∂ + ∂ ∂ NT. (2)
Consider first τTPub in equation (1). The first component,
(
∂CT ∂N NT)
T, corresponds to the Pigouvian (first-best) toll on Link T. The other component is a second-best adjustment to reflect that tolling Link T induces some users to shift onto Link F and exacerbate congestion there. The adjustment is a fraction of the first-best toll on Link F,(
∂CF ∂NF)
NF, where the fraction is larger the less elastic is demand (i.e. the larger is ∂ ∂p N ) and hence the larger the proportion of users leaving LinkT who shift onto LinkF rather than forego a trip. Overall, the second-best toll is higher the larger the fraction of traffic that takes Link T (i.e. the shorter and faster is T relative to F) and the more congested is T relative to F.Whereas the second-best toll is below the Pigouvian toll, equation (2) shows that the private toll is marked up above it. The markup is higher: (a) the more congestion-prone is Link F (larger
9
A similar analysis was undertaken independently by Gronau (1999).
10
F
C N
∂ ∂ F) and hence the more rapidly it becomes unattractive as a substitute if traffic attempts to divert off Link T, (b) the less elastic is travel demand (larger ∂ ∂p N ), and (c) the more traffic uses Link T (higher ); i.e. the larger the number of inframarginal users on the toll road and hence the less elastic is the demand curve facing the toll operator.
T N
11
In contrast, the public toll given in equation (1) is a decreasing function of factors (a) and (b). The gap between the public and private tolls is therefore larger the less elastic is demand and the larger the fraction of total road capacity that is tolled. If the gap is large enough, private tolling may be welfare-reducing relative to no tolls.
In addition to tolling one of the two links, Verhoef et al. (1996) consider tolling both links. Under public operation this permits a first-best optimum to be reached. Under private ownership the operator is a monopolist, and the distortion due to exercise of monopoly power is at a
maximum. However, congestion is relieved on the whole network so that there is no longer a misallocation of traffic between links. Verhoef et al. show that, depending on parameter values, the monopoly outcome may be preferable to having the private operator toll only one link. Consequently, it is not always optimal to restrict a private operator to the smallest practical segment of a road network.
De Palma and Lindsey (2000, 2002) add to the Verhoef et al. (1996) model a time dimension by applying the Vickrey (1969) bottleneck model to each link and considering time-varying tolls. They show that the welfare effects of private tolling are more favourable with time-varying tolls since this allows differentiation between peak and off-peak usage and encourages the operator to attract more users during the off-peak. Nevertheless, the tradeoff between congestion relief and market power is still present as a determinant of how the welfare effects of tolling vary with the fraction of capacity that is tolled.
Verhoef and Small (2004) extend the Verhoef et al. (1996) model in two other ways. First they add a third link downstream of (i.e. in series with) the two parallel links. The formula for the second-best toll on the upstream tolled link now includes a positive adjustment term that reflects the benefit of reducing congestion on the downstream link. Second, Verhoef and Small
11
In the limit as ∂CF ∂NF → ∞ the operator of Link T becomes a monopolist and the markup term approaches T
p N N
(2004) introduce heterogeneity across travelers in values of travel time. Tolling one of the parallel links (or setting differentiated tolls on both) offers travelers with high values of time a high-quality/low-congestion alternative. This tends to raise the benefits from both public and private-sector tolling, although it is not obvious in general how this affects the difference in welfare between the regimes.12
One final result from the literature deserves mention: profitability is neither a necessary nor a sufficient condition for a toll road to be socially beneficial (Mills, 1995; Yang and Meng, 2000). Whether or not private road operation is socially beneficial depends on road network
connectivity. If the network is well connected, then reasonable substitutes are likely to exist and competition will be beneficial (Roson and van den Bergh, 2000).
3
THE MODEL
The simulation experiments in the paper were performed using METROPOLIS: a dynamic simulator that treats endogenously transport mode, departure time and route choice decisions of individual travellers. Amongst other applications METROPOLIS has been used to study second-best and third-second-best tolling on medium-sized laboratory networks (De Palma, Kilani and Lindsey, 2005a,b), simple tolling schemes on large-scale real networks (De Palma and Lindsey, 2006) and the welfare distributional effects of tolling (Lindsey, 2004). However, this is the first application of METROPOLIS to tolling for the purpose of profit-maximization.
METROPOLIS has been extensively documented elsewhere13 and the description here is accordingly brief. METROPOLIS uses a two-stage nested logit model with a binary choice between automobile and public transport in the outer nest, and a continuous choice of departure time in the inner nest. Route choice is governed by a heuristic based on minimization of travel time.14
marginal cost. Since marginal cost is assumed to be zero, the firm operates at the point where the price elasticity of demand is minus one.
12
Using an analytical model with two routes Calcott and Yao (2005) show that when travelers differ in values of time toll differentiation is socially efficient but may not emerge under duopolistic competition.
13
See De Palma, Marchal and Nesterov (1997) and De Palma and Marchal (2002).
14
3.1 Travel demand
The generalized cost of the automobile mode includes three components: travel time cost, schedule delay cost (the cost of arriving early or late), and toll payments – all of which may depend on departure time, t. Travel time cost is αA AT t
( )
, where TA denotes travel time by automobile (A) and αA the unit cost of time (i.e. the value of travel time savings). If the traveller arrives at the final destination outside the “on-time” arrival window * *,
t t
⎡ − Δ + Δ⎤
⎣ ⎦, a schedule delay cost is incurred with a unit cost of β for early arrival and γ for late arrival. Finally, the aggregate toll paid on a trip, τ , may depend on the route taken as well as the time at which the toll link(s) are used. The generalized cost is therefore:
( )
( )
*( )
( )
*(
0, 0,
A A A A A
C t =α Τ t +βMax⎣⎡ t − Δ − − Τt t ⎦⎤+γMax⎡⎣ t+ Τ t − − Δ +t ⎤⎦ τ t
)
. (3) For the public transport alternative15 the generalized cost of a trip is treated as exogenous and independent of time of day:0
P P P
C =C + Τα P, (4) where TP is travel time by public transport (P) which depends on origin and destination, αP is the unit cost of transit travel time, and includes all other costs (fare, waiting time cost, access and distribution time cost, average schedule delay cost, discomfort, etc.).
0
p C
The specifications in equations (3) and (4) are generic to METROPOLIS. For the simulations in the paper the following parameter values are assumed to be common to all travellers16:
A
α =$10/h, Δ=10 mins, β=$6/h, γ =$25/h, αP=$15/h, Cp0=$10, μmode=$5 and μdept=$2, where μmode and μdept are the logit scale parameters for mode and automobile departure time choices respectively. Parameter is assumed to be uniformly distributed in the population with a mean value of 8:00 AM and a standard deviation of 20 mins. (This distribution is used for all travellers regardless of their origins and destinations.)
*
t
To make the departure time module of METROPOLIS operational, departure times must be constrained to a compact and connected time interval. This interval was set at 6:00 AM - 12:00
15
The generic specification of the “public transport” alternative can encompass not only bus and rail modes but also slow modes (i.e. walking and bicycling). However, the simulations are calibrated for motorized transport; see below.
16
PM. In all the simulations that are undertaken almost all travellers elect to depart after 6:00 AM, and without exception all reach their destinations before 12:00 PM.
3.2 The road network
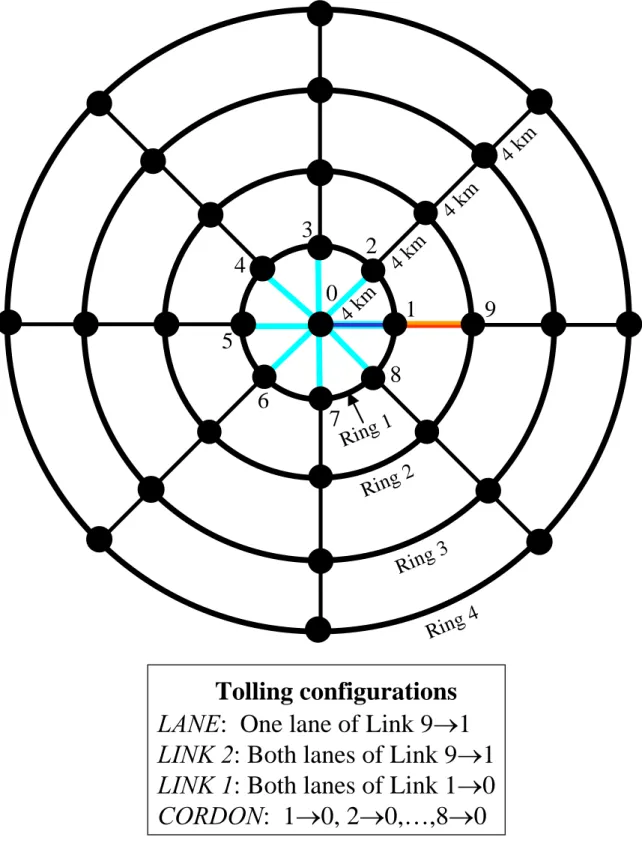
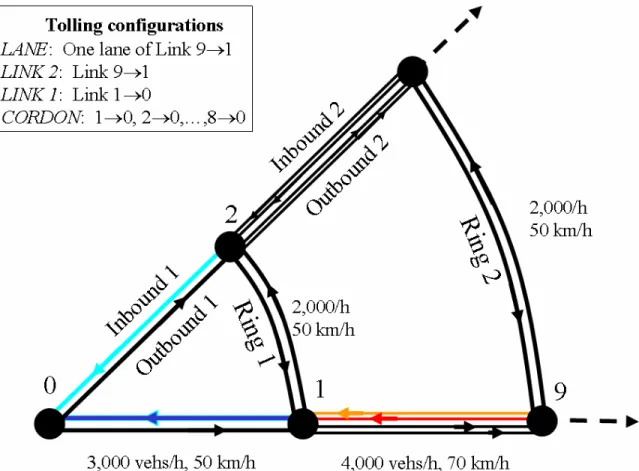
The road network is shown in Figure 1. It consists of four concentric ring roads spaced 4 km apart, and eight arterial roads that run between the city centre (point 0) and the outer ring, Ring 4.17 Figure 2 provides a more detailed view of the inner two rings in the east-north-east octant. The links running clockwise and counterlockwise on all four ring roads have hourly flow capacities of 2,000 vehicles/h and free-flow speeds of 50 km/h. The Inbound 1 and Outbound 1 arterial links joining Ring 1 and the centre have flow capacities of 3,000 vehicles/h and a free-flow speed of 50 km/h. The Inbound 2, Outbound 2, and other arterial links running inwards and outwards between Ring 1 and Ring 4 have flow capacities of 4,000 vehicles/h and free-flow speeds of 70 km/h. These arterial links consist of two lanes, each with a flow capacity of 2,000 vehicles/h. Congestion on all links is assumed to entail queuing. If the arrival rate of vehicles at a link exceeds its flow capacity a (vertical) queue develops.18
The public transport service is assumed to run on the road network using dedicated lanes at a constant speed of 40 km/h. Travel distance by public transport between any two nodes is given by the minimum distance path on the network. The origin-destination matrix is set up to describe the morning commute. Origins (residences) and destinations (workplaces) are located at zones that are joined to each of the 33 intersection nodes marked with solid dots in Figures 1 and 2. Eight thousand individuals live in each zone. The number of individuals who commute to each of the other 32 zones is treated as exogenous and assumed to be an exponentially decreasing
function of the free-flow automobile travel time with an exponential decay rate of –0.07/min.19 Jobs are concentrated towards the city centre because of its higher average accessibility. 3.3 Simulation procedure
Individual choices of transport mode, departure time and route are modified over time in METROPOLIS using a day-to-day adjustment process with exponential learning.20 While this
17
The numbering system for the nodes is used later to define the tolling configurations.
18
Horizontal queuing can be implemented with METROPOLIS but it was not enabled for the simulations.
19
This value is based on estimates for home-based work trips in Krishnamurthy and Kockelman (2003, Table 3).
20
procedure guides the system towards a stationary state, equilibrium conditions are never exactly reached and small-amplitude fluctuations persist indefinitely.21 Depending on the initial
conditions specified, between 25 and 75 days (iterations) are required for the fluctuations to reach a stationary level. In order to identify social surplus and toll revenue with reasonable accuracy, simulations were run for between 150 and 500 days, and (un-weighted) averages were then taken over the last 75 to 450 days. To reduce computation time, the origin-destination matrix and the capacities of each link were reduced to 1/10 of their “actual” scale. Because travel times in METROPOLIS are homogeneous of degree zero with respect to vehicle inflows and link capacities, this scaling has little effect (other than for randomness of individual behaviour) on congestion delays, schedule delays or individual toll payments. When reporting the results in Section 4, vehicle flows, toll revenues and welfare gains are scaled back up to their “actual” levels.
3.4 Tolling Schemes
Tolling schemes are defined by three attributes: the goals of the operator (the tolling regime), the set of links that are tolled (the tolling configuration), and the time structure of the tolls (the tolling schedule). Each of these attributes is treated as exogenous within a simulation and only the level(s) of the toll(s) are a decision variable. As mentioned earlier, three tolling regimes are considered: public, private and no-queuing. In addition, four tolling configurations are studied. These configurations, shown in the legends of Figures 1 and 2, are:
• LANE: one lane of the Inbound 2 arterial link joining node 9 on Ring2 to node 1 on Ring 1 (Link 9 → 1) 22,
• LINK 2: both lanes of Link 9 → 1,
• LINK 1: the Inbound 1 arterial link joining node 1 on Ring 1 to the city centre (Link 1 → 0), and
21
The fluctuations tend to be large on networks that have only a few links, and this effectively precludes the use of METROPOLIS on very small networks. The fluctuations can be dampened by using large values of the departure-time scale parameter (μdept), but large values are not empirically supported and they can induce unrealistic
behaviour.
22
Traffic lanes have no operational significance in METROPOLIS so that it is not possible to set different tolls on different lanes of the same link. To circumvent this, another road network was created with two parallel links between node 9 and node 1, each link with a flow capacity of 2,000 vehicles/h.
• CORDON: a toll cordon defined by tolling the eight Inbound 1 links joining Ring 1 to the centre (Links 1 → 0, 2 → 0, …, 8 → 0.
The LANE configuration resembles the High Occupancy Toll lane scheme in the US except that vehicle occupancy is fixed at one in the simulations and all vehicles pay tolls. The two LINK configurations are representative of numerous toll roads on which all lanes are tolled. And the CORDON toll is suggestive of the cordon schemes in Norway and the congestion pricing scheme tested in 2006 in Stockholm. These four configurations all entail inbound arterial links near the city centre. Apart from the Ring 1 circumferential links, these turn out to be the most congested links and consequently are logical candidates to toll for either a public or a private operator.23 However, the configurations differ greatly in the amount of road capacity that is tolled. For LANE the capacity is just 2,000 vehicles/h, whereas for CORDON it is 24,000 vehicles/h. One of the objectives of the analysis is to assess how the relative efficiencies of the three tolling regimes vary with respect to “market power” defined in this way.
With respect to the time variation of tolls, four tolling schedules are investigated:
• A flat-toll schedule in which the toll is constant throughout the simulated travel period (i.e. 6:00 AM - 12:00 PM). This schedule is considered for the public tolling and private tolling regimes.
• A 30-minute step-toll schedule in which tolls are varied every half hour between 6:30 AM and 8:30 AM (the period during which congestion occurs), and set to zero earlier and later. This schedule is considered for all three tolling regimes.
• A 30-minute step-toll schedule for no-queue tolling. • A 5-minute step-toll schedule for no-queue tolling.
As noted earlier, 5-minute toll steps are selectively employed in Singapore. Six-minute steps can be used on Interstate 15 in San Diego, and 3-minute steps on Interstate 394 in Minneapolis. Short steps are therefore technologically feasible, and the respective authorities have seen fit to adopt them at these sites. However, 30-minute steps are more representative of practice. Furthermore, computation time constraints precluded optimization with METROPOLIS of 5-minute steps for all the tolling schemes under consideration. To provide a fairer comparison with the public and
23
Toll schemes were also computed for Ring 1, but the welfare gains and revenues turned out to be a small fraction of those derived from the CORDON toll. For this reason the results are not reported.
private tolling regimes the 30-minute step no-queue schedule is therefore evaluated in addition to the 5-minute step schedule.
The methods used to compute public and private flat tolls and step tolls, and no-queue step tolls, are described in the Appendix. In computing welfare and toll revenues it is assumed that toll collection and other operating costs are zero.24
4
SIMULATION RESULTS25
4.1 No-tolling regime
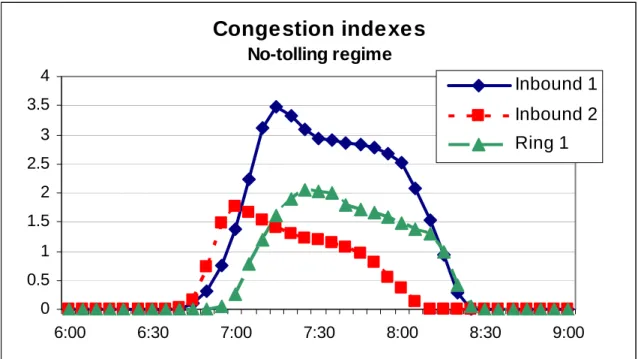
In the absence of tolls about 70 per cent of all trips on the network are made by automobile and the balance by public transport. Automobile trips average 15.0 km in length and 22 minutes in duration at an average speed of 40.9 km/h. The average ratio of queuing delay to free-flow travel time on the route taken is 0.379. Henceforth this ratio will be referred to as the congestion index. The evolution of the congestion indexes on the three most congested types of links are shown in Figure 3 over the period 6:00 AM - 9:00 AM when most trips take place.26 Congestion is greatest on the Inbound 1 links because these feed into the city centre where jobs are
concentrated, and also because these links have a relatively low capacity. Congestion is less severe on the Inbound 2 links, and it peaks slightly earlier because these links lie upstream of the Inbound 1 links. Delays on the Ring 1 links exhibit an intermediate level of intensity.27
4.2 Social optimum
As a benchmark against which to compare the tolling schemes examined in the paper it is useful to know the social or system optimum. As discussed in De Palma, Kilani and Lindsey (2005a) an approximate social optimum can be computed by levying no-queue tolls on all links of the
24
The welfare analysis therefore ignores the potential advantage of private operation in achieving lower costs than public facilities. It also ignores the possibility that varying tolls over time imposes a cognitive burden on individuals when making travel decisions: a factor that militates against complex schemes (Bonsall et al., 2004).
25
As noted earlier some of the public and no-queue simulations undertaken in De Palma, Kilani and Lindsey (2005b) are used in this paper. Descriptions of the results of these schemes and the no-tolling regime are adopted, with some changes in wording, from the earlier paper.
26
The congestion indexes are averages for the eight inbound links each of type Inbound 1 and Inbound 2, and the 16 links of type Ring1.
27
The maximum queuing delays on the Inbound 1, Inbound 2 and Ring 1 links are about 16.8 minutes, 6.0 minutes and 7.7 minutes respectively.
network. This scheme yields a daily welfare gain of about $216,000, or $54 million annually assuming 250 travel days per year.28
4.3 LANE toll
The LANE tolling configuration is of particular interest not only because it resembles the existing HOT lane projects in the US, but also because it corresponds most closely to the two-links-in-parallel literature. For this reason the results are described in some detail.
4.3.1 Flow patterns before tolling
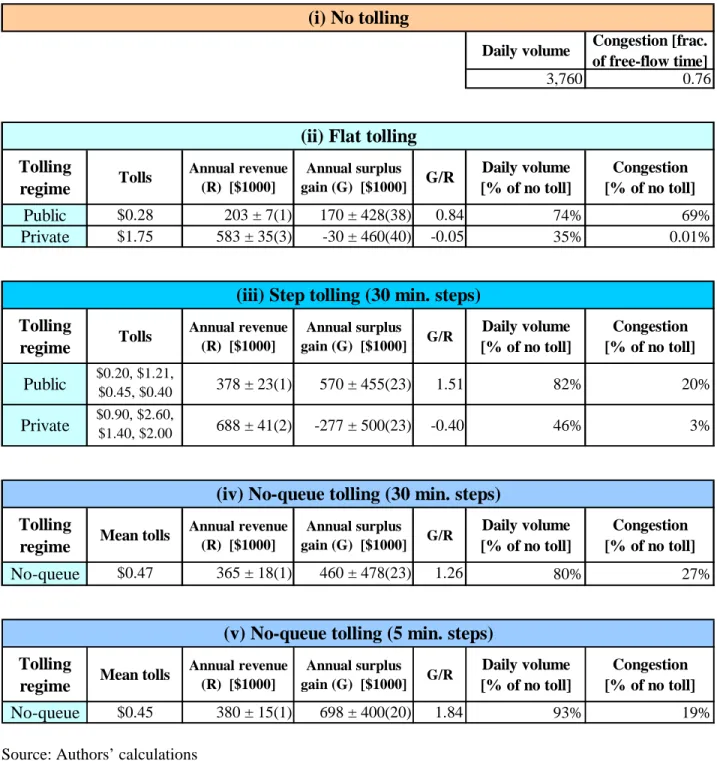
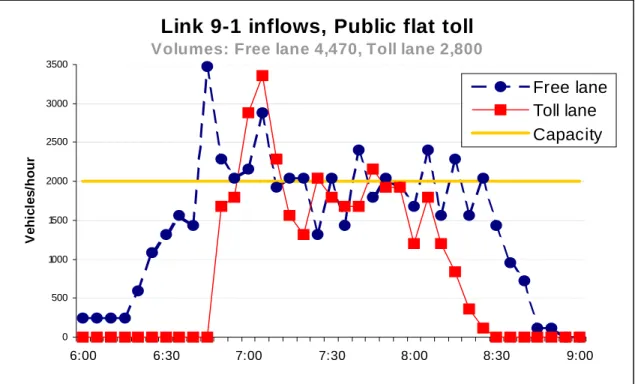
Vehicle inflows before imposition of any tolls on the two lanes of Link 9→1 are plotted in Figure 4, with the capacity of each lane marked by the thick horizontal line at 2,000 vehicles/h.29 Both the aggregate (daily) volumes (3,730 and 3,760) and the flows during the congested period (approximately 6:55 AM to 8:15 AM) are very similar on the two lanes. But the toll lane is used more heavily than the free lane before the peak, while the free lane is used more heavily after the peak. These asymmetries reflect randomness in the route choice module of METROPOLIS and have no impact on travelers’ costs or other statistics of interest. Panel (i) of Table 1 reports the volume on the tolled lane (3,760 vehicles) and the average value of the congestion index (0.76). 4.3.2 Flat tolling
Panel (ii) of Table 1 reports the results for the public and the private flat tolling schedules.
Public regime
The (second-best) public flat toll is $0.28. Although this is a rather nominal amount, it reduces volume on the tolled lane to 74 per cent and the average congestion index to 69 per cent of their respective no-toll values. Figure 5 shows that, in contrast to the no-tolling regime (compare Figure 4), the tolled lane is not used outside the peak period and the inflows are also slightly reduced during the peak. The toll yields a mean annual revenue (R) of about $203,000 and a mean annual welfare gain (G) of about $170,000. 30 The ratio of the welfare gain to revenue (G/R) is 0.84, which suggests that there is considerable scope to compensate travelers
28
For the 264,000 travelers the annual per capita gain is about $205.
29
These and other values refer to the original network; i.e. after multiplying results for the 1/10 scale network by a factor of 10.
30
for their higher travel costs by rebating the revenues and/or using them to expand road or public transport service capacity. 31
The figures for annual revenue and welfare gain are referred to as “mean” values because of the day-to-day fluctuations in the simulations results. To quantify the uncertainty the mean values are accompanied by two standard errors. The first value is a daily figure. The second (in brackets) is the standard deviation of the estimate, which is calculated by dividing the daily standard error by the number of days over which the simulation results were averaged under the assumption of serial independence between days.
The welfare gain from the public flat toll is small for three reasons. First, the toll is levied on only one lane. The other lane remains toll-free, and raising the toll aggravates congestion on the free lane as in the two-links-in-parallel model reviewed in Section 2. Second, none of the other links on the network are tolled and tolling one link causes some traffic to divert onto other routes and exacerbate congestion on them. Third, the flat toll does nothing to alter departure times and smooth out inflows during the travel period.
Private regime
The profit-maximizing private flat toll works out to $1.75: over six times the public flat toll. The $1.75 toll reduces traffic on the tolled lane to 35 per cent of the no-toll level and practically eliminates congestion. Indeed, the tolled lane remains well below capacity most of the time (Figure 6) 32 whereas inflow onto the free lane peaks at more than twice its capacity. The private toll raises nearly three times the revenue as does the public toll, but it results in a slight welfare loss relative to no tolling.33
Most of these results are consistent with the two-links-in-parallel literature: the private toll can be much higher than the public toll, revenue can also be much higher, and the private toll can lead to a welfare loss. The one exception is the result that congestion is eliminated under private tolling. While this it not incompatible with the generic two-links-in-parallel model, it is
31
However, the welfare gain is very small in absolute terms (just 0.3 per cent of the welfare gain in the social optimum) and after deducting the costs of toll infrastructure and collection the net benefit might well be negative.
32
At 7:20 AM the congestion index is positive (0.025) although inflow is only 1,680 vehicles/h. This is possible because the inflow statistic is a five-minute average, and a spike in inflow above capacity during the interval causes a momentary queue to develop.
33
precluded by the usual assumption that congestion delay occurs at any positive level of flow.34 In contrast, with pure queuing congestion as assumed in the simulations here there is no delay as long as the inflow rate remains below capacity. If so, the private operator does not actually employ “congestion” pricing.35
4.3.3 Step tolling
As explained earlier, step tolls were set in 30-minute intervals between 6:30 AM and 8:30 AM, and set to zero earlier and later. The results are reported in Panel (iii) of Table 1.
Public regime
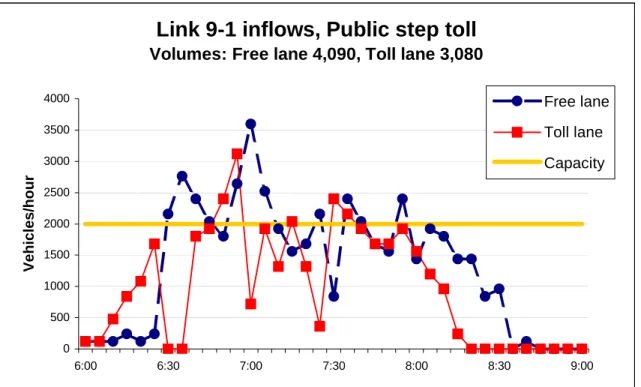
The public step toll ($0.20, $1.21, $0.45, $0.40) exceeds the public flat toll of $0.28 except on the first step. When the toll changes, inflows respond as expected (Figure 7) with decreases at 6:30 and 7:00 when the toll rises, and an increase at 7:30 when it drops. Yet despite these
fluctuations the step toll is much more effective than the flat toll at relieving congestion even though it supports a higher traffic volume. Moreover, the step toll yields a welfare gain more than three times as large. The superior performance of step tolling vis à vis flat tolling is consistent with analytical studies of peak-load pricing using the bottleneck model (e.g. Braid, 1996; Arnott et al., 1993).
Private regime
The private step toll ($0.90, $2.60, $1.40, $2.00) is more than double the public step toll in each half-hour interval, and consequently it reduces inflows and total volume by much more (compare Figure 8 with Figure 7). Several aspects of the private step toll are unexpected. First, rather than having a single peak the toll rises in the final half-hour period. Second, it delivers only a modest increase in revenue relative to the flat toll even though demand is highly-peaked. And third, it generates not only a welfare loss, but a loss that is substantially greater than the loss from the flat toll.36 These results contrast not only with the public flat and step tolls, but also the findings of De Palma and Lindsey (2000) using a two-links-in-parallel network.
34
In particular this is a property of the linear speed-flow curve used by Verhoef et al. (1996) and a number of other studies. However, empirical studies have found that on high-design freeways free-flow speeds can be maintained over a wide range of flows.
35
In terms of equation (2) the Pigouvian component of the private toll is zero, and the toll constitutes a pure markup.
36
Despite an extensive search effort, the profit-maximizing step toll could not be identified very precisely. To check whether the large welfare loss from the step toll was due either to faulty optimization or the vagaries of a single
4.3.4 No-queue tolling
Since no-queue tolling is designed to support a quality-of-service standard on the tolled infrastructure without regard for its effects elsewhere on the network, no-queue tolling is intrinsically welfare-inferior to a second-best tolling scheme that has the same temporal structure. However, the variant of the no-queue scheme with 5-minute steps has a finer time resolution than does the public (30-minute) step toll. Consequently, the welfare ranking of the 5-minute no-queue toll and the second-best toll is ambiguous a priori.
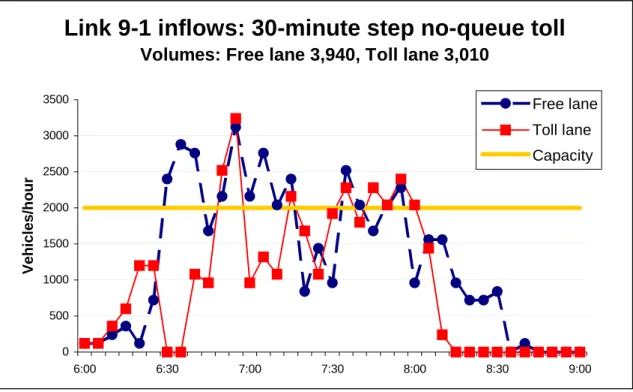
Panel (iv) of Table 1 shows that the 30-minute step no-queue toll serves its function
reasonably well, reducing queuing delay by over 70 per cent with only a 20 per cent reduction in volume.37 The 5-minute step no-queue toll performs even better in terms of traffic volume, congestion relief and welfare gain, and it also yields slightly more revenue. (Nevertheless, the inflow rate for the 5-minute toll fluctuates rather more than with the 30-minute toll; cf. Figure 10 vs. Figure 9.) Furthermore, the 5-minute step variant actually yields a higher welfare gain than does the public step toll, thereby demonstrating the advantages of a fine time resolution for congestion pricing. In light of the successful implementation in California and Singapore of tolling in short time steps, the 5-minute scheme would appear to be a superior choice – at least on the basis of the specific simulations done here.
A potential drawback of the no-queue toll as far as private operation is that it generates much less revenue than do either the private flat or step tolls. Thus, if no-queue tolling were to be implemented as a private-sector venture under quality-of-service regulation, close monitoring of toll levels might be required to assure compliance by the operator.
4.3.5 Summary
Before proceeding to the other three tolling configurations, three results from the LANE toll simulations deserve repeating. The first – which is familiar from the two-links-in-parallel literature – is that private tolling can lead to a welfare loss relative to no tolling. Second, no-queue tolling can perform respectably relative to public step tolling, and may therefore warrant simulation, the step toll schedules that yielded the next five highest revenue levels were examined. (The steps on these schedules differ from the selected optimal schedule by $0.25 on average.) In each case the welfare loss was even larger than for the optimal toll. Furthermore, with two of the five schedules the toll from 8:00 AM to 8:30 AM exceeded the toll from 7:30 AM to 8:00 AM.
37
The 30-minute step toll works out to ($0.33, $1.13, $0.43, $0.00). Except for the first step, it is somewhat lower than the public step toll.
consideration as a way to harness private-sector toll roads under quality-of-service regulations. The third result, which though relatively obvious has drawn little attention in the literature38, is that a private operator may find it profitable to operate roads at below capacity even during peak periods.39 If so, there would be no benefit (at least with pure queuing congestion) to expanding the capacity of the tolled lane. However, expanding capacity of the free lane would still be beneficial. This presents an interesting contrast to the well-known lesson popularized by Downs (1962) that the potential benefits from building or expanding a toll-free facility may be
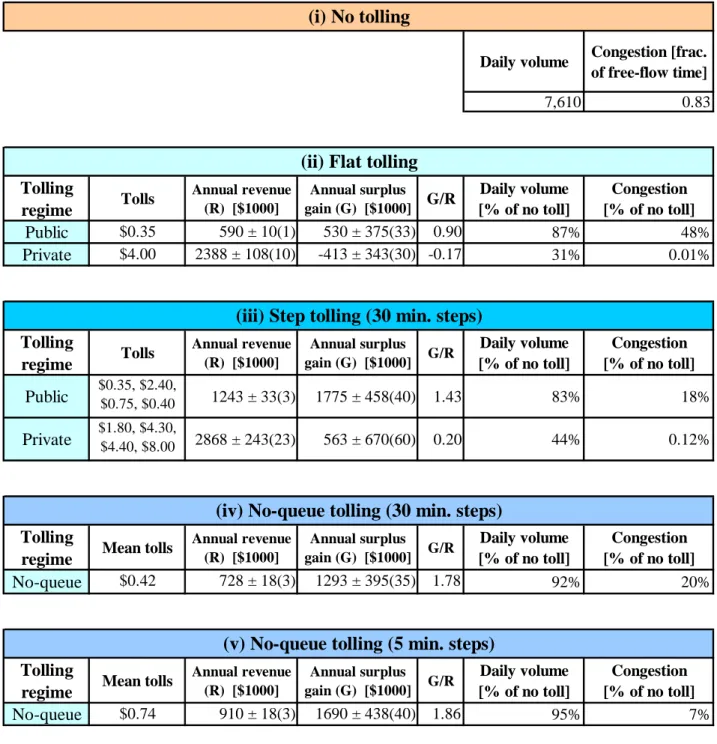
undermined by latent demand. 4.4 LINK 2 toll
In the LINK 2 scheme both lanes of the Inbound 2 link (Link 9→1) are tolled rather than just one lane as for the LANE toll. The results are reported in Table 2 using the same format as for Table 1. The daily volume and congestion index statistics again pertain to the tolled
infrastructure – which in this case is the whole link.40 Discussion focuses on similarities and differences in results between the LINK 2 and LANE toll schemes.
4.4.1 Flat tolling
The public flat toll of $0.35 is a little higher than the $0.28 LANE toll. And it yields about triple the welfare gain – consistent with studies using the two-links-in-parallel network that the gains from public tolling increase more than proportionally with the fraction of capacity that is tolled.41 The contrast with the LANE scheme is greater for the private flat toll, which is more than twice as large ($4.00 vs. $1.75) and yields over four times the revenue. However, the flat toll creates a much greater welfare loss than does the flat LANE toll. Thus, the advantage of the LINK 2 toll in supporting an even split of traffic between the two lanes is outweighed by the greater exercise of market power by the private operator.
38
One exception is Verhoef and Small (2004) who find that a private operator eliminates most of the congestion delay on the link(s) that it tolls. Their model features a travel time function with a fourth-power dependence on flow, so that congestion delays are quite low unless volumes are a large fraction of capacity.
39
In contrast, the goal of no-queue tolling is to maintain flows at capacity.
40
The daily volume reported in Table 2 for the no-tolling regime differs slightly from the aggregate volume reported in Figure 4 for the tolled lane and free lane together. The discrepancy arises because (as noted in Section 3.4) the LANE toll simulations were performed using an augmented road network. Initial conditions in METROPOLIS differ between networks, and this can lead to slightly different results.
41
The degree of “increasing returns” is expected to be smaller on the network here because congestion remains unpriced on other routes.
4.4.2 Step tolling
Similar to the LANE tolling scheme, the public step toll yields several times the welfare gain from the flat toll. And again the private step toll effectively eliminates congestion while yielding only a moderately higher revenue for the private operator. However, the private step toll now yields a welfare gain so that this time the beneficial route split effect outweighs the market power effect.
4.4.3 No-queue tolling
The results for no-queue tolling shown in panel (iv) and (v) of Table 2 are similar to those for the LANE tolling scheme. No-queue tolling performs particularly well at eliminating queuing, although the welfare gain from the 5-minute variant falls slightly short of the gain from public step tolling.
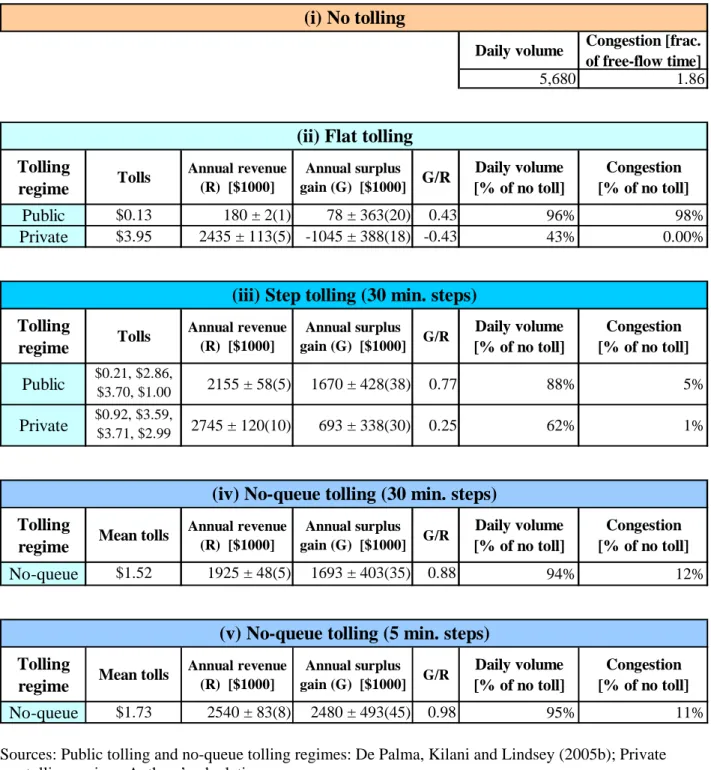
4.5 LINK 1 toll
The LINK 1 toll is imposed on Link 1→0, which feeds into the city centre and lies
downstream of the link that is tolled in the LINK 2 scheme. The results are reported in Table 3. 4.5.1 Flat tolling
The public toll ($0.13) is relatively trivial and it delivers only a small fraction of the (already modest) benefits from the LINK 2 flat toll. One reason for the difference is that although the Inbound 1 link is more congested than the upstream Inbound 2 link, it carries fewer vehicles. Another reason is that traffic can divert from the Inbound 1 link more easily than from the Inbound 2 link because the Ring 1 links joining the Inbound 1 links are shorter than the Ring 2 links that join the Inbound 2 links.
Given these considerations, it comes as a surprise that the private LINK 1 flat toll is nearly as large as the LINK 2 flat toll. Less surprising is that the welfare impacts of the large toll are
4.5.2 Step tolling
The impacts of public and private step tolling are similar in magnitude to those for the LINK 2 scheme. Again, step tolling provides only a small increase in revenue for the private operator, but it yields a much larger welfare gain for the public operator.42
4.5.3 No-queue tolling
The no-queue tolling schemes perform particularly well. Indeed, the 5-minute step variant yields a considerably higher welfare gain than does the public 30-minute step toll, thereby
making it a strong candidate for regulated private operation.43 Further investigation is required to determine why no-queue tolling is so effective on the downstream link.44
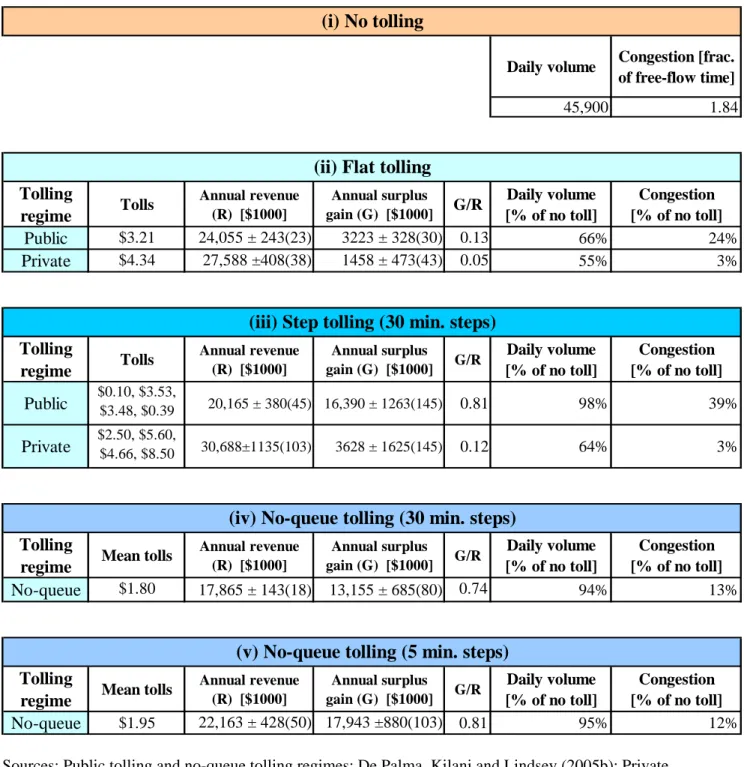
4.6 CORDON Toll
The CORDON toll is levied on the eight Inbound 1 links that lead into the city centre. The results are reported in Table 4.
4.6.1 Flat tolling
The CORDON scheme provides two surprises with flat tolling. One is that the public flat toll of $3.21 is such a large multiple (nearly 25) of the flat toll in the LINK 1 scheme.45 The flat toll is much larger because, when all eight Inbound 1 links are tolled, there is no problem of traffic diversion onto neighbouring parallel links.46 Traffic flowing into the centre is reduced by about a third, and the welfare gain is more than forty times bigger than the gain from the LINK 1 scheme. Thus, public flat tolling exhibits strongly increasing returns with respect to the amount of road capacity that is tolled.
42
Unexpectedly, the private step toll is lower in every half-hour interval than the private flat toll. Further simulations would be required to determine whether this anomaly is due to inexact optimization.
43
It is anomalous that the 30-minute variant also yields a slightly larger gain than the public (30-minute) step toll, although the difference is within the margin of error.
44
A similar result is reported in Kuwahara (1990) who shows, using a two-links-in-series network with bottleneck queuing congestion, that levying a continuously time-varying toll on the downstream link can eliminate queuing on both the downstream and the upstream link provided the number of users of the upstream link is not too large.
45
The annual welfare gain exhibits a double peak when plotted against the toll, with a small peak of about $1.9 million at a toll of $0.40, and the larger peak of about $3.2 million at a toll of $3.21. By contrast, revenue rises smoothly throughout the same range.
46
Traffic does divert onto Ring Road 1, and the congestion index on the Ring 1 links increases as the CORDON toll is progressively raised.
The second surprise is that the private flat toll of $4.34 is not much larger than the flat toll for LINK 1, and indeed not all that much larger than the public toll. As a result, the private toll yields a substantial welfare gain that approaches 50 per cent of the public gain. Granting the private operator monopoly power over the city centre therefore does not have the drastic consequences that one might expect. Hence, in contrast to the results of the flat LINK 2 scheme, the advantages of supporting an even route split of traffic outweigh the greater market power of the private operator.
4.6.2 Step tolling
The step tolling results are more in line with those of the other three tolling configurations. The welfare gain from public tolling rises greatly relative to the gain from flat tolling, whereas revenues for the private operator rise only modestly.
4.6.3 No-queue tolling
The two no-queue tolling schedules perform almost identically to those of the LINK 1 configuration: the proportional impacts on traffic volumes and congestion are almost identical, while the welfare gain and revenue are scaled up by about a factor of eight. Thus, no-queue tolling exhibits approximately constant returns with respect to the scale of the tolled
infrastructure.
5
CONCLUSIONS
This paper undertook a comparison of public and private tolling on a congested road network. Some of the results bear out previous research. One is that unregulated private tolls are higher, and possibly much higher, than public tolls. Another result, which complements that in De Palma, Kilani and Lindsey (2005b), is that the no-queue tolling regime performs favourably compared to public step tolling. And in every toll-road configuration no-queue tolling does much better than private tolling.47 A few results are unexpected. One surprise is how badly step tolling performs with the LANE tolling schedule under private management. Another surprise is how
47
Of course this does not imply that no-queue tolling would also perform better than private tolling under alternative forms of regulations. The design of such schemes could emerge as an important practical issue in the future.
well flat tolling performs with the CORDON tolling scheme under private management despite the market power that the private operator wields with this scheme.
As the review in Section 2 of the two-links-in-parallel network makes clear, allocative inefficiency from private roads stem not from a lack of incentive on the private operator’s part to alleviate congestion but rather from exercise of market power. The degree of market power depends on the elasticity of traffic demand. Estimates of toll elasticities on existing toll roads differ widely. In absolute value toll elasticities have been found to vary positively with the length of the tolled section, positively with the availability and average speeds of parallel toll-free alternatives, negatively with the percentage of heavy trucks on alternatives, and to be lower in tourist areas (Matas and Raymond, 2003). In the METROPOLIS model the volume of traffic on a link can respond to an increase in the toll in three ways: by shifting mode (to public transport), by shifting route (to one that does not include the link), and by shifting departure time (to a time when the toll is lower if a time-varying toll is employed). Unfortunately, due to the fluctuations in METROPOLIS it is difficult to compute the toll elasticity accurately on a single link – let alone to partition it into these three components.
The final result of note is that for all tolling configurations the additional welfare gained under public tolling from step tolling rather than flat tolling exceeds – both absolutely and proportionally – the additional revenue gained under private tolling. To the extent that an extra dollar of social surplus and an extra dollar of revenue provide commensurable incentives to the respective operators, this suggests that step tolling may be less likely on private than public roads. One explanation for why time variation of tolls might be less rewarding to a private operator is that private roads are less congested because of the higher toll levels. However, in addition to the level of demand the elasticity of demand also varies by time of day, and this provides another incentive for a private operator (but not a public operator) to price discriminate intertemporally. This is one of several questions raised by the simulations that warrant further investigation.
The analysis in this paper could fruitfully be extended in various directions. One obvious one is to competition between private operators.48 While competition between private toll-road
48
For the CORDON tolling scheme a competitive regime was investigated in which each of the eight Inbound 1 links was controlled by a different private operator. An iterative procedure was adopted to solve for the Nash equilibrium. The computations proved to be time-consuming, and despite the assumption that a symmetric
operators does not seem to have emerged anywhere in the world as yet, the possibility is gaining increasing interest. Moreover, there do not appear to be any fundamental technological or institutional reasons why – as is the case for most commodities – road services could not be provided by competitive markets (Roth, 2006).
6
ACKNOWLEDGMENTS
The authors would like to thank Moez Kilani for collaboration on related projects, Fabrice Marchal for extensive assistance in using the METROPOLIS software and Kurt Van Dender for helpful comments. Financial support from the Social Sciences and Humanities Research Council of Canada is gratefully acknowledged.
equilibrium would obtain it could not be reliably identified. More success may be possible using other road networks or alternative algorithmic procedures.
7 REFERENCES
Arnott, R., A. de Palma and R. Lindsey (1990), “Economics of a Bottleneck”, Journal of Urban Economics 27, 111-130.
Arnott, R., A. de Palma and R. Lindsey (1993), “A structural model of peak- period congestion: A traffic bottleneck with elastic demand”, American Economic Review 83(1), 161-179. Block, W. (1979), “Free market transportation: Denationalizing the roads”, The Journal of
Libertarian Studies 3(2), 209-238.
Block, W. (1983), “Public goods and externalities: The case of roads”, The Journal of Libertarian Studies 7(1), 1-34.
Bonsall, P., J. Shires, B. Matthews, J. Maule and J. Beale (2004), “Road user charging - pricing structures”, Draft Final Report for The Department for Transport, July, University of Leeds: The Institute for Transport Studies.
Braid, R.M. (1996), “Peak-load pricing of a transport facility with an unpriced substitute”, Journal of Urban Economics 40, 179-197.
Calcott, P. and S. Yao (2005), “Competition between highway operators: Can we expect toll differentiation?”, Papers in Regional Science 84(3), 615-626.
Commission for Integrated Transport (2005), “Road charging scheme: South America - Chile, Santiago de Chile”, (http://www.cfit.gov.uk/docs/2006/wrrp/wrrp2/case/index.htm, accessed December 16, 2006).
De Palma, A., M. Kilani and R. Lindsey (2005a), “Congestion pricing on a road network: A study using the dynamic equilibrium simulator METROPOLIS”, Transportation Research A 39A, 588-611.
De Palma, A., M. Kilani and R. Lindsey (2005b), “A comparison of second-best and third-best tolling schemes on a road network”, Transportation Research Record Vol. 1932, 89-96. De Palma, A. and R. Lindsey (2000), “Private toll roads: Competition under various ownership
regimes”, Annals of Regional Science 34(1), 13-35.
De Palma, A. and R. Lindsey (2002), “Private toll roads, competition, and incentives to adopt time-based congestion tolling”, Journal of Urban Economics 52, 217-241.
De Palma, A. and R. Lindsey (2006), “Modelling and evaluation of road pricing in Paris”, Transport Policy 13(2), 115-126.
De Palma, A., R. Lindsey and E. Quinet (2004), “Time-varying road pricing and choice of toll locations”, Chapter 5 in G. Santos (ed.), Road Pricing: Theory and Evidence, Elsevier Science.
De Palma, A. and F. Marchal (2002), “Real cases applications of the fully dynamic
METROPOLIS Tool-box: An advocacy for global large-scale mesoscopic transportation systems”, Networks and Spatial Theory 2(4), 347-369.
De Palma, A., F. Marchal and Y. Nesterov (1997), “METROPOLIS: Modular system for dynamic traffic simulation”, Transportation Research Record 1607, 178-184.
De Vany, A. and T.R. Saving (1980), “Competition and highway pricing for stochastic traffic”, Journal of Business 53(1), 45-60.
Downs, A. (1962), “The law of peak-hour expressway congestion”, Traffic Quarterly 16, 393-409.
Gronau, R. (1999), “The economics of a single toll road in a toll-free environment”, Journal of Transport Economics and Policy 33(2), 163-172.
Knight, F. (1924), “Some fallacies in the interpretation of social costs”, Quarterly Journal of Economics 38(4), 582-606.
Krishnamurthy, S. and K.M. Kockelman (2003), “Propagation of uncertainty in transportation-land use models: An investigation of DRAM-EMPAL and UTPP predictions in Austin, Texas”, Transportation Research Record 1831, 219-229.
Kuwahara, M. (1990), “Equilibrium queuing patterns at a two-tandem bottleneck during the morning peak”, Transportation Science 24(3), 217-229.
Lindsey, R. (2004), “The welfare-distributional impacts of congestion pricing on a road network”, Proceedings of the 39th Annual Conference of the Canadian Transportation Research Forum: 2004 Transportation Revolutions, Calgary, May 9-12, 149-163. Lindsey, R. and E.T. Verhoef (2001), “Traffic congestion and congestion pricing”, in K.J.
Button and D.A. Hensher (eds.), Handbook of Transport Systems and Traffic Control, Oxford: Elsevier Science, 77-105.
Matas, A. and J-L Raymond (2003), “Demand elasticity on tolled motorways”, Journal of Transportation and Statistics 6(2/3), 91-108.
Mills, G. (1995), “Welfare and profit divergence for a tolled link in a road network”, Journal of Transport Economics and Policy, 137-146.
Mohring, H. (1985), “Profit maximization, cost minimization, and pricing for congestion-prone facilities”, Logistics and Transportation Review 21, 27-36.
Pigou, A.C. (1920), The Economics of Welfare, London: Macmillan.
Poole, R.W., Jr. (1996), “Private toll roads”, in Hakim, S., P. Seidenstat and G.W. Bowman (eds.), Privatizing Transportation Systems, Westport, Connecticut: Praeger, 165-181. Poole, R.W., Jr. (2003), “Commercializing highways: A ‘road-utility’ paradigm for the 21st
century”, Reason Public Policy Institute.
Roson, R, and J.C.J.M van den Bergh (2000), “Network markets and the structure of networks”, Annals of Regional Science 34(2), 197-211.
Roth, G.J. (1996), Roads in a Market Economy, Aldershot, Hants: Avebury Technical.
Samuel, P., R.W. Poole, Jr. and J. Holguin-Veras (2002), “Toll truckways: A new path toward safer and more efficient freight transportation”, Reason Public Policy Institute.
Singapore Land Transport Authority, Ministry of Transport,
http://www.lta.gov.sg/motoring_matters/index_motoring_erp.htm, accessed January 1, 2007. Small, K.A. and E.T. Verhoef (2007), Urban Transportation Economics, Taylor and Francis. Spence, M. (1975), “Monopoly, quality, and regulation”, Bell Journal of Economics 6, 417-429. Verhoef, E.T. (2002), “Second-best congestion pricing in general static transportation networks
with elastic demands”, Regional Science and Urban Economics 32, 281-310.
Verhoef, E.T. and K.A. Small (2004), “Product differentiation on roads: Constrained congestion pricing with heterogeneous users”, Journal of Transport Economics and Policy 38(1), 127-156.
Verhoef, E.T., P. Nijkamp and P. Rietveld (1996), “Second-best congestion pricing: The case of an untolled alternative”, Journal of Urban Economics 40(3), 279-302.
Vickrey, W.S. (1969), “Congestion theory and transport investment”, American Economic Review (Papers and Proceedings) 59, 251-260.
Winston, C. (2000), “Government failure in urban transportation”, AEI-Brookings Joint Center for Regulatory Studies, Working Paper 00-8.
Xiao, F., H. Yang and D. Han (2005), “Competition and efficiency of private toll roads”, working paper.
Yang, H. and H-J. Huang (2005), Mathematical and Economic Theory of Road Pricing, Elsevier.
Yang, H. and Q. Meng (2000), “Highway pricing and capacity choice in a road network under a build-operate-transfer scheme”, Transportation Research A 34A, 207-222.
Yang, H., W.H. Tang, W.M. Cheung and Q. Meng (2002), “Profitability and welfare gain of private toll roads in a network with heterogeneous users”, Transportation Research A 36A(6), 537-554.
Yang, H. and K.K. Woo (2000), “Competition and equilibria of private toll roads in a traffic network”, Transportation Research Record 1733, 15-22.
Yang, H., X. Zhang and Q. Meng (2003), “Modeling private highways in networks with entry-exit based toll charges”, Transportation Research B 38(3), 191-213.
Zhang, L. and D. Levinson (2005), “Road pricing with autonomous links”, 84th Annual Meeting of the Transportation Research Board, Paper No. 05-0933, Washington, DC.
8 APPENDIX: COMPUTATION OF TOLLS
Simple procedures for optimizing public flat and public step tolls that are useable with
METROPOLIS were developed in De Palma, Kilani and Lindsey (2005a), and a procedure for solving no-queue tolling was developed for use in Lindsey (2004) and De Palma, Kilani and Lindsey (2005b). The procedures for optimizing public tolls are transferable without substantive change to private tolls. The text in the Appendix is adapted with some additions and changes in wording from De Palma, Kilani and Lindsey (2005b, Section 2.4).
8.1 Flat tolls
To compute second-best flat tolls several initial simulations with different toll values were run, and a quadratic or spline function was then fitted to the set of (τ, G) pairs, where τ denotes the flat toll and G the welfare gain. Further simulations were performed using tolls at, or close to, the highest point of the fitted function until little change to either the function or the fitted
optimal (welfare-maximizing) toll occurred between successive simulations. For computing profit-maximizing (=revenue-maximizing) tolls the same procedure was used with revenues used in place of the welfare gain.
8.2 Step tolls
The step tolls are levied during the two-hour period 6:30-8:30. As a first step in computing the second-best optimal step toll, a peak toll, τ1, was set during the period 7:00-8:00, and a shoulder toll, τ2, during the two half-hour periods 6:30-7:00 and 8:00-8:30. An initial set of simulations with trial values of τ1 and τ2 was performed. A quadratic function of the form
2 2
0 1 1 1 1 2 2 2 2 12 1
G G= +aτ +bτ +aτ +bτ +c ττ2 was then fitted to the set of (τ1,τ2,G) triplets.49 Further simulations were undertaken until a global maximum of the fitted function was found, and little change to either the function or the optimal tolls occurred on successive simulations.
As a second step the 6:30-8:30 interval was divided into four half-hour intervals, and simulations with alternative values of the four 30-minute tolls,
(
τ τ τ τ1, 2, ,3 4)
, were performed49
The welfare gain should be zero when both tolls are zero, but due to oscillations in the simulations this was not precisely the case and the constant G0 was added to the regression equation to improve goodness-of-fit.
using the optimal values for the peak and shoulder tolls as a starting point. A quadratic function of the form G G= 0+
∑
4j=1(
aj jτ +bj jτ2)
+c12 1 2τ τ +c23 2 3τ τ +c34 3 4ττ was fitted to the(
τ τ τ τ1, 2, ,3 4,G)
quintuplets, and a global maximum of the fitted function was identified usingthe same procedure as for the peak and off-peak tolls.50 To compute profit-maximizing tolls the same procedure was used with revenues again used in place of the welfare gain.
8.3 No-queue tolls
For the LANE and the two LINK toll configurations a single road link is tolled. For the CORDON configurations multiple links of the same type are tolled but the toll is constrained to be the same on all eight links. Thus, for each configuration only a single toll was computed for every 5-minute time interval. The procedure for no-queue tolling involves a tâtonnement-like iterative adjustment of the toll according to the formula:
1 max max 0, i i i t t t A Free Occ Occ Max tt Occ τ + = ⎡ τ + ⋅λ α ⋅ − ⎤ ⎢ ⎥ ⎣ ⎦, (5)
where is the free-flow travel time on the link, is the occupancy (i.e. number of vehicles) on the link in time-of-day interval t on the last day of simulation i, is the maximum occupancy of the link above which queuing occurs (
Free tt i t Occ max Occ max Free i
Occ =tt s where is the flow capacity of the link), and is an adjustment factor.
i s
(
0,1λ∈
)
Equation (5) stipulates that the toll for interval t is raised for simulation i+1 if the occupancy on simulation i exceeded capacity (i.e. a queue was present), and lowered if occupancy was less than capacity. Since negative tolls cannot be levied with METROPOLIS, a minimum toll of zero is imposed in equation (5).51 As an initial condition, zero tolls were set on the first iteration. Simulations were run with λ =1 until a reduction in social surplus occurred.A second set of iterations was then conducted with λ =0.5 and continued until social surplus fell again. For the LANE configuration, iterations were also run with λ =0.25in an effort to improve accuracy.
50
To reduce computation time interaction terms in the quadratic function were included only for adjacent 30-minute time intervals for which intertemporal substitution by travellers is expected to be significant.
51
Second-best tolling may call for negative tolls on relatively under-utilized links (Braid, 1996; De Palma, Lindsey and Quinet, 2004).
TABLE 1. Impacts of LANE tolling
Daily volume Congestion [frac. of free-flow time] 3,760 0.76 Tolling regime Tolls Annual revenue (R) [$1000] Annual surplus gain (G) [$1000] G/R Daily volume [% of no toll] Congestion [% of no toll] Public $0.28 203 ± 7(1) 170 ± 428(38) 0.84 74% 69% Private $1.75 583 ± 35(3) -30 ± 460(40) -0.05 35% 0.01% Tolling regime Tolls Annual revenue (R) [$1000] Annual surplus gain (G) [$1000] G/R Daily volume [% of no toll] Congestion [% of no toll] Public $0.20, $1.21, $0.45, $0.40 378 ± 23(1) 570 ± 455(23) 1.51 82% 20% Private $0.90, $2.60, $1.40, $2.00 688 ± 41(2) -277 ± 500(23) -0.40 46% 3% Tolling
regime Mean tolls
Annual revenue (R) [$1000] Annual surplus gain (G) [$1000] G/R Daily volume [% of no toll] Congestion [% of no toll] No-queue $0.47 365 ± 18(1) 460 ± 478(23) 1.26 80% 27% Tolling
regime Mean tolls
Annual revenue (R) [$1000] Annual surplus gain (G) [$1000] G/R Daily volume [% of no toll] Congestion [% of no toll] No-queue $0.45 380 ± 15(1) 698 ± 400(20) 1.84 93% 19%
(iv) No-queue tolling (30 min. steps) (i) No tolling
(v) No-queue tolling (5 min. steps) (ii) Flat tolling
(iii) Step tolling (30 min. steps)
TABLE 2. Impacts of LINK 2 tolling
Daily volume Congestion [frac. of free-flow time] 7,610 0.83 Tolling regime Tolls Annual revenue (R) [$1000] Annual surplus gain (G) [$1000] G/R Daily volume [% of no toll] Congestion [% of no toll] Public $0.35 590 ± 10(1) 530 ± 375(33) 0.90 87% 48% Private $4.00 2388 ± 108(10) -413 ± 343(30) -0.17 31% 0.01% Tolling regime Tolls Annual revenue (R) [$1000] Annual surplus gain (G) [$1000] G/R Daily volume [% of no toll] Congestion [% of no toll] Public $0.35, $2.40, $0.75, $0.40 1243 ± 33(3) 1775 ± 458(40) 1.43 83% 18% Private $1.80, $4.30, $4.40, $8.00 2868 ± 243(23) 563 ± 670(60) 0.20 44% 0.12% Tolling
regime Mean tolls
Annual revenue (R) [$1000] Annual surplus gain (G) [$1000] G/R Daily volume [% of no toll] Congestion [% of no toll] No-queue $0.42 728 ± 18(3) 1293 ± 395(35) 1.78 92% 20% Tolling
regime Mean tolls
Annual revenue (R) [$1000] Annual surplus gain (G) [$1000] G/R Daily volume [% of no toll] Congestion [% of no toll] No-queue $0.74 910 ± 18(3) 1690 ± 438(40) 1.86 95% 7%
(v) No-queue tolling (5 min. steps) (i) No tolling
(ii) Flat tolling
(iii) Step tolling (30 min. steps)
(iv) No-queue tolling (30 min. steps)
Sources: Public tolling and no-queue tolling regimes: De Palma, Kilani and Lindsey (2005b); Private tolling regime: Authors’ calculations
TABLE 3. Impacts of LINK 1 tolling
Daily volume Congestion [frac. of free-flow time] 5,680 1.86 Tolling regime Tolls Annual revenue (R) [$1000] Annual surplus gain (G) [$1000] G/R Daily volume [% of no toll] Congestion [% of no toll] Public $0.13 180 ± 2(1) 78 ± 363(20) 0.43 96% 98% Private $3.95 2435 ± 113(5) -1045 ± 388(18) -0.43 43% 0.00% Tolling regime Tolls Annual revenue (R) [$1000] Annual surplus gain (G) [$1000] G/R Daily volume [% of no toll] Congestion [% of