Treasury’s Forecasting
Performance: A Head-to-Head
Comparison
K h o o n L e k G o h a n d D a n i e l L a w r e n c e
N
E W
Z
E A L A N D
T
R E A S U R Y
W
O R K I N G
P
A P E R
0 6 / 1 0
J
U L Y
2 0 0 6
N Z T R E A S U R Y W O R K I N G P A P E R
0 6 / 1 0
Treasury’s Forecasting Performance: A Head-to-Head Comparison
M O N T H/Y E A R July 2006 A U T H O R S Khoon Lek Goh
The Treasury PO Box 3724 Wellington New Zealand Email Telephone Fax [email protected] 04 917 6011 04 499 0992 Daniel Lawrence The Treasury PO Box 3724 Wellington New Zealand Email Telephone Fax [email protected] 04 917 6002 04 499 0992
A C K N O W L E D G E M E N T S We would like to thank Satish Ranchhod for supplying us with historical Reserve Bank of New Zealand forecasts. We are also grateful to Yuong Ha and to the participants of Treasury’s Macro Reading Group for providing helpful comments and suggestions. N Z T R E A S U R Y New Zealand Treasury
PO Box 3724 Wellington 6008 NEW ZEALAND Email Telephone Website [email protected] 64-4-472 2733 www.treasury.govt.nz
D I S C L A I M E R The views, opinions, findings, and conclusions or recommendations expressed in this Working Paper are strictly those of the author(s). They do not necessarily reflect the views of the New Zealand Treasury. The Treasury takes no responsibility for any errors or omissions in, or for the correctness of, the information contained in these working papers. The paper is presented not as policy, but with a view to inform and stimulate wider debate.
A b s t r a c t
Work on assessing Treasury’s forecasting performance to date has focussed on comparisons against consensus forecasts. This study compares Treasury’s GDP and CPI forecast performance against individual private sector forecasters as well as major public sector institutions such as the IMF, OECD and the Reserve Bank of New Zealand. The head-to-head comparison makes it possible to assess Treasury’s forecasting performance relative to its peers. When compared across all evaluation periods covering 1996-2005, Treasury’s GDP forecast performance was ranked in the middle at seventh out of 16. The large forecast error for the 1998 year had a material impact on Treasury’s overall forecast performance. Treasury’s CPI forecast performance was not as good, placing tenth out of 12. Large forecast errors for the 1998-2000 period accounted for the poor CPI forecast performance. Treasury’s overall forecast performance was better when evaluating only the current year Budget forecasts, placing fourth for GDP and sixth for CPI. This suggests that Treasury is better at forecasting the current year than the year ahead. Consistent with international studies, no single forecaster consistently outperforms the Consensus, with Treasury beating the Mean 30% of the time for GDP and Consensus 33% of the time for CPI. All forecasters find it difficult to pick recessions and turning points. Large forecasting groups generally have a poorer forecasting record on average.
J E L C L A S S I F I C A T I O N E27 - Forecasting and Simulation E37 - Forecasting and Simulation K E Y W O R D S Forecast accuracy; New Zealand
T a b l e o f C o n t e n t s
Abstract ... i
Table of Contents ...ii
List of Tables... ii
List of Figures ... ii
1 Introduction ... 1
2 Data and Methodology ... 2
2.1 The data ...2
2.2 The methodology ...3
3 Head-to-head Comparison... 4
3.1 Forecast performance across all evaluation periods...4
3.2 Forecast performance for Budget current year ...7
3.3 No one consistently outperforms the Consensus...9
3.4 Forecasting turning points is difficult ...10
4 Conclusion ... 12
References ... 13
Appendix ... 14
L i s t o f T a b l e s
Table 1 – Initial and latest GDP outturn (1996 to 2005)...2Table 2 – Forecasters covered in this study ...3
Table 3 – Number of observations and forecasters ...3
Table 4 – Average RMSE and relative rank across all evaluation periods ...6
Table 5 – Average RMSE and relative rank for Budget current year forecast...8
L i s t o f F i g u r e s
Figure 1 – Average relative rank across all evaluation periods ...5Figure 2 – RMSE across all evaluation periods ...6
Figure 3 – Average relative rank for Budget current year forecast ...7
Figure 4 – RMSE for Budget current year forecast...8
Figure 5 – Frequency of GDP relative ranking over all evaluation periods ...9
Figure 6 – Frequency of CPI relative ranking over all evaluation periods ...10
Figure 7 – GDP forecast revisions for 1998 ...11
Figure 8 – Treasury GDP forecast revisions and actual ...14
Treasury’s Forecasting
Performance: A Head-to-Head
Comparison
1 I n t r o d u c t i o n
“…the ability to produce accurate predictions of the course of the economy in the near-term future is probably the main criterion by which the public judges the usefulness of our entire profession.” Victor Zarnowitz (December 1986) The Treasury produces forecasts of the New Zealand economy at least twice a year which are published in the Economic and Fiscal Updates.1 The economic forecasts are used as a basis for Treasury’s economic and fiscal policy advice to the Government. Consistently poor forecast performance can lead to policy mistakes, requiring disruptive policy adjustments further down the track. Evaluating Treasury’s forecasting performance is therefore both important and necessary to ensure the quality of its advice. In reality, there are many dimensions to consider when assessing the quality of economic and fiscal advice. Zarnowitz’s statement above, however, provides a simple and high level benchmark for judging one of Treasury’s core functions.
Treasury undertakes regular internal monitoring of its forecast performance, and since 2003 its forecasting record has been publicly released on an annual basis.2 Work on comparing Treasury’s forecasting performance to date has mainly focussed on comparisons against consensus forecasts published by the New Zealand Institute of Economic Research (NZIER). International studies have found that consensus forecasts tend to perform better than forecasts produced by individual organisations (Batchelor, 2001; Zarnowitz, 1984; Zarnowitz and Braun, 1992). In this study, a different approach is taken. Treasury’s forecast performance is compared with that of individual private sector forecasters as well as major public sector institutions, rather than simply with the average of other forecasts. This makes it possible to assess how Treasury’s forecast performance compares with its peers, on average and also over time.
Section 2 describes the data and methodology used in this paper. Section 3 analyses the head-to-head comparison, and section 4 concludes.
1 These are the Budget Economic and Fiscal Update (published at the time of the Budget, typically in May) and the Half Year
Economic and Fiscal Update (published in November or December). In addition, a Pre-election Economic and Fiscal Update is published four to six weeks before a general election.
2
D a t a a n d M e t h o d o l o g y
2 . 1 T h e
d a t a
Forecast data from private sector institutions come from Consensus Economics’ Asia Pacific edition of Consensus Forecasts. Each month, Consensus Economics3 surveys a number of private sector institutions in New Zealand and collects their forecasts for several major economic variables – such as gross domestic product (GDP), private consumption, consumer price index (CPI), unemployment rate and the current account balance. The forecasts are published in the second week of each month, based on the survey conducted in the previous two weeks. Forecast data from major public sector institutions were sourced either directly from those institutions or from published forecasts.4
As well as the forecasts of the individual participants in the survey, Consensus Economics also reports the mean of those forecasts (known as the consensus forecast). In this study, two alternative ‘consensus’ measures are calculated for each period. One is a Mean of the private sector institutions used in this study, plus the Reserve Bank, OECD and IMF. The other is the Median of the forecasts used in the study, calculated to reduce the influence of extreme forecasts. The Mean and Median are calculated only for GDP, since the CPI forecasts used in this study are not on a comparable basis.5
A common dilemma in the forecasting literature is the appropriate “actual outturn” data to use for assessing forecast accuracy. Unlike the CPI, which is generally not subject to revision, initial GDP outturns are often subject to numerous revisions. The revisions could be due to updated information, methodological changes, the introduction of new weights or rebasing (see table 1). Since forecasts made at any point in time are based on all available data at the time (and methodology), and are often judged against the first available data outturn, this study uses the initial outturn as the basis for assessing forecast accuracy.
Table 1 – Initial and latest GDP outturn (1996 to 2005)
Calendar year Initial outturn Latest outturn % -point difference
1996 2.7 4.1 1.4 1997 2.3 1.9 -0.4 1998 -0.3 -0.1 0.2 1999 3.4 4.4 1.0 2000 3.5 3.4 -0.1 2001 2.4 3.0 0.6 2002 4.4 4.8 0.4 2003 3.5 3.4 -0.1 2004 4.8 4.4 -0.4 2005 2.2 2.2 0.0 High 1.4 Low -0.4 Mean 0.3
3 For more information on Consensus Economics, visit their website at www.consensuseconomics.com.
4 The Reserve Bank provided their forecast data for this study. The OECD’s forecasts were sourced from their twice yearly Economic
Outlook publication. The IMF’s forecasts were sourced from their World Economic Outlook reports.
2 . 2 T h e
m e t h o d o l o g y
To ensure adequate comparisons, only the Consensus Forecasts which were surveyed in the same month that Treasury’s forecasts were finalised were used, thereby ensuring that the forecasts were based on similar information sets. These are typically the April/May and October/November editions of Consensus Forecasts. Private sector forecasters that are no longer featured in Consensus Forecasts, either because they are no longer included or because they have been merged or taken over by another forecaster, and those without a sufficient number of observations, have been excluded. The Reserve Bank’s forecasts were based on their Monetary Policy Statements which were finalised in the month closest to when the Treasury finalised. The OECD’s Economic Outlook is normally published in June and December, while the IMF’s World Economic Outlook is normally published in May and October. The minor timing differences of when the different forecasts were finalised can have an impact on the forecast performance, given sudden exchange rate or commodity price changes. It is difficult to quantify or resolve the timing differences, and they are an important and ongoing issue for forecast comparisons. The forecast performance of the individual forecasters is not disclosed in this study. They are labelled as either Forecaster X, or Forecasting Group Y. Table 2 below lists the forecasters covered in this study.
Table 2 – Forecasters covered in this study
Forecasters Forecasting Groups
ANZ BERL
BNZ IMF
Deutsche Bank Infometrics First NZ Capital NZIER
UBS OECD
Westpac Reserve Bank
Due to the limited availability of consistent forecast data, the comparison focuses only on “current year” and “year ahead” forecasts of GDP and CPI, on a calendar year basis (ie for the year ended December) covering the evaluation period 1996 to 2005.6 A current year forecast is defined as one that is made within the calendar year that the forecast period relates to, and a year ahead forecast is one where the forecast is made in the calendar year prior. For example, a forecast made in April 2004 for the 2004 calendar year is a “current year forecast” and the forecast for the 2005 calendar year is a “year ahead forecast”. Table 3 shows the number of observations and forecasters that are included in this study. Note that the number of forecasters includes the Consensus, Mean and Median calculations.
Table 3 – Number of observations and forecasters
Current year Year ahead Current year Year ahead
GDP 308 312 16 16
CPI 227 231 12 12
Number of observations Number of forecasters
Forecasts for GDP are all in annual average percent change terms and are comparable across all forecasters except for the OECD, which forecasts on an expenditure GDP
basis, not production GDP. The forecasts for CPI are not all on a comparable basis. Data from the Consensus Forecasts are for headline CPI in annual average percent change terms, except for a brief period in 1999 and 2000 when it was for CPIX.7 Reserve Bank and Treasury forecasts are for annual percent change of CPIX for the reference years 1996 to 2000, and annual percent change of headline CPI thereafter. In all instances, the appropriate actual outturn was used to calculate the forecast error.
The method used to compare forecast performance is similar to the one used by Blix et al (2001). It is based on an average relative rank over all the evaluation periods. For each organisation’s GDP and CPI forecast for an evaluation period, a relative rank is assigned based on the mean absolute error. The most accurate (ie, having the lowest mean absolute error) is given a ranking of 1, the next given a ranking of 2 and so on. An average relative rank is then calculated for each organisation over the entire evaluation period. The average relative rank itself is then ranked to allow for easier comparison. This metric does not put any weightings on good or poor forecasts. For example, two forecasters will have similar rankings if one had two fourth placings and a first, while another had three third placings (both will have average relative rankings of 3).
Another metric which places weightings for poor forecast performance is the root mean squared error (RMSE). The RMSE for each forecaster is calculated over all evaluation periods, and ranked. The rankings obtained from the average relative rank based on the mean absolute error can differ, in some cases quite substantially, from that obtained by ranking the RMSE because the latter penalises large forecast errors more severely. Due to the relatively limited sample period, this study focuses more on the average relative rank metric as it does not penalise a forecaster as much for large forecast errors.
3 H e a d - t o - H e a d
C o m p a r i s o n
3 . 1
F o r e c a s t p e r f o r m a n c e a c r o s s a l l e v a l u a t i o n p e r i o d s
Figure 1 presents the average relative rank (based on mean absolute error) for each forecaster’s GDP and CPI forecasts across all evaluation periods (April/May and October/November current year and year ahead forecasts for the periods 1996 to 2005). The best forecast performances are those in the lower left of Figure 1 showing the lowest average relative ranks, while the worst forecast performances are in the upper right. Of the 12 forecasters who forecast both GDP and CPI, the best was the Consensus. The Treasury is among the worst performers for CPI forecasts. Figure 2 presents the RMSE of each forecaster’s GDP and CPI forecasts across all evaluation periods. On the RMSE measure, Treasury’s forecast performance is amongst the poorest for both GDP and CPI. Table 4 presents the average relative rank and RMSE for each forecaster across all evaluation periods. For GDP on an average relative rank basis, the Mean was the most accurate followed by the Median, with the Consensus taking third place. Treasury came in close to the middle of the pack at seventh placing out of 16. Treasury came in 13th based on the RMSE. The difference in ranking based on the average relative rank and RMSE highlights how large forecast errors can affect forecast performance. Treasury’s large forecast error for the 1998 period (see Appendix Figure 8) had quite a material
7 CPIX is the Consumers Price Index excluding credit services and interest charges. It was the target measure of inflation for the
impact on the overall RMSE, which made their RMSE ranking worse than the average relative rank. Treasury forecasters at that time misjudged the impact of the Asian financial crisis and droughts on economic activity, revising their forecasts much later than other forecasters. The Mean, which had the best ranking based on the average relative rank, came in only at fifth place when ranked according to the RMSE. Across all forecasters, the average relative rank and the RMSE usually produce similar rankings but the exceptions to this are Treasury and Forecasting Group 3. For Treasury, the large forecast error in 1998 worsened its RMSE ranking. For Forecasting Group 3, making conservative forecasts ensured that it was not penalised for large forecast errors, but it also means that it is less successful at getting the closest to the actual number.
Large forecasting groups, on average, tend to perform poorly at forecasting GDP compared to private sector forecasters on the average relative rank basis. But their performance is comparable on the RMSE ranking. This suggests that forecasting groups tend to be more conservative in their forecasts, which may not result in a closer forecast to the actual, but lessens the chance of a large forecast error.
Figure 1 – Average relative rank across all evaluation periods
5.0 6.0 7.0 8.0 9.0 10.0 11.0 4.0 4.5 5.0 5.5 6.0 6.5 7.0 CPI7.5 GDP
Forecaster 1 Forecaster 2 Forecaster 3 Forecaster 4 Forecaster 5 Forecaster 6 Forecasting Group 1 Forecasting Group 2 Forecasting Group 3 Forecasting Group 6 Treasury Consensus
Figure 2 – RMSE across all evaluation periods 1.0 1.1 1.2 1.3 1.4 1.5 1.6 0.55 0.60 0.65 0.70 0.75 0.80 CPI0.85 GDP
Forecaster 1 Forecaster 2 Forecaster 3 Forecaster 4 Forecaster 5 Forecaster 6 Forecasting Group 1 Forecasting Group 2 Forecasting Group 3 Forecasting Group 6 Treasury Consensus
Table 4 – Average RMSE and relative rank across all evaluation periods
Ave. Rel. Rank Rank RMSE Rank Ave. Rel. Rank Rank RMSE Rank
Forecaster 1 9.1 15 1.38 10 6.0 8 0.65 5 Forecaster 2 6.4 4 1.27 6 5.4 5 0.66 6 Forecaster 3 8.1 11 1.41 14 4.9 3 0.61 2 Forecaster 4 7.3 8 1.30 7 5.5 6 0.82 12 Forecaster 5 6.9 5 1.37 9 5.2 4 0.68 7 Forecaster 6 7.7 10 1.31 8 4.6 2 0.64 4 Forecasting Group 1 8.8 13 1.44 15 7.0 12 0.82 11 Forecasting Group 2 9.8 16 1.55 16 6.2 9 0.73 9 Forecasting Group 3 7.3 9 1.10 1 5.8 7 0.62 3 Forecasting Group 4 8.8 14 1.39 12 .. .. .. .. Forecasting Group 5 8.7 12 1.39 11 .. .. .. .. Forecasting Group 6 7.1 6 1.23 2 6.3 11 0.71 8 Treasury 7.3 7 1.41 13 6.3 10 0.79 10 Consensus 6.2 3 1.26 4 4.5 1 0.59 1
Median (ex Treasury) 5.7 2 1.25 3 .. .. .. ..
Mean (ex Treasury) 5.5 1 1.3 5 .. .. .. ..
Average 1.33 0.69
Number of forecasters 16 12
GDP CPI
For CPI, the Consensus performed the best on both the average relative rank and RMSE basis. Treasury came in 10th out of 12 on both bases. Large forecast errors for CPI relating to the 1998-2000 period (see Appendix Figure 9) were a large contributor to the poor forecast performance. Overestimating GDP growth for 1998 also led to an overestimation of CPI for the 1998 and 1999 years. In 2000, Treasury underestimated CPI due to the pass-through from the exchange rate depreciation at that time.
3 . 2
F o r e c a s t p e r f o r m a n c e f o r B u d g e t c u r r e n t y e a r
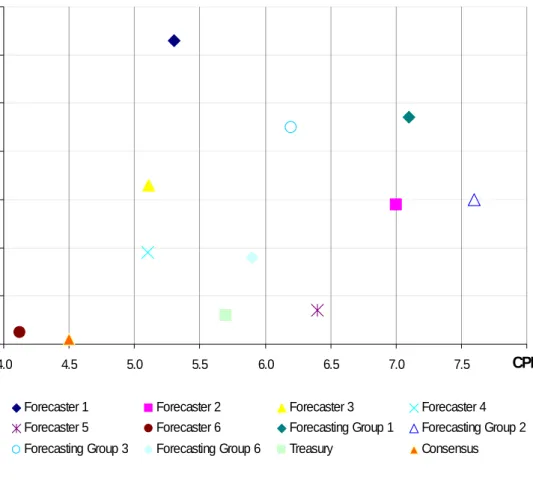
Another useful evaluation of Treasury’s relative forecast performance is to focus on the current year Budget forecasts, since getting an accurate picture of the current economic outlook is a critical input for Budget decision-making and fiscal strategy. Figure 3 presents the average relative rank and Figure 4 presents the RMSE for each forecaster’s GDP and CPI current year forecasts made in April/May to coincide with when Treasury typically finalises its Budget forecasts. Once again, the Consensus performed well on both measures and was in the lower left areas of Figures 3 and 4. Treasury’s forecast performance showed an improvement on both GDP and CPI for current year only forecasts.
Table 5 presents the average relative rank and RMSE for each forecaster. The Mean once again had the best performance for GDP on an average relative rank basis, with the Consensus coming in second. Treasury’s ranking improved to fourth placing on the average relative rank basis, but came in second on the RMSE measure. Major forecasting groups again were outperformed by private sector forecasters on the average relative rank basis, but are comparable on the RMSE measure. For CPI, Treasury was sixth on the average relative rank basis and ninth on the RMSE basis, better than the 10th placing when evaluated across all periods.
Figure 3 – Average relative rank for Budget current year forecast
5.0 6.0 7.0 8.0 9.0 10.0 11.0 12.0 4.0 4.5 5.0 5.5 6.0 6.5 7.0 7.5 CPI8.0 GDP
Forecaster 1 Forecaster 2 Forecaster 3 Forecaster 4 Forecaster 5 Forecaster 6 Forecasting Group 1 Forecasting Group 2 Forecasting Group 3 Forecasting Group 6 Treasury Consensus
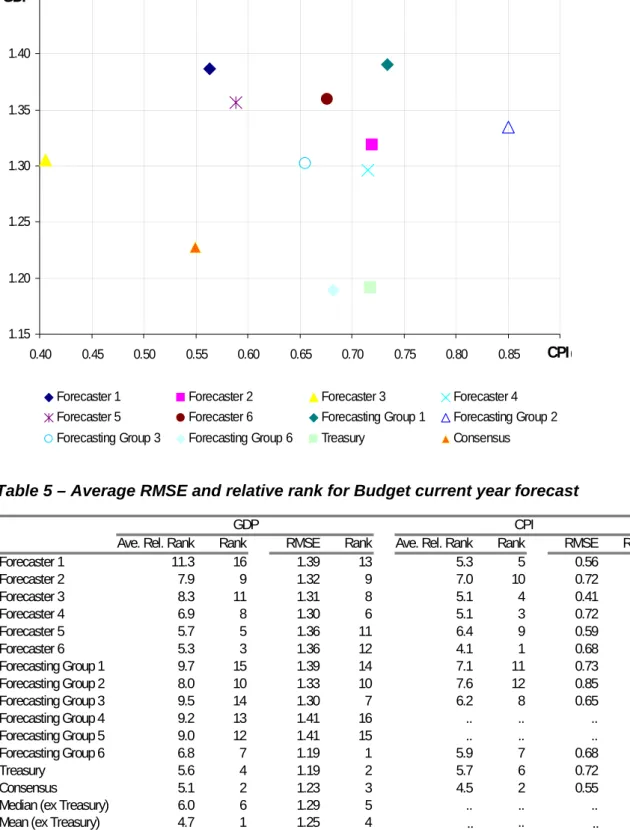
Figure 4 – RMSE for Budget current year forecast 1.15 1.20 1.25 1.30 1.35 1.40 1.45 0.40 0.45 0.50 0.55 0.60 0.65 0.70 0.75 0.80 0.85 CPI0.90 GDP
Forecaster 1 Forecaster 2 Forecaster 3 Forecaster 4 Forecaster 5 Forecaster 6 Forecasting Group 1 Forecasting Group 2 Forecasting Group 3 Forecasting Group 6 Treasury Consensus
Table 5 – Average RMSE and relative rank for Budget current year forecast
Ave. Rel. Rank Rank RMSE Rank Ave. Rel. Rank Rank RMSE Rank
Forecaster 1 11.3 16 1.39 13 5.3 5 0.56 3 Forecaster 2 7.9 9 1.32 9 7.0 10 0.72 10 Forecaster 3 8.3 11 1.31 8 5.1 4 0.41 1 Forecaster 4 6.9 8 1.30 6 5.1 3 0.72 8 Forecaster 5 5.7 5 1.36 11 6.4 9 0.59 4 Forecaster 6 5.3 3 1.36 12 4.1 1 0.68 6 Forecasting Group 1 9.7 15 1.39 14 7.1 11 0.73 11 Forecasting Group 2 8.0 10 1.33 10 7.6 12 0.85 12 Forecasting Group 3 9.5 14 1.30 7 6.2 8 0.65 5 Forecasting Group 4 9.2 13 1.41 16 .. .. .. .. Forecasting Group 5 9.0 12 1.41 15 .. .. .. .. Forecasting Group 6 6.8 7 1.19 1 5.9 7 0.68 7 Treasury 5.6 4 1.19 2 5.7 6 0.72 9 Consensus 5.1 2 1.23 3 4.5 2 0.55 2
Median (ex Treasury) 6.0 6 1.29 5 .. .. .. ..
Mean (ex Treasury) 4.7 1 1.25 4 .. .. .. ..
Average 1.31 0.65
Number of forecasters 16 12
GDP CPI
The improvement in Treasury’s forecast performance for the Budget current year compared to all forecast horizons indicates that Treasury is better at current year forecasts, and underperforms for year ahead forecasts. In the case of GDP, there was a large improvement in forecast performance from seventh to fourth on the average relative rank, and 13th placing to second on the RMSE measure. The big improvement on the RMSE measure was due to the exclusion of the large forecast errors in the year ahead
forecasts relating to the 1998 recession. Treasury’s CPI forecast performance also improved but remains in the middle (sixth out of 12) or the bottom half of all forecasters.
3 . 3
N o o n e c o n s i s t e n t l y o u t p e r f o r m s t h e C o n s e n s u s
Similar to the findings of the international studies cited in the introduction, no individual forecaster in New Zealand consistently outperforms the Consensus (or the Mean) for both GDP and CPI. Forecaster 5 had the highest percentage of out-performance for GDP beating the Mean 44% of the time, yet only placed fifth overall on the average relative rank basis. For CPI, Forecaster 6 had a higher rate of out-performance beating the Consensus 47% of the time, putting it in second place overall on the average relative rank basis. Forecasting Group 2, the worst performer for GDP forecasts, only managed to beat the Mean 18% of the time. Forecasting Group 1, which had the worst performance for CPI forecasts, beat the Consensus 23% of the time. Treasury managed to beat the Mean 30% of the time for GDP, and Consensus 33% of the time for CPI.
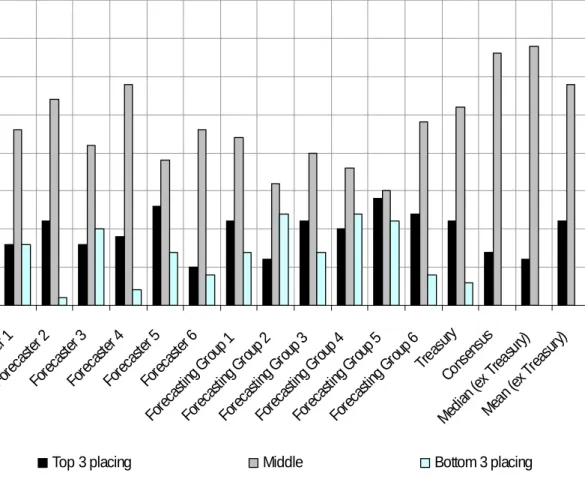
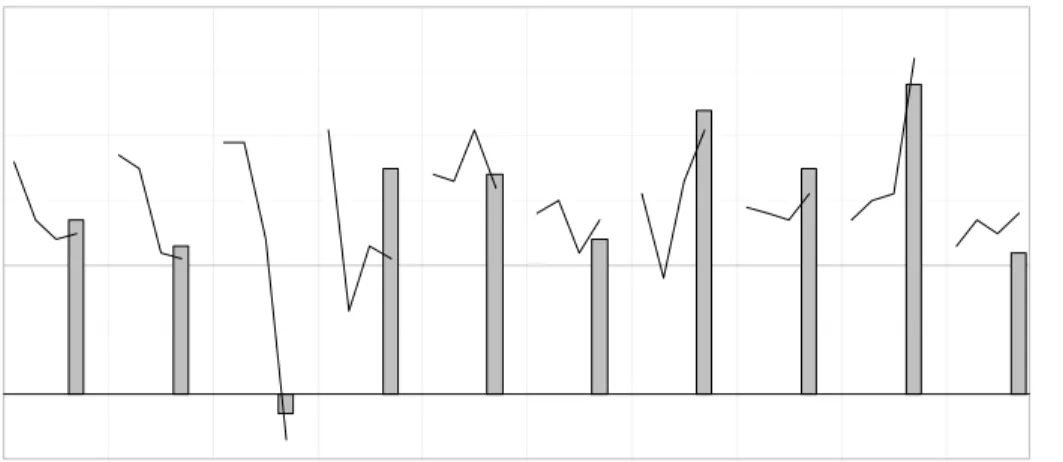
Figure 5 – Frequency of GDP relative ranking over all evaluation periods
0 5 10 15 20 25 30 35 40 Forec aster 1 Forec aster 2 Forec aster 3 Forec aster 4 Forec aster 5 Forec aster 6 Forec astin g Group 1 Forec astin g Group 2 Forec astin g Group 3 Forec astin g Group 4 Forec astin g Group 5 Forec astin g Group 6 Treas ury Cons ensus Median ( ex Tr easu ry) Mean ( ex Tr easury )
Frequency
Top 3 placing Middle Bottom 3 placing
Figures 5 and 6 present the frequency of each forecaster’s relative ranking over all evaluation periods based on either a top 3, middle or bottom 3 placing. Despite the Mean having the best overall performance for GDP, three other forecasters had more top 3 placings. Because the Mean helps smooth out the extreme forecasts, it provides a more reliable and stable forecast performance which is the main reason for its overall top
position. Forecasting Group 5 had the most top 3 placings for GDP, yet placed 12th on the average relative rank and 11th on the RMSE basis.
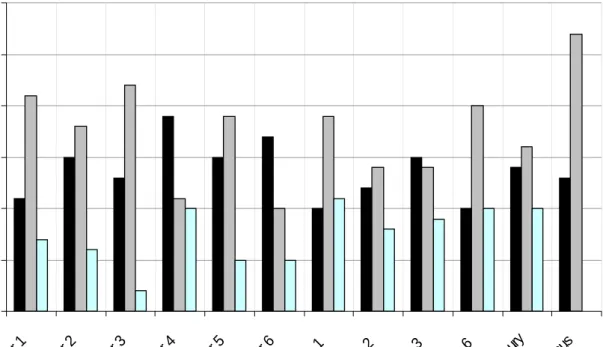
For CPI, Forecaster 4 had the highest number of top 3 placings, even though they came in sixth overall based on the average relative rank. The Consensus had the best overall performance even though over half of the individual forecasters had more top 3 placings. This highlights the importance of consistency in forecast performance.
Treasury had a top 3 placing 11 times out of 40 for GDP forecasts, and 14 times for CPI forecasts. Treasury’s overall forecast performance for CPI was dragged down by a high frequency of bottom 3 placings (10 times).
Figure 6 – Frequency of CPI relative ranking over all evaluation periods
0 5 10 15 20 25 30 Forec aster 1 Forec aster 2 Foreca ster 3 Forec aster 4 Forec aster 5 Forec aster 6 Forec astin g Group 1 Forec astin g Group 2 Forec astin g Group 3 Forec astin g Group 6 Treas ury Cons ensus
Frequency
Top 3 placing Middle Bottom 3 placing
3 . 4
F o r e c a s t i n g t u r n i n g p o i n t s i s d i f f i c u l t
Despite the importance of being able to predict turning points and in particular recessions at an early stage, overseas studies find that the ability of forecasters to predict recessions is poor. For example, Loungani (2001) evaluated the performance of Consensus Forecasts of real GDP growth for a large number of industrialised and developing countries for the time period 1989 to 1998 (calendar years). Only two of the 60 episodes of recessions (defined as any calendar year in which real GDP declined) that occurred over the sample were predicted a year in advance, two-thirds remained undetected by April of the year in which the recession occurred, and in about a quarter of the cases the
forecast in October was still for positive growth (albeit small). Loungani notes that the predictive failure could arise either because forecasters lack the requisite information (in terms of reliable real-time data or reliable models) or because they lack the incentives to predict recessions.
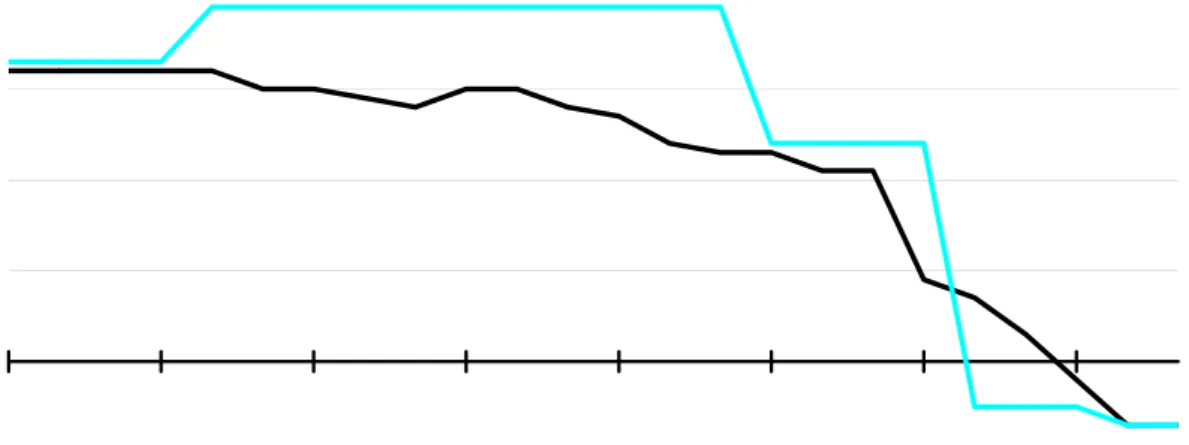
The only recession period in this study was 1998, and consistent with Loungani’s finding, none of the individual forecasters picked the recession even only a few months out. Figure 7 presents the GDP forecast revisions for calendar 1998. Even by April of that year, most forecasters were expecting reasonable growth with a range of 1.6% - 3.5%, with the Consensus at 2.3%. Treasury at that stage was forecasting growth of 2.4%, close to the Consensus but a large downward revision from the previous forecast of 3.9%. Although subsequent forecasts were revised downwards, it was not until October of that year that most forecasters were predicting a recession. In fact, by August, only 2 of the forecasters covered by the Consensus Forecasts were picking a recession. Treasury at that stage, in a one-off forecast update in August, had revised down its forecast to -0.5%. In the September edition of Consensus Forecasts, almost half of the 13 forecasters surveyed were predicting a recession, but the Consensus remained positive at 0.3%.
Figure 7 – GDP forecast revisions for 1998
-1 0 1 2 3 4 5
Jan-97 Apr-97 Jul-97 Oct-97 Jan-98 Apr-98 Jul-98 Oct-98
Consensus
Treasury
Annual average % change
Forecasters find it equally difficult to predict the peak of the economic cycle. The peak of GDP growth over the evaluation period was in 2004 at 4.8%. Twenty months out, the range of forecasts was 2.1% - 3.6%, with the Consensus at 2.7%. Fourteen months out, the forecast range was actually revised downwards to 1.9% - 3.2%, although the Consensus remained at 2.7%. By April 2004, the Consensus was revised up to 3%, but the forecast range of 2.5% - 3.6% still did not encompass the actual outturn. It was not until July that the forecast range included the actual outturn.
4 C o n c l u s i o n
This study extends Treasury’s current forecast accuracy work by making direct comparisons of Treasury’s forecast performance against other forecasters. When compared across all evaluation periods (calendar years 1996-2005), Treasury’s GDP forecast performance was ranked in the middle at seventh place out of 16 on the average relative rank basis. Treasury forecasters misjudged the impact of the Asian financial crisis and droughts on economic activity in 1998, resulting in large forecast errors at that time which had a material impact on Treasury’s overall forecast performance. This is reflected in a relatively large RMSE compared to other forecasters. When compared only against other individual forecasters across all evaluation periods (ie, excluding Consensus, Median and Mean), Treasury’s GDP forecast performance is in the top half, and better than other major forecasting groups. However, Treasury’s CPI forecast performance ranks in the bottom half, out-performing only two other forecasting groups. Large forecast errors for CPI relating to the 1998-2000 period were a large contributor to the poor forecast performance.
Treasury’s forecast performance was better when evaluating only the current year Budget forecasts, placing fourth for GDP and sixth for CPI. This suggests that Treasury is better at forecasting the current year than the year ahead. Compared to other individual forecasters, Treasury’s Budget current year GDP forecast was bettered only by one other forecaster.
Consistent with international studies, no single forecaster consistently outperforms the Consensus, and all forecasters find it difficult to pick recessions and turning points. Large forecasting groups, on average, tend to perform poorly at forecasting GDP compared to private sector forecasters on the average relative rank basis. This finding is similar to Blix et al (2001). But their performance is comparable on the RMSE ranking, suggesting that forecasting groups tend to be more conservative in their forecasts, which may not result in a closer forecast to the actual, but lessens the chance of a large forecast error. Another possible explanation is that major forecasting groups tend to produce comprehensive forecasts at certain times during the year, which do not coincide with the dates chosen for this study. Their responses to Consensus Economics could therefore be quick updates which reduce their forecast performance. It is difficult to quantify and resolve this timing issue which may affect forecasting performance as measured in this comparison.
R e f e r e n c e s
Batchelor, R. (2001) How useful are the forecasts of intergovernmental agencies? The IMF and OECD versus the consensus, Applied Economics 33, p225-235.
Blix, M., Wadefjord, J., Wienecke, U. and Adahl, M. (2001) How good is the forecasting performance of major institutions?, Economic Review 3, p38-68.
Juhn, G. and Loungani, P. (2002) Further cross-country evidence on the accuracy of the private sector’s output forecasts, IMF Staff Papers, Vol. 49, No. 1, p49-64.
Lenain, P. (2001) What is the track record of OECD economic projections?, OECD note. Loungani, P. (2001) How accurate are private sector forecasts? Cross-country evidence from consensus forecasts for output growth, International Journal of Forecasting 17, p419-432.
Zarnowitz, V. (1986), "The Record and Improvability of Economic Forecasting", National Bureau of Economic Research Working Paper 2099.
Zarnowitz, V. (1984), "The accuracy of individual and group forecasts from business outlook surveys", Journal of Forecasting, 3(1), 11-26.
Zarnowitz, V. and Braun, P. (1992), “Twenty-two year of the NBER-ASA quarterly economic outlook surveys: aspects and comparisons of forecasting performance”, National Bureau of Economic Research Working Paper 3965.
A p p e n d i x
Figure 8 – Treasury GDP forecast revisions and actual
-1 0 1 2 3 4 5 6 1996 1997 1998 1999 2000 2001 2002 2003 2004 2005
Actual Treasury forecasts
Annual average % change
Figure 9 – Treasury CPI forecast revisions and actual
0.0 1.0 2.0 3.0 4.0 1996 1997 1998 1999 2000 2001 2002 2003 2004 2005
Actual Treasury forecasts