Kathrine Lærke Søndergaard Line Floan Almli
Characteristics of family firms
with family management
BI NORWEGIAN BUSINESS SCHOOL – THESIS REPORT
Hand-in date:
01.09.2011
Supervisor:Øyvind Bøhren
Examination code and name:GRA1900 Master Thesis
Program:
Master of Science in Business and Economics
This thesis is a part of the MSc program at BI Norwegian Business School.
Abstract
In this paper we examine what characterizes family firms’ decisions when it comes to having a family member being the CEO or the chairman of the board of the company. We define this as family management, which is the dependent variable in our research. This variable has four non-ordered mutually exclusive values; family CEO, family
chairman of the board, family CEO and family chairman of the board, and neither family CEO nor family chairman of the board. Using data from the Center for Corporate Governance Research (CCGR) we have analyzed approximately 79,000 Norwegian private family firms. Based on a thorough literature review we chose performance, firm size, firm age, family ownership stake, fraction of family board members, and industry risk as our independent variables in the base case model. We find that some
determinants of family management are the same for all categories of family
management, while other determinants make the choice differ. The choice of having a family CEO is more likely in large firms, with high family ownership stake and low industry risk, whereas the choice of having a chair is more likely in small firms with low family ownership stake. The choice of having family members in both positions is more likely in small firms with a high family ownership stake and low industry risk. This shows that the combination of characteristics determines what type of family management family firms choose. We also find that family management overall is more likely in young family firms with high performance and a high fraction of family members on the board. This shows how the choices are related as well as how they differ. Conversely, family firms are more likely to replace a family member in the management subsequent to low performance, if the firm is older, or if there is a low fraction of family members on the board. An analysis of the findings indicates that families both hold and use control in order to secure the management positions, especially when the fraction of family members on the board is high. Nevertheless, it seems that families, opposed to earlier, now need and want a higher ownership stake before taking this control, which
illustrates a seemingly positive trend. These two opposing forces are the most interesting finding throughout the paper, and demonstrate what can be changing governance mechanisms.
We want to thank our supervisor Øyvind Bøhren for input, comments and support throughout the last year. We also want to thank the Center for Corporate Governance Research and especially Jing Yu for help during the data extraction process.
Table of Contents
ABSTRACT ...I TABLE OF CONTENTS ...II
1. INTRODUCTION ... 1
2. THEORY AND MOTIVATION ... 1
2.1EXISTING RESEARCH ... 1
2.2MOTIVATION ... 3
3. RESEARCH QUESTION ... 4
3.1MAIN RESEARCH QUESTION ... 4
3.2SUB-QUESTIONS ... 4 4. DATA ... 4 4.1DATABASE... 4 4.2DATA FILTERS... 4 4.3VARIABLES ... 5 5. METHODOLOGY ... 9 5.1REGRESSION MODEL ... 9 5.2ENDOGENEITY PROBLEM ... 11 6. MAIN RESULTS ... 11 6.1DESCRIPTIVE STATISTICS ... 11 6.2REGRESSIONS ... 15 6.3ROBUSTNESS TESTING ... 19 6.3.1 Multicollinearity ... 19 6.3.2 Model specification ... 19
6.3.3 Alternative empirical proxies ... 20
6.3.4 Alternative theoretical variables ... 22
7. CONCLUSION ... 24
8. LIMITATIONS ... 25
9. REFERENCES ... 27
Page 1 of 38
1. Introduction
Family firms are an interesting field of research within corporate governance due to their distinction from other firms. Defining family firms as firms where a blood-and-marriage family owns more than 50% of the equity, approximately 68% of all active Norwegian firms are family firms. This makes them a significant part of the Norwegian economy (Bøhren 2011). These family firms are almost always private, but in contrast to how common they are, private firms are an underexplored area of study (Berzins, Bøhren and Rydland 2008). If studied, most research is either based on public family firms or weak family firm definitions. The research has mainly focused on the
relationship between family ownership and performance, while few papers concern the actual behavior of family firms. Through this paper we want to investigate this behavior and determine what characterizes the choice of family management in family firms. Henceforth, we define family management as a situation where a family firm has a family CEO or a family chairman of the board of directors, or hold both positions at the same point in time.
2. Theory and motivation
2.1 Existing research
In the area of corporate governance and family firms, agency theory is essential for understanding concepts of ownership and management. The first agency problem (A1) deals with conflicts between owners and managers (Villalonga and Amit 2006). It is assumed to be less prevalent in family firms as the separation between owners and managers, i.e. ownership and control, is less widespread. This suggests that the costs of A1 are low, thus performance of family firms should be enhanced (Bhaumik and
Gregoriou 2009). The second agency problem (A2) deals with conflicts between large and small shareholders (Villalonga and Amit 2006), where we consider the family as the majority shareholder. The family might have incentives to extract private benefits at the expense of minority shareholders, which in consequence can reduce firm value from the minority’s point of view. The significance of the second agency problem is ambiguous. In a situation where the family owns just above 50%, the possible conflicts are more serious than if the family has a 100% ownership stake. Thus, if the family ownership stake is very high, the problem is limited seeing that the family carries most of the cost of A2 themselves (Bøhren 2011). Nevertheless, the family’s exploitation of the minority owners might have a serious effect on the firm’s performance (Bhaumik and Gregoriou
Page 2 of 38 2009), which indicates that the second agency problem is certainly present. Therefore, the second agency problem will be a prime focus throughout this study.
Anderson and Reeb (2003) explore the relationship between founding-family ownership of S&P500 firms, and performance, measured by either return on assets (ROA) or Tobin’s q. They found that family firms outperform non-family firms, which together with other studies (e.g. Villalonga and Amit 2006, Maury 2006) support a positive relationship between performance and family ownership. This suggests that conflicts between owners and managers (A1) and conflicts between small and large owners (A2) are less serious in family firms relative to non-family firms. These results concern family firms overall, and do not consider the management structure within the firms.
Taking management into account, the first agency problem should be insignificant in family firms with family management due to no separation between ownership and management. This will especially be the case in a situation where a family member is the CEO, as this position holds more of the actual decision-making authority within the firm. However, with family management the family is assumed to obtain more information about the firm and consequently achieve more control (Bøhren 2011). Thus, family management might aggravate the second agency problem because extraction of private benefits are more likely when the CEO or/and the chairman of the board are insiders. Anderson and Reeb (2003) found that family firms with a family CEO outperform family firms with outside management. In a study of Fortune 500 firms, Villalonga and Amit (2006) also found a positive relationship between performance and family management, but only when the family CEO was the founder of the firm or when a non-family CEO existed in the presence of the founder as the chairman of the board. This indicates that the founders are one of the main reasons for the success of family firms due to their passion and involvement in the firm’s operations. Cucculelli and Micucci (2008) support this by finding that family successions in Italian family firms have a negative impact on performance. Hillier and McColgan (2009) investigated UK listed companies and found that the performance of family firms, measured by return on assets, improves after announcement of a departing family CEO. This effect is ascribed to the fact that family CEOs are not forced to leave their position subsequent to weak firm performance, relative to non-family CEOs. Finally, Barth, Gulbrandsen and Schøne (2005) show that family firms with an outside CEO have the same productivity as non-family firms, whereas family firms with an inside CEO are less productive. This supports that the
Page 3 of 38 conflict between large and small shareholders are aggravated with an inside CEO due to their control of the firm. However, it might also indicate that inside managers are poor performing managers in general. Therefore, the results could occur due to the
management’s effectiveness, not the allocation of managerial positions.
Bennedsen et al. (2006) investigated Danish family firms and the relationship between family succession decisions and performance, measured by operating return on assets. They found an immense negative impact on firm performance, particularly in large firms and firms that operate in fast-growing and complex industries. This suggests that different characteristics affect the outcome of changes in the management of family firms. Thus, the interesting question is; what drives the appointment of family management?
2.2 Motivation
Using unique data consisting of all public and private firms in Norway, we are able to investigate family firms with family management in a more comprehensive way than research based on listed family firms. Previous research has foremost focused on the performance of family firms, while few have concerned the behavior of family firms. From our literature review we observe that studies of family firm performance are altered when taking family management and other characteristics into account.
However, few studies have been centered on these characteristics as the explanation for the behavior of family firms. We will distinguish between different types of family involvement, by categorizing family management based on the definition previously elaborated.
The explanatory variables we find relevant to include in our study are: firm performance, firm size, firm age, family ownership stake, fraction of inside board members, and industry risk. These variables have already been applied in previous research, but falls within three different categories: control variables, independent variables in research concerning family succession, or independent variables in research concerning family firm performance. None of the variables have had the leading role in the understanding of family firm behavior. Therefore, in this study we intend to turn the equation and see what characteristics determine the choice of family management in family firms. This is a rarely observed approach, and combined with our unique data we believe that our thesis will contribute to a more comprehensive and integrated
Page 4 of 38
3. Research question
3.1 Main research question
We want to examine what characterizes the decision of having a family member being the CEO or the chairman of the board of a family firm. This includes both what
determines the choices separately, but also if there is a relationship between the two choices. Accordingly, our main research question is:
What characterizes family firms with family management?
3.2 Sub-questions
Based on our research question, we propose the following sub-questions:
What characterizes a family firm with a family CEO?
What characterizes a family firm with a family chairman of the board?
What is the relationship between these choices?
4. Data
4.1 Database
We utilize data from Norwegian private and public firms in the period from 2000 – 2009, supplementing with accounting figures dated back to 1997. We employ data from the Center for Corporate Governance Research (CCGR) at BI Norwegian Business School.
4.2 Data filters
The population consists of over 357,000 companies. To ensure consistency in the research of family firms we will apply relevant filters, including filters from Berzins, Bøhren and Rydland (2008):
Page 5 of 38
Filter 1: Remove all companies without limited liability Filter 2: Positive sales
Filter 3: Positive assets
Filter 4: Companies must have employees in the sample period Filter 5: Current assets must exceed cash equivalents
Filter 6: Assets must exceed working capital Filter 7: Remove financial firms
Filter 8: Remove subsidiaries1 Filter 9: Remove listed firms
Filter 10: Companies must have four years or more of data
Filter 1-4 ensures that the firms in the sample have limited liability and are active (Svalland and Vangstein 2009). Filter 5 and 6 put consistency restrictions on the relationship between a sum and its components (Berzins, Bøhren and Rydland 2008). Filter 7 and 8 are also applied by Berzins, Bøhren and Rydland (2008), where the latter makes us focus on parent companies and their consolidated numbers. Filter 9 is applied as only a fraction of the firms are listed and these hold different characteristics than non-listed firms (Berzins, Bøhren and Rydland 2008). Lastly, to secure a consistency in the sample, as well as secure a certain level of activity, we apply a lower cut-off of four years of accounting data. In the base case model we end up with a sample of 78,783 unique companies.
4.3 Variables
Family firmFamily firms are defined as firms where a blood-and-marriage family owns more than 50% of the firm’s equity. In other words, the cut-off point of family firms is determined whether or not the family has a simple majority in the firm.
Family management
We define family management as a situation where a family member, by blood or marriage, is the CEO and/or the chairman of the board of the family firm.
1
Where the parent company is a holding company, defined as parent company with non-existing sales, the largest subsidiary is included in the sample.
Page 6 of 38
Performance
We measure performance by return on assets (ROA). According to Bodie, Kane and Marcus (2009) ROA measures the profitability for all contributors of capital. It is defined as:
The tax rate is 28%2. We use average performance of 3 years in our model, i.e. the average of the current year and the two past years. The choice of performance variable is firstly due to a possible endogeneity problem which will be discussed later. Secondly, average performance will diminish the effect of extraordinary economic events. The average performance the last t years is defined as:
ROA measures how well the management uses the firm’s assets to create profit through the operations of the firm (Robinson et al. 2009). As mentioned before, existing research supports both a negative and a positive relationship between performance and family firms, although the support is stronger for a positive relationship. Whether the performance is related to agency problems or the actual performance of the management is a problem addressed in the literature review. According to Bøhren (2011), family management creates fewer conflicts between owners and managers. However, by choosing a family CEO the firm might ignore the best candidate for the job. One can expect that if a firm has good performance they can afford to hire a non-family CEO. Nevertheless, the performance might be satisfactory such that owners do not see the need of hiring a non-family CEO. Consequently, there are two competing predictions for the relationship between family management and performance.
Size
We measure firm size by the natural logarithm of sales. We have chosen this measure to make size independent of the firm’s technology and capital structure. The size may affect the stability of the firm, which again could affect the choice of management. According to Anderson and Reeb’s (2003) study of S&P500 family firms, these are smaller than other firms. This is supported by a recent study of Norwegian firms that
Page 7 of 38 family firms are smaller than non-family firms (Bøhren 2011). Focusing on family
management in family firms, existing research indicates that family management is more common in smaller firms. Bennedsen et al. (2006) found that family firms with a family successor are smaller than firms that select a non-family CEO. Smith and Amoako-Adu’s (1999) paper discovered that family successions are more challenging and value-reducing in smaller firms because the CEO of smaller firms has more control than in larger firms. Cucculelli and Micucci (2008) support the argument of Smith and Amoako-Adu (1999), when finding that replacing the founder of a small- or medium-size
company is more challenging because of the founder’s close personal ties with the stakeholders of the firm. Thus, the two latter arguments deal with the relationship between firm size and family management from an agency point of view. Based on these arguments, we expect that family management is more prevalent in smaller firms. Notwithstanding, we expect that the type of family management differ in larger family firms. It is likely that the need for a professional, outside CEO is greater in large firms, but that the family retains some control by holding the position as the chairman of the board. This again makes it less likely that the family holds both positions simultaneously. The appointment of CEO is therefore based on a skill argument, while the appointment of chair is based on an agency argument. Thus, we expect a negative relation between family CEO and firm size, and a likewise positive relationship between family chair and firm size.
Firm age
We measure firm age by the exact number of years the company has been operating. Villalonga and Amit (2006) analyze firm age, and find that family firms are younger than non-family firms. Bennedsen et al. (2006) find that performance is not affected by firm age around successions. We expect that when family firms are new, a family founder is a part of the management. However, it is also likely that old family firms choose family management due to their traditional views and close relationships with employees and board members. Nevertheless, we expect there to be a negative relationship between firm age and family CEO, as founders of newly established family firms are more likely to choose the role of CEO over the position as chairman. This is substantiated by the fact that 35 % of family firms are single-owner firms (Bøhren 2011), and that the founder in many cases has to choose between the two management positions (Lov om
Page 8 of 38 aksjeselskaper 1997)3. However, we also expect a negative relationship between firm age and family chairman as the family founder will choose an owning or a non-owning family member as the chairman.
Family ownership stake in the firm
We measure the family ownership stake by the fraction of family owners over the numbers of owners. According to Bøhren (2011) there are many family firms with super-majority or even no other owners than the family. From agency theory we know that in a firm where the majority owner has an ownership stake just above 50%, possible conflicts between large and small owners (A2) are more serious compared to a firm where the majority owner has close to 100% ownership stake. The reason is that majority owners’ incentives to extract private benefits are larger when they own just above 50%. We believe that as the ownership stake of the family decreases it will be more challenging to implement family management. This is because minority shareholders want to prevent the majority owner, the family, of getting extended control. Another hypothesis is that a non-family CEO can be chosen even with a large family ownership stake, because the family can obtain control through the board of directors. This resembles the outcome- and substitution model normally applied to the choice of a firm’s dividend policy (Bøhren 2011)4. The family might also have incentives to hire a family CEO when the family ownership stake is decreasing in order to remain in control. We assume that the outcome model is the most relevant in this situation, meaning that the family has the power and chooses to use it. Accordingly, we expect to see a positive relationship between family management and family ownership stake.
Fraction of inside board members
We measure the fraction of inside board members by the number of inside board members over the total number of board members. Smith and Amoako-Adu (1999) found that the average number of family board members is higher when appointing a family member as the CEO. We therefore expect that as the fraction of insiders of the board increase, the choice of family management is more common than in the case of
3 In firms with equity of NOKM 3 or higher, one person can either be the CEO or the chairman of the board, but can only hold one position at a time.
4
The choice of dividend policy is applied to the choice of family management. The model illustrates that the majority does not necessarily use their control to exploit the minority.
Page 9 of 38 boards with a large fraction of independent directors. We assume this will apply for all categories of family management.
Industry risk
Like Svalland and Vangstein (2009) we measure industry risk by using the coefficient of variation of earnings as a proxy. This is defined as the ratio of standard deviation to the mean of operating income5, and is useful in determining the assumed volatility
compared to the expected operating income (Black 2010). The industry risk is computed as the average industry risk within each industry code for the whole time period
between 2000 and 2009. Villalonga and Amit (2006) find that the distribution of family firms across industries is not uniformly distributed. According to Bøhren (2011) owning managers with a high ownership stake are often undiversified because they receive their income and most of their fortune from the same source, namely the firm. From this we assume that family managers will be more risk averse than independent managers. Owners are likely more concerned in high-risk industries where there is more
uncertainty related to firm performance. Hence, the demand for a “professional” non-family CEO is higher. We expect that non-family management is less prevalent in firms exposed to high industry risk, and we expect that the relationship to be stronger when it comes to the family holding the position as the CEO.
5. Methodology
5.1 Regression model
To model what determines the choice of family management, family management is chosen as the dependent variable. We let the dependent variable have four non-ordered, mutually exclusive values:
Y1: Family CEO
Y2: Family chairman of the board
Y3: Family CEO and family chairman of the board
Y4: Neither family CEO nor family chairman of the board
The variables described in chapter 4.3 will be the independent variables of the model to observe how these affect the choice of family management.
Page 10 of 38 When the dependent variable has multiple outcomes that cannot be ordered, we apply a multinomial logistic model. According to Borooah (2002) this is a valid method when we examine choices that have no apparent negative or positive connotation. In a multinomial logistic specification, the dependent variable represents discrete choices, which corresponds to the four non-ordered values above.
We propose the following multinomial logistic model:
risk industry members board family fraction stak ownership family age firm size firm e performanc variable t independen 6 5 4 3 2 3 1( ) e Y Y i i i iIn the model, α is a constant and ε is the error term.
As we have many companies with observations over time, the data is considered as panel or longitudinal data. Seeing that a multinomial logistic model is not compatible with panel data, we run year-by-year regressions to deal with this issue. Table 1 gives a more stylistic view of the model, as well as specifies the expected sign of the
independent variables based on the discussion above:
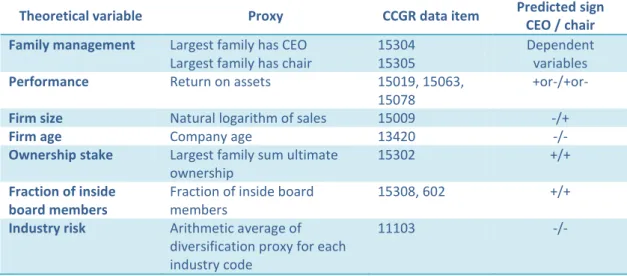
Table 1: Regression model with predictions
Theoretical variable Proxy CCGR data item Predicted sign CEO / chair Family management Largest family has CEO
Largest family has chair
15304 15305
Dependent variables
Performance Return on assets 15019, 15063, 15078
+or-/+or-
Firm size Natural logarithm of sales 15009 -/+
Firm age Company age 13420 -/-
Ownership stake Largest family sum ultimate ownership
15302 +/+
Fraction of inside board members
Fraction of inside board members
15308, 602 +/+
Industry risk Arithmetic average of diversification proxy for each industry code
Page 11 of 38
5.2 Endogeneity problem
The study has a potential endogeneity problem. There is a possibility that not only firm performance affects the choice of CEO, but that family management also affects performance. This endogeneity problem might apply to other variables as well, such as the relationship between firm size and family management. The problem also involves the issue of multicollinearity, as related governance mechanisms might generate insignificant results (Berzins, Bøhren and Rydland 2008).
Several measures have been taken to account for this. Firstly, letting performance be an independent variable in a logistic regression deals with the causality issue. Secondly, using average performance the past three years will also mitigate the problem. The problem of multicollinearity will be dealt with in the robustness testing.
6. Main results
6.1 Descriptive statistics
Hereafter, the four choices of family management are referred to as family CEO, family chair, both or neither. Table 2 shows pooled descriptive statistics of the variables in the main sample. All variables are based on nominal levels, unless otherwise stated. Family management is the dependent variable consisting of the above mentioned four mutually exclusive values. Seeing that the median is 3 the majority of the family firms choose to have both family CEO and family chair. This indicates that families prefer to keep all control of the company within the family. We observe a mean return on assets (ROA) of 8.65%. There are extreme positive and negative values of performance, but most of the firms’ performance is distributed close to the mean.
Family
management ROA Firm size Firm age
Family ownership
stake
Fraction of family board
members Industry risk
Mean 2,7511 0,0865 14,8070 11,7208 0,9166 0,8542 1,6379 Median 3,0000 0,0750 14,8997 9,0000 1,0000 1,0000 1,6269 Std.dev. of mean 0,0009 0,0002 0,0024 0,0157 0,0002 0,0004 0,0004 Skewness -1,4716 -0,1392 -0,7019 2,8594 -0,0149 -1,6150 1,8041 Kurtosis 2,0562 2,2542 1,3933 14,9581 0,0062 1,4680 7,0903 Minimum 1,0000 -0,4372 6,9078 0,0000 0,5010 0,0000 -0,3871 Maximum 4,0000 0,5080 18,4205 167,0000 1,0000 1,0000 3,3617
Table 2: Descriptive statistics main sample
The table shows pooled descriptive statistics of the independent variables. Family management is the dependent variable, consisting of four mutually exclusive values. ROA is NOPAT over average total assets. Firm size is the natural logarithm of assets. Firm age is the number of years the company has been operating. Industry risk is the natural logaritm of coefficient of variation, defined as the standard deviation of operating income over mean operating income. In addition to the filters in chapter 4, ROA is winsorized at the 1st and 99th percentile.
Page 12 of 38 Measuring firm size by the natural logarithm of sales, we find a mean and median of approximately 14.8, which indicates yearly sales of approximately NOKM 2.7.
Furthermore, the sample consists of firms with an average age of 11.7 years and median of 9 years. Observing a maximum value of 167 years we see that extreme values are included in the sample, which is supported by a very high kurtosis. The large, positive skewness substantiates that most firms are young.
Seeing that the data only includes family firms, the minimum value of family ownership stake is 50.1%. Even so, the mean is 91.66% and the median is 100%, indicating high ownership concentration. Negative skewness suggests that most family firms have a large family ownership stake. On average, 85.42% of the board consists of family members, and the median is 100%. A negatively skewed distribution demonstrates that family firms have a high fraction of family members on the board. Finally, the mean industry risk is 1.64. The positive skewness indicates that more family firms have lower industry risk, while the high kurtosis is due to the extreme maximum value of industry risk.
From table 3, we see that performance, firm size, and industry risk has been relatively stable during the sample period from 2000 to 2009. Firm age has increased during the overall period, indicating that the sample firms have overall survived. However, looking at the three last years of the period we observe that the number of sample firms has decreased. This might demonstrate either the increased number of bankruptcies during the financial crisis around 2008 or that newly established firms do not have enough accounting data to be included in the sample. Nevertheless, both family ownership stake and fraction of family board members during the sample period have increased, which might be due to family firms including new and younger members of the family.
Page 13 of 38 2000 2001 2002 2003 2004 2005 2006 2007 2008 2009 N 43 970 46 550 46 726 48 548 48 816 46 621 45 432 49 019 46 625 44 582 Family management 2,7568 2,7498 2,7524 2,7333 2,7583 2,7529 2,7561 2,7504 2,7499 2,7515 0,6565 0,6645 0,6523 0,6430 0,6543 0,6232 0,6305 0,6230 0,6213 0,6199 ROA 0,0876 0,0831 0,0828 0,0790 0,0851 0,0839 0,0887 0,0950 0,0935 0,0853 0,1389 0,1405 0,1416 0,1447 0,1472 0,1483 0,1475 0,1411 0,1411 0,1362 Firm size 14,7443 14,7338 14,7505 14,7325 14,7886 14,7096 14,7807 14,9369 14,9694 14,9214 1,6106 1,6348 1,6464 1,6499 1,6321 1,6101 1,6464 1,6378 1,6621 1,6922 Firm age 10,1391 9,7871 10,7360 11,0155 11,6177 11,3314 12,2327 12,3392 13,3375 14,2563 10,5746 9,5455 9,5234 10,5186 10,5669 10,5127 10,5326 10,7762 10,8413 10,8117
Family ownership stake 90,3768 90,5931 90,5794 90,7379 91,0208 91,9195 91,9360 92,9919 93,1504 93,3400
15,8349 15,7049 15,7069 15,5766 15,3952 14,7893 14,7947 14,0111 13,8604 13,7004
Fraction of family board members 0,8384 0,8376 0,8433 0,8485 0,8442 0,8615 0,8600 0,8676 0,8701 0,8702
0,2773 0,2806 0,2719 0,2635 0,2741 0,2548 0,2607 0,2492 0,2467 0,2471
Industry risk 1,6504 1,6556 1,6545 1,6516 1,6522 1,6528 1,6510 1,6472 1,6473 1,5169
0,2868 0,2913 0,2904 0,2860 0,2861 0,2896 0,2863 0,2843 0,2850 0,3570
The table shows yearly mean and standard deviation of the independent variables, as well as the number of observations. Please refer to table 1 for the definitions of variables.
Table 3: Descriptive statistics per year
N ROA Firm size Firm age
Family ownership
stake
Fraction of family board
members Industry risk Family only has CEO 35 455 0,0727 15,3957 11,8581 81,2834 0,4162 0,0025
(7,59 %) 0,1375 1,5897 10,2665 22,4475 0,1989 0,2507
Family only has Chair 61 565 0,0807 14,7979 11,4789 89,1391 0,8421 0,0220
(13,19 %) 0,1512 1,6977 9,7618 23,9299 0,2831 0,2710
Family has both 353 626 0,0905 14,7321 11,7429 93,6744 0,9270 0,0299
(75,74 %) 0,1416 1,6000 10,5255 16,5736 0,1944 0,2475
Family has neither 16 243 0,0534 15,1873 11,8680 80,1175 0,2300 -0,0161
(3,48 %) 0,1538 1,6763 10,3743 20,8477 0,2211 0,2753
The table shows pooled mean and standard deviation for the independent variables per management category, as well as the number (percentage) of observations within each category. Please refer to table 2 for definitions of the variables.
Page 14 of 38 From table 4 we see that the majority of the firms (75.74%) included in the sample have both family CEO and family chair. Based on this we might infer that family firms view family CEO and family chair as complements rather than substitutes. By looking at family management as a whole we find that 96.52% of the firms have family management. This demonstrates that most Norwegian family firms choose family members to manage the firm, and support the assumption that the outcome model can be applied.
Family firms have the highest performance (9.05%) when they have both family CEO and family chair. Firms with outside CEO and chair have the lowest performance (5.34%). Family ownership stake is largest among firms with both family CEO and family chair. Interestingly, there is very little difference between the family ownership stake for firms with family CEO and that of firms without family management. When the fraction of family board members is high, family firms are likely to have family chair or both. The fraction is much lower for firms with only family CEO, and lowest for firms with no family management. A possible explanation is that boards are relatively small and that the fraction increases considerably with a family chair. Firms with family chair or both family CEO and chair have considerably higher industry risk than firms with family CEO or no family management. This shows that in high-risk industries the family retains control through the position as the chairman, while the position as the CEO differs.
Lastly, firm size and company age are similar for firms with and without family management, indicating little relation to the firms’ choice of family management. Looking at the table as a whole it seems like the characteristics of family firms with family chair and both family chair and CEO are similar.
In conclusion, from the descriptive statistics we see that most family firms are family managed, with the majority having both family CEO and family chair. Family ownership fraction and fraction of family board members are high, where the highest is within firms with both family CEO and chair. The performance of family firms with family management are close to the mean for the whole sample, while family firms without family management have considerable lower ROA. Family firms with family chair, or both family CEO and chair, operate within more risky industries. Family firms are mostly young and small, independent of the management, and all variables seem fairly stable over time.
Page 15 of 38
6.2 Regressions
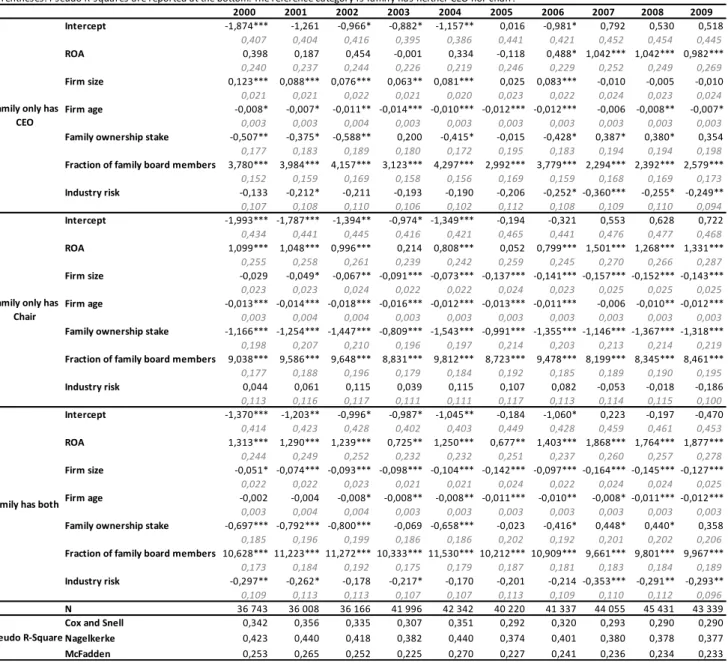
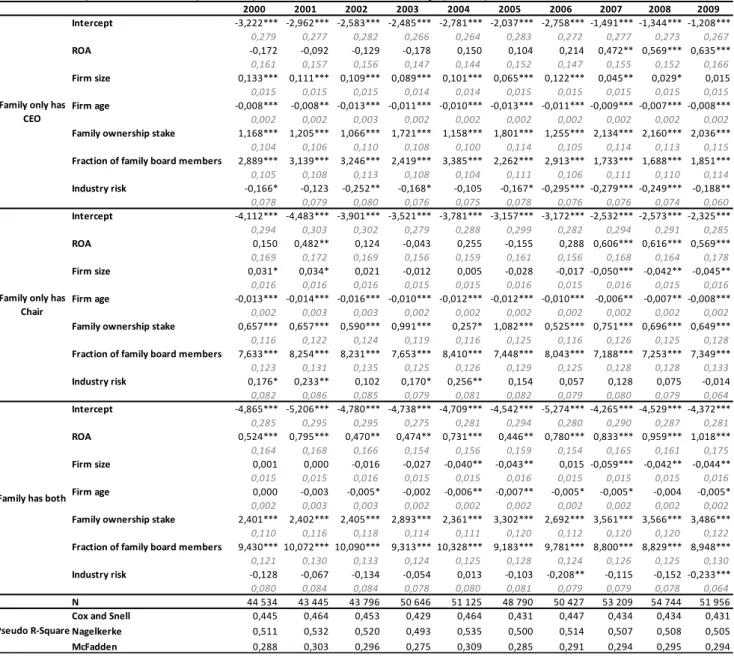
The results from the base case regression are reported in table 5. The reference category is defined as ‘Family has neither CEO nor chair’, meaning that each coefficient is relative to this choice. Coefficient values above zero indicate that a one-unit increase of the variable in question will lead to a greater likelihood of choosing the family management type in question. The exact likelihood, the odds ratio, is given by the exponential of each coefficient (Costea 2005).
Firm performance measured by ROA has a significant, positive effect on the choice of hiring family CEO, family chair or both. The strongest effect is with respect to having both, with a coefficient of 1.877 in 2009 corresponding to an odds ratio of 6.5. Interestingly, ROA did not have a significant effect on the choice of family CEO until 2006, indicating that firm performance has not been a determinant of family CEO until the recent years. A positive relationship between performance and family management, and a likewise negative relationship between performance and non-family management, indicates that during bad times, family management are more likely to be replaced with non-family management, either voluntarily or forced. On the one hand this might show that family firms reciprocate against management with poor performance, independent of family relations. On the other hand, it might be the case that poor performing family management want to leave its position as it is in the best interest of the firm. The management will more likely be willing to leave managerial positions voluntarily when a large portion of the manager’s wealth is invested in the family firm.
The effect of firm size on family management varies between the different types of family management. The tendency is that firm size has a positive effect on the choice of family CEO, but a negative effect on the choice of family chair or both. This further substantiates indications that the choice of family chair and both are similar. The relationship between firm size and family CEO was not significant in the last three yearly regressions, indicating that firm size is no longer an important determinant of family CEO. Nevertheless, the regressions show that larger firms are more likely to choose a family CEO, while smaller firms prefer family chair or both. This is opposite of our initial predictions, and shows that there is possibly an agency argument for the choice of CEO and a skill argument for the choice of chair. Thus, the results indicate that families likely regard being CEO of a large company as prestigious, and being CEO of a small company as an easier task. It might also be the case that it is more important for a
Page 16 of 38 2000 2001 2002 2003 2004 2005 2006 2007 2008 2009 Intercept -1,874*** -1,261 -0,966* -0,882* -1,157** 0,016 -0,981* 0,792 0,530 0,518 0,407 0,404 0,416 0,395 0,386 0,441 0,421 0,452 0,454 0,445 ROA 0,398 0,187 0,454 -0,001 0,334 -0,118 0,488* 1,042*** 1,042*** 0,982*** 0,240 0,237 0,244 0,226 0,219 0,246 0,229 0,252 0,249 0,269 Firm size 0,123*** 0,088*** 0,076*** 0,063** 0,081*** 0,025 0,083*** -0,010 -0,005 -0,010 0,021 0,021 0,022 0,021 0,020 0,023 0,022 0,024 0,023 0,024 Firm age -0,008* -0,007* -0,011** -0,014*** -0,010*** -0,012*** -0,012*** -0,006 -0,008** -0,007* 0,003 0,003 0,004 0,003 0,003 0,003 0,003 0,003 0,003 0,003
Family ownership stake -0,507** -0,375* -0,588** 0,200 -0,415* -0,015 -0,428* 0,387* 0,380* 0,354
0,177 0,183 0,189 0,180 0,172 0,195 0,183 0,194 0,194 0,198
Fraction of family board members 3,780*** 3,984*** 4,157*** 3,123*** 4,297*** 2,992*** 3,779*** 2,294*** 2,392*** 2,579***
0,152 0,159 0,169 0,158 0,156 0,169 0,159 0,168 0,169 0,173 Industry risk -0,133 -0,212* -0,211 -0,193 -0,190 -0,206 -0,252* -0,360*** -0,255* -0,249** 0,107 0,108 0,110 0,106 0,102 0,112 0,108 0,109 0,110 0,094 Intercept -1,993*** -1,787*** -1,394** -0,974* -1,349*** -0,194 -0,321 0,553 0,628 0,722 0,434 0,441 0,445 0,416 0,421 0,465 0,441 0,476 0,477 0,468 ROA 1,099*** 1,048*** 0,996*** 0,214 0,808*** 0,052 0,799*** 1,501*** 1,268*** 1,331*** 0,255 0,258 0,261 0,239 0,242 0,259 0,245 0,270 0,266 0,287 Firm size -0,029 -0,049* -0,067** -0,091*** -0,073*** -0,137*** -0,141*** -0,157*** -0,152*** -0,143*** 0,023 0,023 0,024 0,022 0,022 0,024 0,023 0,025 0,025 0,025 Firm age -0,013*** -0,014*** -0,018*** -0,016*** -0,012*** -0,013*** -0,011*** -0,006 -0,010** -0,012*** 0,003 0,004 0,004 0,003 0,003 0,003 0,003 0,003 0,003 0,003
Family ownership stake -1,166*** -1,254*** -1,447*** -0,809*** -1,543*** -0,991*** -1,355*** -1,146*** -1,367*** -1,318***
0,198 0,207 0,210 0,196 0,197 0,214 0,203 0,213 0,214 0,219
Fraction of family board members 9,038*** 9,586*** 9,648*** 8,831*** 9,812*** 8,723*** 9,478*** 8,199*** 8,345*** 8,461***
0,177 0,188 0,196 0,179 0,184 0,192 0,185 0,189 0,190 0,195 Industry risk 0,044 0,061 0,115 0,039 0,115 0,107 0,082 -0,053 -0,018 -0,186 0,113 0,116 0,117 0,111 0,111 0,117 0,113 0,114 0,115 0,100 Intercept -1,370*** -1,203** -0,996* -0,987* -1,045** -0,184 -1,060* 0,223 -0,197 -0,470 0,414 0,423 0,428 0,402 0,403 0,449 0,428 0,459 0,461 0,453 ROA 1,313*** 1,290*** 1,239*** 0,725** 1,250*** 0,677** 1,403*** 1,868*** 1,764*** 1,877*** 0,244 0,249 0,252 0,232 0,232 0,251 0,237 0,260 0,257 0,278 Firm size -0,051* -0,074*** -0,093*** -0,098*** -0,104*** -0,142*** -0,097*** -0,164*** -0,145*** -0,127*** 0,022 0,022 0,023 0,021 0,021 0,024 0,022 0,024 0,024 0,025 Firm age -0,002 -0,004 -0,008* -0,008** -0,008** -0,011*** -0,010** -0,008* -0,011*** -0,012*** 0,003 0,004 0,004 0,003 0,003 0,003 0,003 0,003 0,003 0,003
Family ownership stake -0,697*** -0,792*** -0,800*** -0,069 -0,658*** -0,023 -0,416* 0,448* 0,440* 0,358
0,185 0,196 0,199 0,186 0,186 0,202 0,192 0,201 0,202 0,206
Fraction of family board members 10,628*** 11,223*** 11,272*** 10,333*** 11,530*** 10,212*** 10,909*** 9,661*** 9,801*** 9,967***
0,173 0,184 0,192 0,175 0,179 0,187 0,181 0,183 0,184 0,189
Industry risk -0,297** -0,262* -0,178 -0,217* -0,170 -0,201 -0,214 -0,353*** -0,291** -0,293**
0,109 0,113 0,113 0,107 0,107 0,113 0,109 0,110 0,112 0,096
N 36 743 36 008 36 166 41 996 42 342 40 220 41 337 44 055 45 431 43 339
Cox and Snell 0,342 0,356 0,335 0,307 0,351 0,292 0,320 0,293 0,290 0,290
Nagelkerke 0,423 0,440 0,418 0,382 0,440 0,374 0,401 0,380 0,378 0,377
McFadden 0,253 0,265 0,252 0,225 0,270 0,227 0,241 0,236 0,234 0,233
Family has both
Pseudo R-Square
Table 5: Multinomial logistic regression, base case model
Multinomial logistic regression with family management as the dependent variable. The independent variables are firm performance measured by three years of average return on assets, firm size measured by the natural logarithm of sales, firm age, family ownership stake, fraction of family board members, and industry risk measured by the coefficient of variation. Significance levels of 5%, 1% and 0*1% are indicated by *, ** and *** respectively. Standard errors are stated in parentheses. Pseudo R-squares are reported at the bottom. The reference category is family has neither CEO nor chair.
Family only has CEO
Family only has Chair
Page 17 of 38 family to obtain control through the CEO position in order to avoid the first agency problem (A1).
Firm age has the same effect on all three categories of family management, with odds ratios approximately around 0.9. Thus, there is a negative effect of firm age on family management, and as anticipated this indicates that younger family firms are more likely to be managed by family members. We believe that one of the main reasons is that founders are often present in younger firms and they are more likely to take an active role in the firm.
Surprisingly, the choice of family CEO is mostly negatively related to family ownership stake with coefficients ranging between -0.588 and -0.375, corresponding to odds ratios between 0.555 and 0.687. However, the coefficients turn positive in 2007 (0.387), corresponding to an odds ratio of 1.473. The trend is repeated when it comes to the choice of having both. This indicates that in the early 2000s family firms with lower ownership stake was more likely to choose a family CEO or both, while this has turned opposite in recent years. For the choice of family chair, the coefficients are negative and significant for the whole time period, demonstrating that family firms with high
ownership stake do not choose only family chair. This shows that in firms with high family ownership stake the family retains control through the position as the CEO, while the position as the chairman differs. On the one hand this indicates that the second agency problem (A2) in this particular situation is reduced seeing that the family does not exploit minority owners through taking control of the board. On the other hand the results might be due to the low number of owners in family firms, as approximately 35% of all family firms are single-owner firms (Bøhren 2011). In firms with equity of NOKM 3 or higher, the single-owner can either be the CEO or the chairman of the board, but can only hold one position at a time (Lov om Aksjeselskaper 1997). The large negative coefficient for the choice of family chair indicates for these firms it is more likely that the owner holds the position as the CEO rather the than the chairman position. However, this logic will not hold for all companies seeing that 54% of all companies in the CCGR database have the same person being the CEO and chairman of the board Berzins, Bøhren and Rydland (2008)6. This means that a great fraction of the population’s family
6 The database includes all companies in Norway, and the fraction of family firms having the same person being the CEO and the chairman of the board will therefore differ.
Page 18 of 38 firms will fall within this category. Whether our reasoning will be compromised will be dealt with in the robustness testing.
Furthermore, a high fraction of family members on the board has an immense positive effect on family management. The strongest effect is on the choice of family chair or both. The coefficient is the highest of all the independent variables, suggesting that it is one of the most important determinants of family management. The high coefficients indicate that the family uses the board to take control, and that the second agency problem (A2) is somewhat serious in family firms.
Observing industry risk, there is a negative relationship with the choice of family CEO and both. The coefficients are varying in the degree of significance, indicating that industry risk has been a more important determinant the last four years. A possible explanation is that when the risk of operating the firm is high the need for a
“professional” CEO is higher as high performance is harder to achieve in complex industries. The choice of family chair seems not to be affected by industry risk, which contradicts the initial observations in the descriptive statistics.
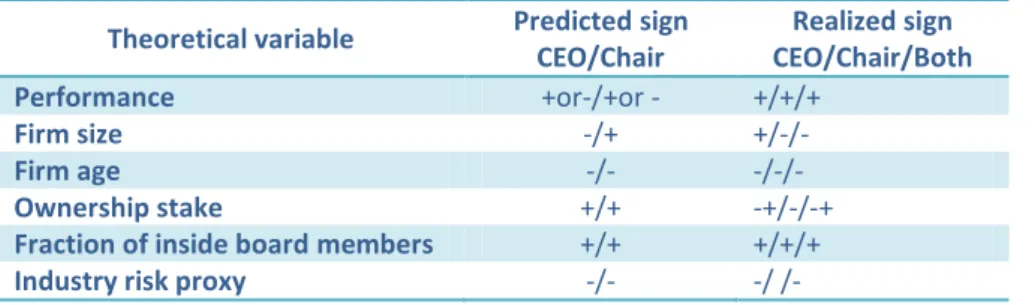
Table 6 summarizes the results discussed above as well as outlines our initial
hypotheses. Plus and minus indicate positive and negative coefficients respectively, and no sign indicates insignificant coefficients.
Table 6: Variables with prediction and realized sign Theoretical variable Predicted sign
CEO/Chair Realized sign CEO/Chair/Both Performance +or-/+or - +/+/+ Firm size -/+ +/-/- Firm age -/- -/-/- Ownership stake +/+ -+/-/-+
Fraction of inside board members +/+ +/+/+
Industry risk proxy -/- -/ /-
Pseudo R-squares are reported in table 5, giving an indication of the goodness of fit of the model. Multinomial logistic regressions do not have an equivalent to the R-squared of the regular OLS-regression, meaning that the reported statistics should be interpreted with great caution. The little dispersion of the R-squares indicate that the model fits the data equally well during the sample period. A more illustrative measure of the goodness of fit is the likelihood ratio (Costea 2005) that evaluates the importance of each
independent variable included in the regression. Table 7 displays the significance level for the likelihood ratio test for each independent variable. A significance level below
Page 19 of 38 0.05 indicates that the variable in question contribute to the explanation of the choice of family management. The table demonstrates what has already been indicated; that all the variables contribute in explaining family firms’ choice of different types of family management.
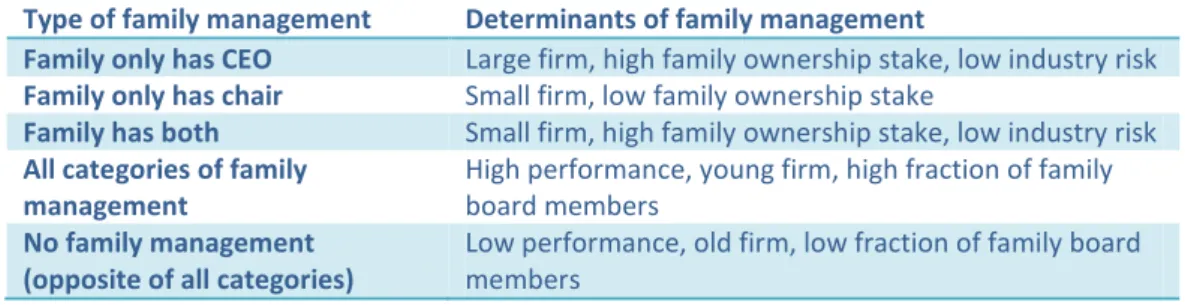
Table 8 summarizes what characterizes the decision of having family management. It displays what separates the choice of different types of family management from each other and what makes these choices related.
Table 8: Current determinants of different types of family management Type of family management Determinants of family management
Family only has CEO Large firm, high family ownership stake, low industry risk
Family only has chair Small firm, low family ownership stake
Family has both Small firm, high family ownership stake, low industry risk
All categories of family management
High performance, young firm, high fraction of family board members
No family management (opposite of all categories)
Low performance, old firm, low fraction of family board members
6.3 Robustness testing
6.3.1 MulticollinearityTo ensure absence of multicollinearity, we examine the standard errors. Standard errors above the value two (2) indicate the presence of multicollinearity in the data (Costea 2005). From table 5 we see that none of the standard errors are even close the threshold, meaning that multicollinearity is of minor concern in this study.
6.3.2 Model specification
Theory mostly concerns whether a family firm either has a family CEO or a family chairman. It does not combine them in order to make a third category of family management, where a family holds both positions at the same time. This makes our study somewhat different, and might cause results to contradict previous research. In addition, seeing that a substantial fraction of the firms in the population have the same
2000 2001 2002 2003 2004 2005 2006 2007 2008 2009
Overall model 0,000 0,000 0,000 0,000 0,000 0,000 0,000 0,000 0,000 0,000 ROA 0,000 0,000 0,000 0,000 0,000 0,000 0,000 0,000 0,000 0,000 Firm size 0,000 0,000 0,000 0,000 0,000 0,000 0,000 0,000 0,000 0,000 Firm age 0,000 0,000 0,000 0,000 0,001 0,001 0,002 0,042 0,004 0,002 Family ownership stake 0,000 0,000 0,000 0,000 0,000 0,000 0,000 0,000 0,000 0,000 Fraction of family board members 0,000 0,000 0,000 0,000 0,000 0,000 0,000 0,000 0,000 0,000 Industry risk 0,000 0,000 0,000 0,000 0,000 0,000 0,000 0,000 0,000 0,002
Table 7: Significance level for likelihood ratio test
The table displays the significance level of the likelihood ratio test for respectively the whole model and each independent variablee. A significance level less than 5% indicates that the independent variable contributes significantly to explain the differences in the choice of family management.
Page 20 of 38 person being the CEO and the chairman, the above results might be further
compromised. However, in order to look at the four choices interrelated we chose to operate with the four mutually exclusive values. To check whether or not the decision was appropriate we have performed additional logistic regressions with various dependent variables. These include:
1. Family management: dummy variable with value of one (1) if the firm has either
family CEO or family chairman, and zero (0) otherwise
2. Family CEO: dummy variable with value of one (1) if the firm has family CEO, and zero (0) otherwise
3. Family chairman: dummy variable with value of one (1) if the firm has family chairman, and zero (0) otherwise
Observing the regression coefficients in table 10 as well as the significance level for each variable, we see that the values marginally change. The results from regression (1) resemble the base case category relating to a family having both family CEO and family chair. The results of regression (2) and (3) resemble the other two base case categories of family management. This indicates that the base case model is valid and that the results are indeed comparable with previous research. However, the Norwegian Company Legislation (Lov om aksjeselskaper 1997) might still affect our results in a way not captured by these additional regressions.
6.3.3 Alternative empirical proxies
To test the robustness of our model it is necessary to explore alternative empirical proxies for the variables employed.
Family firm definition
Additional regressions are performed where the family firm definition is based on super-majority and negative super-majority, defined as family ownership stake above 66.7% and 33.3%, respectively. The results are displayed in table 11-14 in the appendix. Unlike the base case model, we now find a positive relationship between family management and family ownership stake when the definition of a family firm is based on negative majority. However, when defining family firms based on super-majority the coefficients are either negative or insignificant. With higher family ownership stake there are likely fewer owners. This could be the explanation for a stronger, negative relationship between family management and family ownership stake in the case of super-majority.
Page 21 of 38 Conversely, the coefficients turn positive with negative majority as the number of owners is likely to be higher with lower family ownership stake.
Furthermore, when focusing on negative majority, industry risk seems to have a positive relationship with the choice of family chair. This differs from the choice of CEO and both in the base case model. In addition, industry risk does not have the same explanatory power when defining family firms based on super-majority. These results might reflect that industry risk is not an important determinant of family management, seeing that the significance of the variable differs. Accordingly, it seems that most relationships are maintained even after altering the definition of family firms. However, family ownership stake appears to have a varying effect on the choice of family management, hence it might be related to another variable, conceivably the number of owners.
Performance
To test the robustness of the definition of performance we run the base case regression with return on equity (ROE) as the proxy for the firm’s performance. This measure is less likely to correlate with ROA. ROE is defined as:
The tax rate is 28%. As in the base case model we will use average performance of 3 years, i.e. the average of the current year and the two past years. The average performance the last t years is defined as:
From table 15 and 17 in the appendix, we see that the coefficients and the likelihood ratios are similar to the base case model, as are the Pseudo R-squares. However, we observe less significant coefficients for the relationship between firm performance, measured by ROE, and family management. This indicates that performance, measured by ROA, is a more important determinant of family management relative to
performance measured by ROE. This is expected seeing that ROE is a more volatile measure than ROA.
Page 22 of 38
Firm size
To test the robustness of the definition of firm size we run the base case regression with the natural logarithm of assets as the proxy for the size of the firm. This is an approach observed in studies by Bennedsen et al. (2006) and Villalonga and Amit (2006). Table 16 and 18 display the results of the regressions. For the choice of family chair and both, coefficients for firm size are persistently significant and negative as with the base case model. The relation between firm size and choice of CEO is positive in the beginning of the period, but turns negative in the later years. Even though we only observed significant positive coefficients in the base case model, the coefficients for 2007-2009 were insignificant negative, indicating that the results observed in the robustness testing is consistent with the base case model.
In conclusion, alternative empirical proxies have not altered the results of the base case model considerably, indicating that the base case model is robust. Nevertheless, we also control for alternative theoretical variables to further strengthen the robustness of our study.
6.3.4 Alternative theoretical variables
Additional characteristics of family firms with family management that we will control for are elaborated below.
Board size: When the board size increases it is likely harder to appoint family members as CEO or chair. This is due to the fact that it is harder to keep a large fraction of family members on the board (Smith and Amoako-Adu 1999). Therefore we expect board size to correlate negatively with all categories of family management.
Location of the firm: The location might affect family management in terms of
whether the firm is located in the central or in the more rural parts of Norway. We will measure this by defining whether or not the firm is located in a large city7. The location of a firm is an indicator of the job market, as a firm that operates in a large city has a job market with several professional candidates to
7 Large city is defined as the five largest cities of Norway; Oslo, Kristiansand, Bergen, Trondheim and Stavanger (Statistics Norway 2011). In addition, the district of Akershus is added (The Government 2003).
Page 23 of 38 choose from, while in smaller cities it might be difficult to find a professional CEO. Hence, we expect that firms located in more rural parts of Norway are likely to choose both family CEO and family chairman.
Number of owners: We will use the number of owners to see whether more
dispersed ownership affects the choice of family management. Based on the results from the base case model we expect to see a negative relation to family CEO and a positive relation to family chair.
Level of dividends: Villalonga and Amit (2006) found that the level of dividends in family firms is lower than in non-family firms. Based on this, we believe that the level of dividends is lower with all categories of family management. Predictions are given in table 9 in the appendix. From the results in table 19 and 20 in the appendix, we observe some differences between the base case model and the extended model. As for the initial variables, firm size is now negatively related to family CEO, and family ownership stake has a persistently positive relation to family CEO. This is consistent with the last yearly regressions and the robustness testing. As for the control variables, dividend level does not have an apparent effect on the choice of family management. Board size is positively related to family CEO, while negatively related to family chair and both. This is the same relationship observed with firm size in the base case model, and could therefore be caused by a connection between board size and firm size. Furthermore, it seems that firms located in larger cities are more likely to choose a family chair than firms in more rural parts. Firstly, this indicates that the job market only have an effect on the choice of chair. Secondly, the positive relationship between family chair and larger cities might reflect that family firms have an agency argument for having a family chairman, in terms of remain in control of the firm. Lastly, the number of owners seems to be positively related to the choice of family CEO and negatively related to the choice of family chair. This invalidates the reason why we observe a negative relationship between family chair and family ownership stake is due to the frequency of single-owner firms. This is further substantiated by running a regression in a data set excluding single-owner family firms. Table 21 and 22 in the appendix show that the regression coefficients only marginally change, leading to the conclusion that the patterns found is not driven by single-owner firms as earlier suggested. Thus, the most possible explanation is that families do not exercise control when appointing the chairman of the board; a family with high ownership stake uses its control only to obtain control over the CEO position or both positions at the same time.
Page 24 of 38 In conclusion, we see that although we observe discrepancies throughout the
robustness testing, the coefficients, significance levels of the likelihood ratios, and the R-squares are analogous. This suggests that our results remain valid. Nevertheless,
additional regressions indicate that board size, and to a certain degree firm location and the number of owners, might be important determinants of family management.
7. Conclusion
This paper has investigated what determines the choice of family management in Norwegian family firms. We find that some determinants of family management are the same for all categories of family management, while others make the choice of family management differ. The choice of family CEO is more likely in large firms, with high family ownership stake and low industry risk, whereas the choice of chair is more likely in small firms with low family ownership stake. The choice of having family members in both positions is more likely in small firms with high family ownership stake and low industry risk. This shows that the combination of characteristics determines what type of family management family firms choose. We also find that family management overall is more likely in young family firms with high performance and with a high fraction of family members on the board. This shows how the choices differ, but also how they are related. Conversely, family firms are more likely to replace a family member in the management subsequent to low performance, if the firm is older or if there is a low fraction of family members on the board.
Large, positive coefficients associated with the fraction of family board members indicate that families use control to secure the two most important positions within the firms, and signify the presence of the second agency problem (A2). This is in contrast to the negative relation between family ownership stake and family chair in the base case model, which we hypothesize to be due to little existence of A2. Thus, we conclude that the second agency problem is not prevalent in family firms due to high family ownership stake, but is clearly present when there is a high fraction of family board members. The overall results indicate that the determinants have changed the last ten years. This might be due to the economic climate during the time period, characterized by the dot-com bubble and the credit crunch. However, it might also be a result of a changing view on how to effectively run family businesses. An emerging negative relationship between industry risk and family management indicates that families alter the business to take
Page 25 of 38 into account higher risk of operating. This is substantiated by an emerging positive relationship between family ownership stake, and the choice of family CEO and both. This can be attributed to families needing and wanting a higher family ownership stake before taking control over the management positions, relative to the early 2000s. Nevertheless, as elaborated above, it seems that a high fraction of family board
members reduce the effect of this seemingly positive trend. These two opposing forces are the most interesting finding throughout the paper, and demonstrate what can be changing governance mechanisms.
The base case model seems robust over time when employing alternative empirical proxies and alternative theoretical variables. However, when controlling for additional variables, we find that there are supplementing determinants of family management, with board size as the most evident.
Our results are relevant in order to understand what drives the appointment of family management in family firms. Through this paper one should get a better understanding of how different types of family management are related and also how they differ. We show that there are specific reasons for why family firms choose differently, and that the choices are not random. Consequently, family management should affect firms’ profitability. Further research could therefore be focused on turning the equation to see how family management affects among others growth, performance and value creation. Additionally, to get an even more comprehensive understanding of the behavior of family firms, we suggest that further research should focus on case studies to confirm the hypotheses suggested based on the observations throughout this study. What will be an important area of interest is a study of how the Norwegian Company Legislation (Lov om aksjeselskaper 1997) affects the governance of family firms, seeing that family firms have different requirements whether they have equity above or below NOKM 3.
8. Limitations
One limitation of our study is that there might be relevant variables that are not included in our analyses. As studying characteristics of family firms with family
management is very comprehensive, the possibility of overlooking variables is present. However, as we have included six independent variables in our base case, and an additional four in our robustness testing, we believe that the most important determinants of family management are included.
Page 26 of 38 Secondly, by running yearly regressions we observe some year-to-year differences. The most critical inconsistency is the effect of family ownership stake on the choice of family management, seeing that ownership structure is one of the most important factors within corporate governance. This makes it harder to generalize our findings because there might be other reasons, such as economic fluctuations or spurious relationships creating these differences. However, the discrepancies might also be caused by an altering view on how to effectively manage a family business. Thus, this is and should be a prime focus in the near future.
Finally, the endogeniety problem of our study is a never-ending issue in corporate governance. Even after letting performance be the independent variable and using the average 3-year ROA, we cannot with absolute certainty know whether the problem is mitigated. Despite of these limitations, we can definitely say that the choice of family management within family firms is not random, and we believe to have identified the most considerable determinants.
Page 27 of 38
9. References
Anderson, Ronald C. David M. Reeb. 2003. Founding-family ownership and firm performance: Evidence from the S&P500. Journal of Finance: 59: 1301-1328
Barth, Erling. Trygve Gulbrandsen, Pål Schøne. 2005. Family ownership and productivity:
the role of owner-management. Journal of Corporate Finance. 11: 107-127
Bennedsen, Morten, Kasper Meisner Nielsen, Fransisco Perez-Gonzales, Daniel
Wolfenzon. 2006. Inside the Family firm: The role of families in succession decisions and
performance. The Quarterly Journal of Economic, 647-691
Berzins, Janis, Øyvind Bøhren, and Pål Rydland. 2008. Corporate finance and governance in firms with limited liability: Basic characteristics. Oslo: Centre for Corporate
Governance Research
Bhaumik, Sumon and Andros Gregoriou. 2009. Family ownership, tunneling and earnings management: a review of the literature. Michigan: William Davidson Institute
Black, Ken. 2010. Business Statistics for Contemporary Decision Making. 6th edition. New Jersey: John Wiley and Sons
Bodie, Zvi, Alex Kane and Alan J. Marcus. 2009. Investments. 8th edition. New York: McGraw Hill/Irwin
Borooah, Vani K. 2002. Logit and Probit: ordered and multinomial models, Issue 138.
California: SAGE Publications
Bøhren, Øyvind. 2011. Eierne, styret og ledelsen: Corporate governance i Norge. Bergen: Fagbokforlaget
Costea, Adrian. "Computational Intelligence Methods for Quantitative Data Mining."
Institute for Advanced Management Systems Research at Åbo Akademi University. 2005.
http://iamsr.abo.fi/publications/?publication_id=441 (accessed 20.05.2011)
Cucculelli and Micucci. 2008. Family in Succession and firm performance: evidence from Italian family firm. Journal of Corporate Finance 14: 17–31
The Government. Storbymeldingen.
http://www.regjeringen.no/nb/dep/krd/dok/regpubl/stmeld/20022003/stmeld-nr-31-2002-2003-/10.html?id=403087 (accessed 20.04.2011)
Page 28 of 38 Hillier, David, Patrick McColgan. 2009. Firm performance and managerial succession in
family managed firms. Journal of Business and Accounting 36(3): 461-484
Lov om aksjeselskaper. § 6-1 (2) (13.06.1997)
Maury, Benjamin. 2006. Family ownership and firm performance: Empirical evidence
from Western European Corporations. Journal of Corporate Finance 12: 321-341
Ministry of Finance. The corporate tax system and taxation of capital income.
http://www.regjeringen.no/nb/dep/fin/tema/Norsk_okonomi/topics/The-corporate-tax-system-and-taxation-of-capital-income.html?id=418058 (Accessed 20.04.2011) Robinson, Thomas R. Hennie van Greuning, Elaine Henry, Michael A. Broihahn, Sir David Tweedie. 2009. International Financial Statement Analysis. John Wiley and Sons
Smith, Brian F. Ben Amoako-Adu. 1999. Management succession and financial performance of family controlled firms. Journal of Corporate Finance 5: 341 – 368
Statistics Norway. 24.02.2011.
http://www.ssb.no/folkendrkv/arkiv/tab-2011-02-24-02.html (accessed 24.04.2011)
Svalland, Bjørn Morten and Lasse Cornelius Vangstein. Family firms and diversification.
2009. Thesis Report. Oslo: BI Norwegian School of Management
Villalonga and Amit. 2006. How do family ownership, control and management affect
firm value? Journal of Financial Economics 80: 385–417