1
OECD TAX DATABASE
EXPLANATORY ANNEX
PART III.
SOCIAL SECURITY CONTRIBUTIONS
2 Table of contents
PART III, TABLE 1 EMPLOYEE SOCIAL SECURITY CONTRIBUTION
RATES
4
III.1. AUSTRIA 4
III.1. BELGIUM 4
III.1. CANADA 8
III.1. CHILE 10
III.1. CZECH REPUBLIC 11
III.1. GERMANY 11 III.1. GREECE 11 III.1. ISRAEL 12 III.1. LUXEMBOURG 14 III.1. MEXICO 14 III.1 NETHERLANDS 14 III.1. POLAND 16
III.1. SLOVAK REPUBLIC 17
III.1. SLOVENIA 18
III.1. SPAIN 19
III.1. SWEDEN 20
III.1. UNITED KINGDOM 20
PART III, TABLE 2 EMPLOYER SOCIAL SECURITY CONTRIBUTION
RATES
21
III.2. AUSTRIA 22
III.2. BELGIUM 22
III.2. CANADA 25
III.2. CHILE 26
III.2. CZECH REPUBLIC 26
III.2. GREECE 26 III.2. IRELAND 26 III.2. ISRAEL 27 III.2. LUXEMBOURG 27 III.2. MEXICO 28 III.2. NETHERLANDS 28 III.2. NORWAY 31 III.2. POLAND 31
III.2. SLOVAK REPUBLIC 31
III.2. SLOVENIA 32
III.2. SPAIN 33
III.2. SWEDEN 33
III.2. UNITED KINGDOM 33
III.2 UNITED STATES 34
PART III, TABLE 3 SELF-EMPLOYED SOCIAL SECURITY
CONTRIBUTION RATES
35
III.3. AUSTRIA 35
3
III.3. CANADA 35
III.3. CHILE 36
III.3. CZECH REPUBLIC 36
III.3. GERMANY 36 III.3. GREECE 37 III.3. IRELAND 38 III.3. ISRAEL 38 III.3. ITALY 39 III.3. KOREA 40 III.3. MEXICO 41 III.3. NETHERLANDS 42 III.3. NORWAY 43 III.3. POLAND 43 III.3. PORTUGAL 44
III.3. SLOVAK REPUBLIC 44
III.3. SLOVENIA 44
III.3. SPAIN 46
III.3. SWEDEN 47
III.3 SWITZERLAND 47
III.3. TURKEY 48
4 PART III, TABLE 1 EMPLOYEE SOCIAL SECURITY CONTRIBUTION RATES
III.1. AUSTRIA
The SSC rates are for workers, and they are lower for other employees. They also include Contributions for the promotion of residential buildings (Payroll tax in Revenue Statistics) and for the Chamber of Labour (Tax on Income in Revenue Statistics), which are levied by health security institutions on the same base (but only on 12 current pays) as SSC.
The lower threshold is not a contribution-free amount which is deducted from the base, but an amount below which the employee can choose to be insured by social security, in which case pension and health SSC (no unemployment insurance) amounts to 57,30 € in 2015 (2014: 55.79€ all amounts for a worker) per month would have to be paid. For employees above the threshold, the whole gross income (up to the upper threshold) is taken as base for SSC.
III.1. BELGIUM
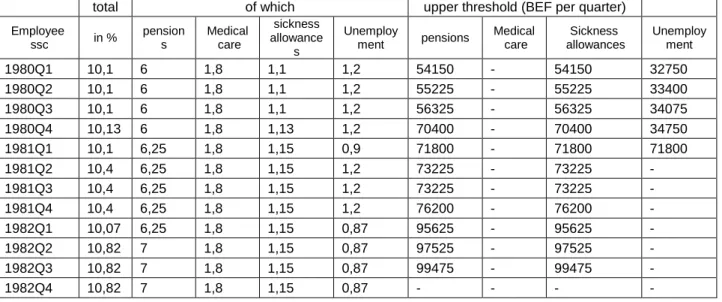
The rate of the personal social security contribution listed in table III.1 is the sum of different items. Up to the third quarter of 1982 there were upper thresholds for some items. These thresholds were abolished starting from October 1982.
total of which upper threshold (BEF per quarter)
Employee ssc in % pension s Medical care sickness allowance s Unemploy ment pensions Medical care Sickness allowances Unemploy ment 1980Q1 10,1 6 1,8 1,1 1,2 54150 - 54150 32750 1980Q2 10,1 6 1,8 1,1 1,2 55225 - 55225 33400 1980Q3 10,1 6 1,8 1,1 1,2 56325 - 56325 34075 1980Q4 10,13 6 1,8 1,13 1,2 70400 - 70400 34750 1981Q1 10,1 6,25 1,8 1,15 0,9 71800 - 71800 71800 1981Q2 10,4 6,25 1,8 1,15 1,2 73225 - 73225 - 1981Q3 10,4 6,25 1,8 1,15 1,2 73225 - 73225 - 1981Q4 10,4 6,25 1,8 1,15 1,2 76200 - 76200 - 1982Q1 10,07 6,25 1,8 1,15 0,87 95625 - 95625 - 1982Q2 10,82 7 1,8 1,15 0,87 97525 - 97525 - 1982Q3 10,82 7 1,8 1,15 0,87 99475 - 99475 - 1982Q4 10,82 7 1,8 1,15 0,87 - - - -
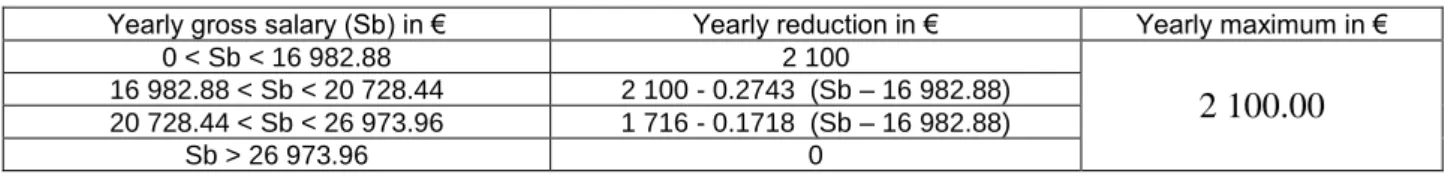
Since 1.1.2000, a reduction in personal social security contributions is granted for low salaries. This “work bonus” is granted monthly in accordance with the level of the salary.
Table of the reduction in personal social security contributions for an employee, in €, from 1.01.2014)
5
0 < Sb < 18 021.84 2 207.64
2 207.64
18 021.84 < Sb < 28 624.92 2 207.64 - 0.1981 (Sb – 18 021.84)
Sb > 28 624.92 0
Table of the reduction in personal social security contributions for an employee, in €, from 1.04.2013)
Yearly gross salary (Sb) in € Yearly reduction in € Yearly maximum in €
0 < Sb < 18 021.84 2 208.00
2 208.00
18 021.84 < Sb < 28 624.92 2 208.00 - 0.1981 (Sb – 18 021.84)
Sb > 28 624.92 0
Table of the reduction in personal social security contributions for an employee, in €, from 1.01.2013)
Yearly gross salary (Sb) in € Yearly reduction in € Yearly maximum in €
0 < Sb < 18 021.84 2 100
2 100.00
18 021.84 < Sb < 28 624.92 2 100 - 0.1981 (Sb – 18 021.84)
Sb > 28 624.92 0
Table of the reduction in personal social security contributions for an employee, in €, from 1.12.2012)
Yearly gross salary (Sb) in € Yearly reduction in € Yearly maximum in €
0 < Sb < 18 021.84 2 100
2 100.00
18 021.84 < Sb < 21 996.60 2 100 - 0.2584 (Sb – 18 021.84)
21 996.60 < Sb < 28 624.92 1 716 - 0.1618 (Sb – 18 021.84)
Sb > 28 624.92 0
Table of the reduction in personal social security contributions for an employee, in €, from 1.02.2012)
Yearly gross salary (Sb) in € Yearly reduction in € Yearly maximum in €
0 < Sb < 17 668.80 2 100
2 100.00
17 668.80 < Sb < 21 565.56 2 100 - 0.2636 (Sb – 17 668.80)
21 565.56 < Sb < 28 062.96 1 716 - 0.1651 (Sb – 17 668.80)
Sb > 28 062.96 0
Table of the reduction in personal social security contributions for an employee, in €, from 1.05.2011)
Yearly gross salary (Sb) in € Yearly reduction in € Yearly maximum in €
0 < Sb < 17 322.48 2 100
2 100.00
17 322.48 < Sb < 21 142.80 2 100 - 0.2743 (Sb – 17 322.48)
21 142.80 < Sb < 27 511.92 1 716 - 0.1718 (Sb – 17 322.48)
Sb > 27 511.92 0
Table of the reduction in personal social security contributions for an employee, in €, from 1.09.2010)
Yearly gross salary (Sb) in € Yearly reduction in € Yearly maximum in €
0 < Sb < 16 982.88 2 100
2 100.00
16 982.88 < Sb < 20 728.44 2 100 - 0.2743 (Sb – 16 982.88)
20 728.44 < Sb < 26 973.96 1 716 - 0.1718 (Sb – 16 982.88)
6
Table of the reduction in personal social security contributions for an employee, in €, from 1.10.2008)
Yearly gross salary (Sb) in € Yearly reduction in € Yearly maximum in €
0 < Sb < 16 649.88 2 100
2 100.00
16 649.88 < Sb < 20 322.00 2 100 - 0.2798 (Sb – 16 649.88)
20 322.00 < Sb < 26 444.64 1 716 - 0.1752 (Sb – 16 649.88)
Sb > 26 444.64 0
Table of the reduction in personal social security contributions for an employee, in €, from 1.9.2008)
Yearly gross salary (Sb) in € Yearly reduction in € Yearly maximum in €
0 < Sb < 16 349.88 1 716
1 812.00
16 349.88 < Sb < 26 444.64 1 716 - 0.1700 (Sb – 16 349.88)
Sb > 26 444.64 0
Table of the reduction in personal social security contributions for an employee, in €, from 1.5.2008)
Yearly gross salary (Sb) in € Yearly reduction in € Yearly maximum in €
0 < Sb < 16 029.36 1 716
1 716.00
16 029.36 < Sb < 25 926.12 1 716 – 0.1734 (Sb – 16 029.36)
Sb > 25 926.12 0
Table of the reduction in personal social security contributions for an employee, in €, from 1.1.2008)
Yearly gross salary (Sb) in € Yearly reduction in € Yearly maximum in €
0 < Sb < 15 715.08 1 716
1 716.00
15 715.08 < Sb < 25 418.52 1 716 - 0.1768 (Sb – 15 715.08)
Sb > 25 418.52 0
Table of the reduction in personal social security contributions for an employee, in €, from 1.4.2007)
Yearly gross salary (Sb) in € Yearly reduction in € Yearly maximum in €
0 < Sb < 15 406.92 1 716
1 707.00
15 406.92 < Sb < 24 919.56 1 716 - 0.1804 (Sb – 15 406.92)Sb > 24 919.56 0
Table of the reduction in personal social security contributions for an employee, in €, from 1.10.2006)
Yearly gross salary (Sb) in € Yearly reduction in € Yearly maximum in €
0 < Sb < 15 106.56 1 680
1 680.00
15 106.56 < Sb < 24 919.56 1 680 - 0.1712 (Sb – 15 106.56)
Sb > 24 919.56 0
Table of the reduction in personal social security contributions for an employee, in €, from 1.1.2006)
Yearly gross salary (Sb) in € Yearly reduction in € Yearly maximum in €
0 < Sb < 14 810.76 1 680
1 680.00
14 810.76 < Sb < 24 431.52 1 680 - 0.1746 (Sb – 14 810.76)
7
Table of the reduction in personal social security contributions for an employee, in €, from 1.8.2005)
Yearly gross salary (Sb) in € Yearly reduction in € Yearly maximum in €
0 < Sb < 14 810.76 1 500
1 440.00
14 810.76 < Sb < 20 441.04 1 500 - 0.2664 (Sb – 14 810.76)
Sb > 20 441.04 0
Table of the reduction in personal social security contributions for an employee, in €, from 1.4.2005)
Yearly gross salary (Sb) in € Yearly reduction in € Yearly maximum in €
0 < Sb < 14 520.12 1 500
1 440.00
14 520.12 < Sb < 20 040.00 1 500 - 0.2717 (Sb – 14 520.12)
Sb > 20 040.00 0
Table of the reduction in personal social security contributions for an employee, in €, on 1.1.2005)
Yearly gross salary (Sb) in € Yearly reduction in € Yearly maximum in €
0 < Sb < 14 328.36 1 260 1 440.00
14 328.36 < Sb < 20 040.00 1 260 - 0.2206 (Sb – 14 328.36)
Sb > 20 040.00 0
Table of the reduction in personal social security contributions for an employee, in €, on 1.10.2004)
Yearly gross salary (Sb) in € Yearly reduction in € Yearly maximum in €
0 < Sb < 14 615.64 1 140 1 140.00
14 615.64 < Sb < 18 841.92 1 140 - 0.2697 (Sb – 14 615.64)
Sb > 18 841.92 0
Table of the reduction in personal social security contributions for an employee, in €, on 1.1.2004)
Yearly gross salary (Sb) in € Yearly reduction in € Yearly maximum in €
0 < Sb < 14 328.36 1 140 1 140.00
14 328.36 < Sb < 18 471.60 1 140 - 0.2751 (Sb – 14 328.36)
Sb > 18 471.60 0
Table of the reduction in personal social security contributions for an employee, in €, on 1.6.2003)
Yearly gross salary (Sb) in € Yearly reduction in € Yearly maximum in €
0 < Sb < 10 947.48 0 1 140.00
10 947.48 < Sb < 14 328.36 1 140
14 328.36 < Sb < 18 471.60 1 140 - 0.2751 (Sb – 14 328.36)
Sb > 18 471.60 0
Table of the reduction in personal social security contributions for an employee, in €, on 1.1.2003)
Yearly gross salary (Sb) in € Yearly reduction in € Yearly maximum in €
0 < Sb < 10 733.04 0 1 140.00
10 733.04 < Sb < 14 047.68 1 140
14 047.68 < Sb < 18 110.04 1 140 - 0.2806 (Sb – 14 047.68)
8
Table of the reduction in personal social security contributions for an employee, in €, on 1.2.2002)
Yearly gross salary (Sb) in € Yearly reduction in € Yearly maximum in €
0 < Sb < 10 733.04 0 981.66
10 733.04 < Sb < 14 047.68 981.60
14 047.68 < Sb < 16 731.00 981.60 - 0.3658 (Sb – 14 047.68)
Sb > 16 731.00 0
Table of the reduction in personal social security contributions for an employee, in €, on 1.6.2001)
Yearly gross salary (Sb) in € Yearly reduction in € Yearly maximum in €
0 < Sb < 10 522.80 0 981.66
10 582.80 < Sb < 13 772.40 981.60
13 772.40 < Sb < 16 402.92 981.60 - 0.3732 (Sb – 13 772.40)
Sb > 16 402.92 0
Table of the reduction in personal social security contributions, in €, on 1.9.2000)
Yearly gross salary (Sba) in € Reduction in € Yearly maximum in €
0 < Sba < 10 316.28 0 929.60
10 316.28 < Sba < 13 502.28 981.60
13 502.28 <Sba < 16 081.32 981.60 - 0.3806 (Sba - 13 502.28)
Sba > 16 081.32 0
Table of the reduction in personal social security contributions, in €, on 1.7.2000)
Yearly gross salary (Sba) in € Reduction in € Yearly maximum in €
0 < Sba < 10 106.88 0 929.60
10 106.88 < Sba < 13 237.56 981.60
13 237.56 <Sba < 15 766.08 981.60 - 0.3882 (Sba - 13 237.56)
Sba > 15 766.08 0
Table of the reduction in personal social security contributions, in €, on 1.4.2000)
Yearly gross salary (Sba) in € Reduction in € Yearly maximum in €
0 < Sba < 10 106.88 0 929.60
10 106.88 < Sba < 13 237.56 981.60
13 237.56 <Sba < 15 766.08 981.60 - 0.39 (Sba - 13 237.56)
Sba > 15 766.08 0
Table of the reduction in personal social security contributions, in €, on 1.1.2000)
Yearly gross salary (Sba) Reduction Yearly maximum in €
0 < Sba < 10 106.88 0 929.60
10 106.88 < Sba < 12 642.60 773.40
12 642.60 <Sba < 14 576.16 773.40 - 0.4 (Sba – 12 642.60)
Sba > 14 576.16 0
III.1. CANADA
Employment Insurance (EI) provides temporary financial help to unemployed Canadians while they look for work or upgrade their skills, while they are pregnant or caring for a new-born or adopted child, or while they are sick or providing care to a family member who is gravely ill. Active re-employment benefits and support measures are delivered in co-operation with the provinces and territories. For 2015, employee
9 Employment Insurance contributions are 1.88 per cent of annual earnings up to $49 500. Starting in 2006, Quebec administers its own maternity and parental insurance program (QPIP), and the EI premiums are adjusted accordingly for that province.
The Canada Pension Plan (CPP) is a compulsory earnings-based national plan that provides retirement pensions – as well as survivor, disability and death benefits. The Plan is financed by contributions and investment returns on accumulated assets. Benefit levels are linked to earnings on which contributions are made. CPP revenues, assets and expenditures are not included in the accounts of the government of Canada. The province of Quebec administers and operates a parallel program, the Quebec Pension Plan (QPP). Starting in 2012, employee Quebec Pension Plan contributions are no longer harmonized with employee Canada Pension Plan contributions. For the year 2015, employee Canada Pension Plan and Quebec Pension Plan contributions are respectively 4.95 per cent and 5.25 per cent of annual earnings between $3 500 and $53 600.
The following table presents the historical rates and thresholds:
Year
Employment Insurance (EI) Canada Pension Plan (CPP)/ Quebec Pension Plan (QPP) Rate (%) Maximum Insurable Earnings ($) CPP Rate (%) QPP Rate (%) Earnings ($ Y) 2015 1.88 49 500 4.95 5.25 3 500 < Y < 53 600 2014 1.88 48 600 4.95 5.175 3 500 < Y < 52 500 2013 1.88 47 400 4.95 5.10 3 500 < Y < 51 100 2012 1.83 45 900 4.95 5.025 3 500 < Y < 50 100 2011 1.78 44 200 4.95 3 500 < Y < 48 300 2010 1.73 43 200 4.95 3 500 < Y < 47 200 2009 1.73 42 300 4.95 3 500 < Y < 46 300 2008 1.73 41 100 4.95 3 500 < Y < 44 900 2007 1.80 40 000 4.95 3 500 < Y < 43 700 2006 1.87 39 000 4.95 3 500 < Y < 42 100 2005 1.95 39 000 4.95 3 500 < Y < 41 100 2004 1.98 39 000 4.95 3 500 < Y < 40 500 2003 2.10 39 000 4.95 3 500 < Y < 39 900 2002 2.20 39 000 4.70 3 500 < Y < 39 100 2001 2.25 39 000 4.30 3 500 < Y < 38 300 2000 2.40 39 000 3.90 3 500 < Y < 37 600
Employees receive a non-refundable income tax credit for contributions made to EI and C/QPP. The federal credit was 15 per cent of contributions in 2014, 2013, 2012, 2011, 2010, 2009, 2008 and 2007;
15.25 per cent of contributions in 2006; 15 per cent of contributions in 2005;
16 per cent of contributions in 2004, 2003, 2002 and 2001; and 17 per cent of the contributions in 2000.
10 The federal credit rate for 2015 is 15 per cent. The provinces and territories also provide non-refundable income tax credits at rates that are generally equivalent to their lowest personal income tax rate. III.1. CHILE
a. Employee social security contributions classified as taxes
In addition to the general contributions for health care, the following social contributions paid by minority groups in Chile are classified as taxes on the basis of the OECD Interpretive Guide
Legacy contributions to public pension funds
Contributions for health and pensions paid by the police Contributions for health and pensions paid by the army
The upper limit thresholds in Chile are expressed in UF (Unidad de Fomento) which is a unit of account adjustable daily in line with the CPI. The upper limit threshold in each payment period represents 60 UF.
b. Employee social security contributions classified as non-tax compulsory payments
There are also a number of categories of contributions to private funds that are not classified as taxes. Chile has had a private pension system since January 1980 and a dual health system (both public and private health insurance) since 1981.
Chilean employees pay the following mandatory contributions to private funds.
10% of gross earnings to finance retirement, disability and survivorship pensions. The payments are deposited in individual capitalization accounts managed by Pension Fund Administrators. An additional contribution, fixed by each Administrator, to finance the operations of the fund. A small group of employees who perform heavy work also pay a contribution equivalent to 1%
or 2% of their gross earnings into their individual capitalization account. The National Ergonomic Commission is in charge of rating a task as heavy work.
7% of gross earning to contributions to private funds for health care.
From October 2002, employees pay 0.6% to the unemployed insurance, when the worker has an "indefinite term employment contracts”. Employees with "fixed-term employment contracts" do not have to contribute.
The five mentioned contributions are subject to an upper threshold limit, which is adjusted yearly : Unemployment insurance Rest of the contributions
2009 and previous years 90 UF 60 UF
11 2011 99 UF 66 UF 2012 101.1 UF 67.4 UF 2013 105.4 UF 70.3 UF 2014 108.5 UF 72.3 UF 2015 109.8 UF 73.2 UF
All the above contributions are deducted from taxable incomes.
It is also possible to make additional voluntary contributions for pensions and health care. These are also deductible from taxable income except where the employee pays more than 5.124 UF for healthcare, or more than 50 UF per month or 600 UF per year for voluntary pension fund savings.
III.1. CZECH REPUBLIC
The rates of social security contributions for employees are: pension insurance contributions sickness insurance contributions contributions to state employment policy health insurance contributions Total employee 6.5 % 0 % 0 % 4.5 % 11 %
From 1 January 2013, social contribution rates vary depending on whether the taxpayer has opted for the new voluntary pension saving scheme. For employees who did not opt for the voluntary pension saving scheme the total rate of social and health insurance is 11.0 % (consists of 6.5 % contributions to pension insurance and 4.5 % of compulsory health insurance). For employees who opted for the voluntary pension saving scheme, the total rate of social and health insurance is 13.0 % (statutory pension insurance of 3.5 %, voluntary pension saving of 5 % and compulsory health insurance of 4.5 %).%). A separate ceiling set at four times the average annual salary, CZK 1 277 328 (EUR 46 500) in 2015, applies to social contributions. Starting from 2013, the ceiling on health insurance contributions (six times the average annual salary) is abolished.
III.1. GERMANY
Part of the employee contributions is deductible (see description in country chapter of ‘Taxing Wages’).
III.1. GREECE
The great majority of individuals who are employed in the private sector and render dependent personal services are principally, directly and compulsorily insured in the Social Insurance Organisation (IKA). Apart from the main contribution, IKA compulsorily collects contributions for other minor Funds created for the employee’s benefit (Unemployment Benefits Funds, etc.). A subsidiary Social Insurance Fund (ETEAM) for employees who are principally insured in IKA has been also established since 1983.
12 As regards the medical care, the National Organization for Healthcare Provision (EOPPY) was set up in 2011 with the Law 3918/11 art.17, absorbing the most important social security funds (IKA-ETAM, OGA, OAEE, OPAD) providing medical care for employees, self-employed, civil servants etc.
The average rates of contributions payable by white-collar employees as a percentage of gross earnings are as follows (%) (Since 1-1-03):
Employer Employee Total
1. Social Insurance Organisation (IKA) 18.43 9.22 27.65
2. Subsidiary Social Insurance Fund (ETEAM) 3.00 3.00 6.00
3. Other Funds 7.13 4.28 11.41
Total 28.56 16.50 4.56
For blue-collar workers engaged in heavy work (unhealthy, dangerous etc.), higher contributions are due (19.45% paid by the employee and 30.21% paid by the employer), so that such individuals become entitled to pension five years earlier than when the normal age limit applies. In the industrial sector, a contribution at a rate of 1 per cent is added as an occupational risk contribution which is paid by the employer, since the workers because of their difficult employment conditions are vulnerable to an increased risk of labour accidents and occupational diseases. So the effective total rate of a mixed insurance premium is 50.66% (employer’s contribution 31.21% and employee’s contribution 19.45%).
Contributions are calculated as percentages on the basis of monthly salary or wages paid but within the limits specified in the National General Collective Employment Agreement. Monthly gross remuneration includes salaries and wages, fringe benefits and bonuses and any profit distributions to employees. A ceiling of €2,432.25 per month applies for individuals who have started working prior to 1-1-1993 (this cap is valid for the year 2012 and refers to the maximum amount of monthly wage for which contributions are paid). On the other hand, for individuals who have started working after 1-1-1993, the respective ceiling is €5,546.80 (for 2012).
The contributions are fully deductible for income tax purposes.
Note: The cap for the ‘old-insured’ in the monthly wage for which contributions are paid is calculated every year as follows: 25 x the highest day’s wage of the highest insurance class as provided for by the Law (art.37 of Law 1846/1951) i.e. 25 x 97.29 = 2,432.25. The cap for the ‘newly insured’ in the monthly wage for which contributions are paid is calculated every year as follows: 8 x average GDP per capita of 1991 adjusted for the State rate of increase in pensions of public servants i.e. 8 x 693.35 = 5546.80.
III.1.ISRAEL
Social security contributions paid by employees are made up of a combination of those for National Insurance and Health Insurance.
1. General background National insurance
Every resident of Israel aged 18 and over is obligated by law to be insured by National Insurance and to pay the national insurance contributions. The National Insurance branches are made up of the following list; old age and survivors, long term care, general disability, accident and injury, work injury, maternity, children, unemployment and bankruptcy.
13 Health insurance
In addition, every resident is registered in one of the country’s health maintenance organisations (HMO), and must pay contributions for health insurance. The contributions are collected by the National Insurance Institute which distributes the moneys collected to the HMOs. The rates of contribution are calculated according to the work status and the level of the person’s income (earned plus unearned). A person who does not work and has no income (besides social benefits) pays a minimum amount depending on status (unless she is a married housewife who is totally exempt).
Exemptions
There are exemptions from certain types of National Insurance contribution for some workers. For example, career soldiers are exempt from maternity insurance and foreign workers are exempt from national insurance contributions except for Work injury, Maternity and Bankruptcy.
2. Historical tax rates and thresholds
A reduced rate applies up to a lower threshold of 50% the average wage per employee post (raised to 60% of the average wage per employee post in January 2006). The regular rate applies up to an upper threshold of around 5 times the average wage per employee post. The upper threshold was removed between July 2002 and June 2003. In July 2003 the upper threshold was re-instated at a level of 5 times the average wage per employee post. In August 2009 it was increased to 10 times the average wage per employee post, then, in January 2011, decreased to 9 times the average wage per employee post. In January 2012 the upper threshold was re-instated at a level of 5 times the average wage per employee post.
The following table shows the historical tax rates and thresholds:
Period Reduced rate Lower threshold Regular rate Upper threshold
Jan2000-Dec2000 5.76 3,174 9.7 31,735 Jan2001-Dec2001 5.76 3,482 9.7 34,820 Jan2002-Mar2002 5.76 3,525 9.7 35,250 Apr2002-Jun2002 5.76 3,482 9.7 34,820 Jul2002-Dec2002 5.76 3,482 9.7 No limit Jan2003-Jun2003 4.5 3,482 10.32 No limit Jul2003-Dec2005 4.5 3,482 10.38 34,820 Jan2006-Dec2006 3.5 4,430 12 35,760 Jan2007-Dec2007 3.5 4,522 12 35,760 Jan2008-Dec2008 3.5 4,598 12 36,760 Jan2009-Jul2009 3.5 4,757 12 38,415 Aug2009-Dec2009 3.5 4,757 12 76,830 Jan2010-Dec2010 3.5 4,809 12 79,750 Jan2011-Dec2011 3.5 4,984 12 73,422 Jan 2012-Dec2012 3.5 5,171 12 41,850 Jan2013-Dec2013 3.5 5,297 12 42,435
14 The 2013 full and reduced rates for employee contributions and their breakdown into those applying to the Health insurance and the National Insurance branches are set out below. These figures have applied since the beginning of 2006.
Branch Full rate contribution ( % ) Reduced rate contribution ( % )
Insurance branches 7.00 0.40
Health 5.00 3.10
Total contributions 12.00 3.50
III.1. LUXEMBOURG
Since 2009, the SSC rates are equal for workers and employees. III.1. MEXICO
Social security contributions paid by the employee are divided as follows:
1. For sickness and maternity insurance, 0.625 per cent of the employee’s monthly earnings, plus 0.40 per cent (1.68% in 2000; 1.52% in 2001; 1.36% in 2002; 1.20% in 2003; 1.04% in 2004; 0.88% in 2005, 0.72% in 2006, 0.56% in 2007 and 0.40% as of January 1, 2008)1 of his monthly earnings in excess of three times the monthly minimal wage in Mexico City ($70.10 pesos per day in 2015). These rates are applied over different bases; therefore, they cannot be added into a single rate.
2. For disability, and life insurance, 0.625 per cent of the employee’s monthly earnings.
Employee’s monthly earnings include wages and fringe benefits such as food vouchers and housing benefits. For reporting purposes, the sickness and maternity insurance rates and the disability and life insurance rate were applied separately to the monthly wage, since a different ceiling to the salary base applies to these two contributions. Contributions to private retirement funds (AFORES) are not included in social security contributions. (See comment on Table I.1-I.4)
Social security contributions paid by the employee are capped at $854 MXN in 2014 ($729 in 2000; $740 in 2001; $736 in 2002; $724 in 2003; $710 in 2004; $694 in 2005, $679 in 2006, $661 in 2007, $ 641 in 2008, $668 in 2009, $700 in 2010, $729 in 2011, $759 in 2012, $789 in 2013 and $820 in 2014) pesos per month for individuals earning an amount equivalent to 25 monthly minimum wages of the Mexico City ($70.10 pesos per day in 2015) or more.
III.1 NETHERLANDS
The social security contribution paid by employees consists of several parts: 1. Public insurance for medical care (social health plan).
Public insurance for medical care has been reformed in 2006. A new standard health insurance system is introduced. Until 2005, no public health insurance contributions were levied on income in excess of EUR 33 000. However, taxpayers earning more than EUR 33 000 were obliged to take a private insurance. This was not included in the TW model. These private health insurance contributions were not included in the Taxing Wages calculations. In 2006, all individuals above the age of 18 years are obliged to insure
15 themselves at a private insurance company and will be no part of the TW model. On average individuals pay a nominal premium to a private insurance company for the basic health insurance of (on average EUR 1,174 in year 2015) and in addition employers pay a percentage (6.95 per cent) of gross income net of employees’ pension premiums and unemployment social security contribution until a maximum of EUR 51,976. From 2013 onwards this system has changed. Before, employees had to pay the contribution, and received a mandatory compensation of his employer for the same amount. This amount was included in the taxpayer’s taxable income and is part of the TW model. As stated above, from 2013 this is considered to be an employer’s contribution. This contribution of employers remains part of the non-tax compulsory payments (NTCP) and is used for equalizing health insurance risks between insurance companies.
In the health insurance system competition is allowed between health insurance companies. Competition takes place under strict conditions of the government to avoid risk selection by the health insurance companies. The new standard private health system is quite similar to the old system before 2006 but it is now implemented by the private sector for all individuals and it allows more competition in the health care market. The health insurance contributions are now included in the calculations of the NTCP in the special feature of the Taxing Wages publication of 2009, but not in the standard publication of the Taxing Wages model.
Taxpayers including self-employed might obtain compensation for the private nominal contribution of EUR 1,174, depending on the taxpayer’s personal situation and gross income. This is called the care benefit. The care benefit is calculated as follows for 2015:
household of one adult : 1408 (med_adult for care benefit) – 2.395 per cent (med_compensation 1) * 19,463 (med_key) – 13.400 per cent (med_compensation 2) * (taxable income – 19,463 (med_key)).
household of more than one adult: number of adults * 1408 (med_adult for care benefit) – 5.265 per cent (med_compensation 3) * 19,463 (med_key) – 13.400 per cent (med_compensation 4) * (taxable income – 19,463 (med_key)).
2. Unemployment scheme
Employees pay a percentage of earnings between a threshold and a ceiling: From 2009 and onwards, 0.0 percent
In 2008, 3.5 per cent of gross earnings between EUR 15 921 and EUR 46 205 In 2007, 3.85 per cent of gross earnings between EUR 15 660 and EUR 45 017 In 2006, 5.2 per cent of gross earnings between EUR 15 138 and EUR 43 848 In 2005, 5.85 per cent of earnings between EUR 15 080 and EUR 43 587. In 2004, 5.8 per cent of earnings between EUR 15 196 and EUR 43 578. In 2003, 5.8 per cent of earnings between EUR 14 877 and EUR 43 065. In 2002, 4.95 per cent of earnings between EUR 14 486 and EUR 41 499.
16 In 2001, 5.25 per cent of earnings between NLG 30 537 and NLG 87 957.
In 2000, 6.25 per cent of earnings between NLG 28 971 and NLG 83 259,3.
3 General scheme (Old age pensions, widows and orphans pensions, exceptional medical expenses and disability)
The following premiums are levied from taxable income up to a ceiling (percentages 2013)
Insurance percentage
general old age pension 17.9%
pension for widows and orphans 0.6%
exceptional health care 9.65%
Total 28.15%
Total for taxpayers of 65 years and older 10.25%
The ceiling of taxable income for these premiums is EUR 33,589 (2015). It is adapted partly to inflation(75% of correction factor since tax plan 2011) every year.
The tax credits also apply to contributions to general social security schemes. In 2014 the general tax credit is made income dependent and still is in 2015.
Taxpayers, older than 65 years and three month do not pay premiums for general old age pension in 2015. The age for old age pensions is increased..
III.1. POLAND
Social security contributions are paid monthly by employee (but calculated, collected and transfered to Social Security Institution (Zakład Ubezpieczeń Społecznych – ZUS) by employers) and can be divided into two groups:
social insurance contributions – 13.71% of revenue as defined in Act on personal income tax (which is approximately the same as gross wage), in which:
old-age pension insurance contribution - 9.76 %
disability pension insurance contribution - 1.5 % % (from year 2008), 3,5 % (July 2007 – December 2007), 6,5 % (1999- June 2007),
sickness insurance contribution - 2.45 %,
health insurance contribution – base of its assessment is base of assessment for social insurance contribution minus employee’s contributions – rate was increased of 0.25% each year from 7.75 in year 2001 to 9% in 2007. This rate is still at present.
Employee’s social insurance contributions are fully deductible from taxable income, while health insurance contribution is deductible from tax but only at rate 7.75%.
17 If the insured person is a member of the open pension fund (OPF), a part of the contribution to his or her old-age pension insurance is transferred by ZUS to OPF selected by the insured person. Since May 2011 the part of the contribution being transferred to OPF has been reduced from the rate 7,3 % to 2,3 % of the basis of assessment.
, and in 2013 it has increased to 2,8%. The difference between 7,3% and 2,3/2,8% has been located on the subaccount in ZUS. Since 1st of February 2014 2,92% is transferred to OPF and 4,38% is transferred to subaccount in ZUS. Furthermore, people can choose if their new contributions would be transferred to OPF or the whole contribution (7,3%) would be transferred to subaccount. If someone’s age is close to the retirement age by 10 or less years the whole contribution (7,3%) is transferred to subaccount in ZUS and their savings in OPF are gradually transferred to subaccount in ZUS .
The ceiling to contributions (old-age, disability) and pensionable earning is set at 2.5 times average earnings projected for a given year in the state budget law. It is 118 770 PLN in 2015.
III.1. SLOVAK REPUBLIC
There is both a minimum (only for full-time employees) and a maximum contribution, defined by the minimum base (the value given in the column for the lower threshold in the table) and the upper threshold. For 2000-2003, these amounts were fixed values.
The upper thresholds for 2005 onwards are a function of the average wage, while the minimum base is equal to the minimum wage (see the table below). For 2004, the same system applied, but the 4% health contribution had a fixed minimum amount of 3,000 and upper threshold of 32,000. In 2008 there was a change of multiple (from 3 to 4) for calculation of upper threshold for social insurance (see the table). From 2011 onwards the change in upper thresholds were made (there is no change of upper thresholds during the year as from 2011, see the table below). As from 2013 maximum assessment bases for social and health security contributions has been increased and unified to 5 times the average wage (two years prior to when contribution is paid).
2005 - 2010
Rate Minimum base
(lower threshold) Upper threshold 1.1-30.6
Upper threshold 1.7-31.12 Social Insurance 8% Minimum monthly wage
4 times the average wage two years prior to when the contribution is paid
4 times the average wage in the year prior to when the contribution is paid Sickness
Insurance 1.4%
Minimum monthly wage
1.5 times the average wage two years prior to when the contribution is paid
1.5 times the average wage in the year prior to when the contribution is paid
Health Insurance 4%
Minimum
monthly wage 3 times the average wage two years prior to when the contribution is paid
2011 - 2012
Rate Minimum base
(lower threshold) Upper threshold 1.1-31.12
Social Insurance 8%
Minimum
monthly wage 4 times the average wage two years prior to when the contribution is paid
Sickness Insurance 1.4%
Minimum
monthly wage 1.5 times the average wage two years prior to when the contribution is paid
Health Insurance
Minimum
18
4%
From 2013
Rate Minimum base
(lower threshold) Upper threshold 1.1-31.12
All social insurance (9,4%) and health insurance (4%) Minimum
monthly wage 5 times the average wage two years prior to when the contribution is paid
The latest amendment of the Minimum wage act (663/2007) adjusted date of the minimum wage indexation, which changed from October 1st to January 1st. After this amendment the effectiveness of the minimum wage is identical with calendar year as from 2009. From 1st January 2015the minimum monthly wage is set at EUR 380.00.
Statutory minimum monthly wage
Period The amount (in SKK) The amount (in Euro)
1.10.2006 - 30.9.2007 7 600 252.3* 1.10.2007 - 31.12.2008 8 100 268.9* 1.1.2009 – 31.12.2009 8 900 295.5 1.1.2010 – 31.12.2010 - 307.7 1.1.2011 – 31.12.2011 - 317.0 1.1.2012 – 31.12.2012 - 327.2 1.1.2013 – 31.12.2013 - 337.7 1.1.2014 – 31.12.2014 - 352.0 1.1.2015 – 31.12.2015 - 380.0
*calculated by conversion rate ( 1Eur = 30.126 SKK)
Compulsory contributions for 2004 onwards of 13.4 per cent of gross wages and salaries (with no limit) are paid by all employees into government operated schemes. The total is made up as follows:
Health Insurance 4.0 per cent
Social Insurance 9.4 per cent
of which:
Sickness 1.4 per cent
Retirement 4.0 per cent
Disability 3.0 percent
Unemployment 1.0 per cent
As of 1st January 2015 a new health insurance contribution allowance has been introduced simultaneously with the increase of the minimum wage. The amount of allowance is EUR 380. The allowance decreases with rising income (with 1 euro increase in income the allowance decreases by 2 euro). The allowance is applicable only on standard employment income.
III.1. SLOVENIA
The compulsory social security insurance system consists of four schemes as follows:
19 pension and disability insurance;
health insurance;
unemployment insurance; maternity leave insurance.
The taxable base for social security insurance contributions paid by employees is the total amount of the gross wage or salary including vacation payments, fringe benefits and remuneration of expenses related to work above a certain threshold. The assessment period is the calendar month. Employees contribute an amount as a percentage of their remuneration as follows.
Scheme name Rate of contribution ( % ) Pension insurance 15.50 Health insurance 6.36 Unemployment insurance 0.14 Maternity leave 0.10 Total 22.10 III.1. SPAIN
Social Security contributions are a fixed proportion of covered earnings between a floor and a ceiling, which vary by broadly defined professional categories. Currently, eleven categories are distinguished. For the first seven of them, floor and ceilings apply to monthly earnings. These floors and ceilings are shown below for the year 2015. They are approximately equal to, respectively, the professional minimum wage and three times the professional minimum wage. For the last four categories, floors and ceilings apply to daily earnings
Professional Category Minimum base Maximum base
Engineers and university graduates 1,056.90 €/month 3,606.00 €/month
Qualified technicians and assistants 876.60 €/month 3,606.00 €/month
Clerical and Workshop supervisors 762.60 €/month 3,606.00 €/month
Non-qualified assistants 756.60 €/month 3,606.00 €/month
Clerical Officers and Assistants 756.60 €/month 3,606.00 €/month
Subordinates 756.60 €/month 3,606.00 €/month
Administrative Assistants 756.60 €/month 3,606.00 €/month
Workshop Officers 25.22 €/day 120.20 €/day
Sub officers and Skilled workers 25.22 €/day 120.20 €/day
Labourers 25.22 €/day 120.20 €/day
Workers lower than 18 years old 25.22 €/day 120.20 €/day
Social Security contributions made by taxpayers are addressed to cover the following contingencies: Common contingencies: illness, non-labour accidents, retirement, maternity leave, etc.
Work injuries and professional diseases Overtime work
Other contributions made for purposes such as: Unemployment
20 Fund of Wage Guarantee
Professional Training
Social security contributions are calculated on the total monthly pay received by the employee, excluding per diem allowances and travel expenses, distance and transport supplements, petty cash allowances, work clothes and uniforms, death indemnities, relocation expenses and other minor items. As stated before, there is a minimum floor and a maximum ceiling or base for the first seven professional categories of employees (from engineers to administrative assistants; for the other four categories the minimum and maximum bases are computed on a daily basis). Social security bases are fixed every year by the General Budget Law. The tax rate is the percentage applied to the tax base. Tax rates are fixed every year by the General Budget Law.
For 2015 the rates applied for employers are the following:
Employers
General Benefits Fund 23.60%
Unemployment (general rate)
Unemployment (fixed duration – full time) Unemployment (fixed time – part time)
5.50% 6.70% 6.70%
Wage Guarantee Fund 0.20%
Professional Training 0.6%
III.1. SWEDEN
The social security contribution paid by employees is based on the sum of earnings and taxable transfers.
III.1. UNITED KINGDOM
An employee aged 16 or over but below state pension age must pay primary Class 1 contributions unless earnings for the pay period for each employment are below the primary threshold (PT) in which case the payment is not made. Employees pay Class 1 contributions equal to 12 per cent of earnings above the PT (£155 per week in 2015-16) up to the upper earnings limit (UEL: £815 pw in 2015-16). Employees also pay contributions at 2 per cent above the UEL.
There is a contracted out rebate of 1.4 per cent of earnings between the lower earnings limit (LEL, £112pw in 2015-16) and the upper accruals point (UAP) (£770 pw fixed from 2008-09 onwards)) for those in contracted-out salary related schemes. No contributions are actually payable on earnings between LEL and PT but notional contributions are treated as having been paid to protect benefit entitlement.
For appropriate personal pensions, the employer pays contributions at the standard not contracted-out rate and an age and earnings related rebate is paid directly to the personal pension provider at the end of the tax year.
From 1981-82 the structure for employees’ contributions was as follows:
Year Lower limit of
earnings (£)
Upper limit of earnings (£)
Not contracted-out rate payable on all
earnings (%) Contracted-out rate payable on all earnings (%) 1981-82 27.00 200 7.75 5.25 1982-83 29.50 220 8.75 6.25 1983-84 32.50 235 9.00 6.85 1984-85 34.00 250 9.00 6.85
21 The structure changed mid-way through the year in 1985 so rates between October 1985 and April 1986 are not given in table III.1. They were as follows:
Weekly income (£) Employee’s contribution rate payable on all earnings (%)
0-35.50 0
35.50-55 5.00
55-90 7.00
90-265 9.00
The structure remained unchanged until October 1989 when it changed again mid-way through the year. The rates that were applied between October 1989 and April 1990 are not given in table III.1 so are given below.
Weekly income (£) Employee’s contribution rate (%)
0-43 0
43-325 2% on first £43; 9% on balance
With the abolition of the 2 per cent entry fee on employee’s earnings below the lower earnings limit in April 1999 the structure changed to that below:
Weekly income (£) Employee’s contribution rate (%)
0-66 0
66-500 10.00
From April 2003, a 1 per cent rate above the UEL was introduced, and the rate between the PT and UEL was increased from 10 to 11 per cent.
Weekly income (£) Employee’s contribution rate (%)
0- (PT) 0
(PT) - (UEL) 11.00
> (UEL) 1.00
From April 2011, the following structure was applied, raising the rates between the PT and UEL and above the UEL by 1 per cent. This has remained unchanged to date.
Weekly income (£) Employee’s contribution rate (%)
0- (PT) 0
(PT) - (UEL) 12.00
22 PART III, TABLE 2 EMPLOYER SOCIAL SECURITY CONTRIBUTION RATES
III.2. AUSTRIA
The SSC rates are for workers, and they are lower for other employees. They also include Contributions for the promotion of residential buildings (Payroll tax in ‘Revenue Statistics’), which are levied by health security institutions on the same base (but only on 12 current pays) as SSC.
There is no lower threshold for accident insurance. Indeed, even for employees below the threshold, the employer may have to pay accident SSC. If the wage sum is above 150 per cent of the lower threshold, the employer has to pay health and pension contributions also for those employees below the lower threshold.
III.2. BELGIUM
The rate of the employer social security contribution listed in table III.2 is the sum of different items. Up to the third quarter of 1982 there were upper thresholds for some items. These thresholds were abolished starting from October 1982. On top of the marginal rate applicable to the gross salary, there was a lump sum to be paid from the third quarter of 1980 till the last of 1983.
employer ssc
Marginal
rate of which upper threshold (BEF per quarter)
lump sum in % pensi ons sickness allowances Unemplo yment Educat ional leave pensions sickness allowanc es Unemplo yment Educat ional leave firm closures 1980Q1 24,15 8 1,8 1,7 0,05 54150 54150 32750 32750 0 1980Q2 24,15 8 1,8 1,7 0,05 55225 55225 33400 33400 0 1980Q3 24,15 8 1,8 1,7 0,05 56325 56325 34075 34075 0 1980Q4 24,18 8 1,83 1,7 0,05 57450 70400 34750 34750 2215 1981Q1 24,12 8,86 1,84 1,27 0,05 71800 71800 71800 71800 2215 1981Q2 24,1 8,86 1,84 1,27 0,03 73225 73225 73225 73225 2215 1981Q3 24,1 8,86 1,84 1,27 0,03 73225 73225 73225 73225 2215 1981Q4 24,1 8,86 1,84 1,27 0,03 76200 76200 76200 76200 2215 1982Q1 24,07 8,86 2,1 1,23 0,03 95625 95625 95625 95625 2436 1982Q2 24,07 8,86 2,2 1,23 0,03 97525 97525 97525 97525 2436 1982Q3 24,09 8,86 2,2 1,23 0,05 99475 99475 99475 99475 2436 1982Q4 24,09 2436 1983Q1 24,07 2680 1983Q2 24,12 2680 1983Q3 24,07 2680
23
1983Q4 24,07 2680
From 1982 till 1999 some “Maribel”- reductions were granted, but not in all sectors of economic activity. Since 1999 these reductions were replaced by general “structural” reductions of employer social security contributions. The amount varies in relation to the gross salary following the tables below.
As from 01.01.2014
Yearly gross salary (S) in € Yearly reduction in €
0 < S < 22 241.96 1 850.40 + 0.1620 (22 241.96 – S)
22 241.96 < S < 53 439.20 1 850.40
S >53 604.28 1 850.40 + 0.06 (S – 53 604.28)
As from 01.04.2013
Yearly gross salary (S) in € Yearly reduction in €
0 < S < 22 303.72 1 810 + 0.1620 (22 303.72 – S)
22 303.72 < S < 53 439.20 1 810
S >53 4399.20 1 810 + 0.06 (S – 53 439.20)
As from 01.01.2013
Yearly gross salary (S) in € Yearly reduction in €
0 < S < 23 600 1 600 + 0.1620 (23 600 – S)
23 600 < S < 49 939.20 1 600
S > 49 939.20 1 600 + 0.06 (S – 49 939.20)
As from 01.04.2012
Yearly gross salary (S) in € Yearly reduction in €
0 < S < 23 482.84 1 600 + 0.1620 (23 482.84 – S)
23 482.84 < S < 48 960 1 600
S > 48 960 1 600 + 0.06 (S – 48 960)
As from 01.01.2012
Yearly gross salary (S) in € Yearly reduction in €
0 < S < 23 482.84 1 600 + 0.1620 (23 482.84 – S)
23 482.84 < S < 48 000 1 600
S > 48 000 1 600 + 0.06 (S – 48 000)
As from 01.01.2010
Yearly gross salary (S) in € Yearly reduction in €
0 < S < 24 120.00 1 600 + 0.1620 (24 120.00 – S)
24 120.00 < S < 48 000 1 600
24
As from 01.04.2007
Yearly gross salary (S) in € Yearly reduction in €
0 < S < 23 482.84 1 600 + 0.1620 (23 482.84 – S)
23 482.84 < S < 48 000 1 600
S > 48 000 1 600 + 0.06 (S – 48 000)
As from 01.01.2005
Yearly gross salary (S) in € Yearly reduction in €
0 < S < 23 482.84 1 600 + 0.1444 (23 482.84 – S)
23 482.84 < S < 48 000 1 600
S > 48 000 1 600 + 0.06 (S – 48 000)
As of 01.01.2004
Yearly gross salary (S) in € Yearly reduction in €
0 < S < 21 240 1 600 + 0.1750 (21 240 – S)
21 240 < S < 48 000 1 600
S > 48 000 1 600 + 0.0173 (S – 48 000)
As of 01.04.2003
Yearly gross salary (S) in € Yearly reduction in €
0 < S < 10 260.72 1 390.36
10 260.72 < S < 13 329.24 2 945.56
13 329.24 < S < 18 459.16 2 945.56 - 0.3032 (S – 13 329.24)
S > 18 459.16 1 390.36
As of 1.04.2002
Yearly gross salary (S) in € Yearly reduction in €
0 < S < 10 260.72 1 255.36
10 260.72 < S < 13 329.24 2 945.56
13 329.24 < S < 18 459.16 2 945.56 - 0.3295 (S – 13 329.24)
S > 18 459.16 1 255.36
As of 1.04.2001
Yearly gross salary (S) in € Reduction in €
0 < S < 10 260.72 1 120.36
10 260.72 < S < 13 329.24 2 945.56
13 329.24 < S < 18 459.16 2 945.56 - 0.3558 (S - 13 329.24)
S > 18 459.16 1 120.36
As of 1.04.2000
Yearly gross salary (S) in € Reduction in €
0 < S < 10 260.72 985.32
10 260.72 < S < 13 329.24 2 945.56
25
S > 18 459.16 985.32
As of 1.04.1999
Yearly gross salary (S) in € Reduction in €
0 < S < 10 260.72 264.84 10 260.72 < S < 13 000.04 2 367.60 13 000.04 < S < 15 049.60 2 367.60 - 0.5509 (S – 13 000.04) 15 049.60 < S < 18 459.16 861.96 S > 18 459.16 264.84 III.2. CANADA
Employer Employment Insurance (EI) contributions are 2.632 per cent of each employee’s annual earnings up to $49 500 in 2015. Any firm that pays employer EI premiums equal to or less than $15,000 in 2015 will be eligible for the Small Business Job Credit, which will effectively lower small businesses’ EI premiums from 2.632 to 2.24 per cent of each employee’s annual earnings up to $49 500.
Starting in 2012, employer Quebec Pension Plan contributions are no longer harmonized with employer Canada Pension Plan contributions. In 2015, employer Canada Pension Plan contributions are paid at a rate of 4.95 per cent and employer Quebec Pension Plan contributions are paid at a rate of 5.25 per cent.
The following table presents the historical rates and thresholds:
Year
Employment Insurance (EI) Canada Pension Plan (CPP)/ Quebec Pension Plan (QPP) Rate (%) Maximum Insurable Earnings ($) CPP Rate (%) QPP Rate (%) Earnings ($ Y) 2015 2.632 49 500 4.95 5.25 3 500 < Y < 53 600 2014 2.632 48 600 4.95 5.175 3 500 < Y < 52 500 2013 2.632 47 400 4.95 5.10 3 500 < Y < 51 100 2012 2.562 45 900 4.95 5.025 3 500 < Y < 50 100 2011 2.492 44 200 4.95 3 500 < Y < 48 300 2010 2.422 43 200 4.95 3 500 < Y < 47 200 2009 2.422 42 300 4.95 3 500 < Y < 46 300 2008 2.422 41 100 4.95 3 500 < Y < 44 900 2007 2.520 40 000 4.95 3 500 < Y < 43 700 2006 2.618 39 000 4.95 3 500 < Y < 42 100 2005 2.730 39 000 4.95 3 500 < Y < 41 100 2004 2.772 39 000 4.95 3 500 < Y < 40 500 2003 2.940 39 000 4.95 3 500 < Y < 39 900 2002 3.080 39 000 4.70 3 500 < Y < 39 100 2001 3.150 39 000 4.30 3 500 < Y < 38 300 2000 3.360 39 000 3.90 3 500 < Y < 37 600
26 III.2. CHILE
The main payments of employer social security contributions are not classified as taxes by the Ministry of Finance in Chile. In Chile the upper limit earnings limit thresholds are expressed in UF [ Unidad de Fomento ] which is a unit of account adjustable daily in line with the CPI.( see notes to Table III.1 for further explanation). These payments are as follows:
- Occupational accident and disease insurance; employers make a mandatory payment of 0.95% of the employee’s earnings subject to an upper earnings limit of 73.2 UF. In addition to this basic rate, there are further payments of up to an extra 3.4% in the case of riskier activities. For the majority of workers, these amounts are paid to employers’ associations of labour security which are private non-profit institutions. For the remainder the contributions are paid to the Social Security Regularisation Unit (ISL). Although this latter organisation is controlled by government the funds that are collected are invested on the private market.
- Unemployment insurance; employers contribute 2.4% of an employee’s earnings (3% for fixed-term contracts) subject to an upper earnings limit of 109.8 UF. These funds are managed privately.
A premium to an Insurance Company to cover the worker in the event of disability or death. If the employee performs heavy work, the employer also pays a contribution to !% or 2% of the
worker gross earnings into his individual capitalization account. The National Ergonomic Commission is in charge of rating a task as heavy work.
There are also some legacy pension contributions that are classified as taxes and the occupational accident and disease insurance payments that are paid to the ISL are presented as tax revenues in some Chilean documents.
III.2. CZECH REPUBLIC
The rates of social security contributions for employers are:
pension insurance contributions sickness insurance contributions contributions to state employment policy health insurance contributions Total employer 21.5 % 2.3 % 1.2 % 9 % 34.0 %
A separate ceiling set at four times the average annual salary, CZK 1 277 328 (EUR 46 500) in 2015, applies to social contributions. Starting from 2013, the ceiling on health insurance contributions (six times the average annual salary) is abolished.
III.2. GREECE
See explanatory note to Table III.1. III.2. IRELAND
27 III.2. ISRAEL
The full amount of the employer contributions applies to the various National Insurance branches. Employers do not pay any contributions for health insurance on behalf of their employees.
See the corresponding note for Table III.1 Employee social security contributions for the general background.
Since July 2005 a reduced rate applies up to a lower threshold of 50% the average wage per employee post (raised to 60% of the average wage per employee post in January 2006). The regular rate applied up to an upper threshold of around 4 times the average wage per employee post until June 2002. The upper threshold was removed between July 2002 and June 2003. In July 2003 the upper threshold was re-instated at a level of 5 times the average wage per employee post. In August 2009 it was increased to 10 times the average wage per employee post. In January 2011 it was decreased to 9 times the average wage per employee post and back to 5 times the average wage per employee post in January 2012.
The regular rate increased from 5.93% in 2012 to 6.5% in 2013,6.75% in 2014 and 7.25% in 2015 and will increase to 7.5% in 2016.
The following table shows the historical tax rates and thresholds:
Period Reduced rate Lower threshold Regular rate Upper threshold
Jan2000-Dec2000 4.93 25,388 Jan2001-Dec2001 4.93 27,856 Jan2002-Mar2002 4.93 28,200 Apr2002-Jun2002 4.93 27,856 Jul2002-Dec2002 5.93 No limit Jan2003-Jun2003 5.93 No limit Jul2003-Jun2005 5.93 34,820 Jul2005-Dec2005 5.33 3,482 5.68 34,820 Jan2006-Dec2006 4.98 4,430 5.68 35,760 Jan2007-Dec2007 4.14 4,522 5.68 35,760 Jan2008-Dec2008 3.85 4,598 5.43 36,760 Jan2009-Jul2009 3.45 4,757 5.43 38,415 Aug2009-Dec2009 3.85 4,757 5.43 76,830 Jan2010-Dec2010 3.85 4,809 5.43 79,750 Jan2011-Apr2011 3.85 4,984 5.43 73,422 Apr2011-Dec2011 3.45 4,984 5.90 73,422 Jan2012-Dec2012 3.45 5,171 5.90 41,850 Jan2013-Dec2013 3.45 5,297 6.5 42,435 Jan2014-Dec2014 3.45 5,453 6.75 43,240 Jan2015-Dec2015 3.45 5,556 7.25 43,240 III.2. LUXEMBOURG
28 III.2. MEXICO
Social security contributions paid by the employer are divided as follows:
1. Starting 2008 for sickness and maternity 20.40 per cent2 (15.2% in 2000, 15.85% in 2001, 16.5% in 2002, 17.15% in 2003, 17.80% in 2004, 18.45% in 2005, 19.10% in 2006 and 19.75% in 2007) of the monthly minimum wage in Mexico City per worker ($70.10 pesos per day in 2015), plus 1.10 per cent since 20083 (5.02% in 2000, 4.53% in 2001, 4.04% in 2002, 3.55% in 2003, 3.06% in 2004, 2.57% in 2005, 2.08% in 2006 and 1.59% in 2007) of the employee’s monthly earnings in excess of three times the monthly minimum wage in Mexico City, plus 1.75 per cent of the employee’s monthly earnings.
2. For disability and life insurance, 1.75 per cent of worker’s monthly earnings. 3. For social services and nursery, 1 per cent of worker’s monthly earnings.
4. Work injury contributions are a variable percentage of the worker’s monthly earnings. The amount depends on the risk level in which the company is classified. The weighted average risk premium is 1.98 per cent and it was calculated based on the information of every economic sector included in the AW estimation.
Employee’s monthly earnings include wages and fringe benefits such as food vouchers and housing benefits. For reporting purposes, all rates applied over the employee’s monthly wage (with a single ceiling of 25 minimum wages of Mexico City starting in 2008) were added into a single rate of 6.48 per cent.
Social security contributions paid by the employer are capped at $4,405 MXN in 2015 for employees earning an amount equivalent to 25 monthly minimum wages in Mexico City or more. They were capped at $4,080 in 2000, $4,240 in 2001, $4,322 pesos in 2002, $3,704 in 2003, $3,724 in 2004, $3,349 in 2005, $3,358 in 2006, $3,361 in 2007, $3,329 in 2008 $3,469 in 2009, 3,637 in 2010, $3,787 in 2011, $3,917 in 2012, $4,070 MXN in 2013 and $4,229 in 2014.
III.2. NETHERLANDS
The social security contributions for employers: 1. Unemployment
A percentage of the gross earnings between a threshold and a ceiling for the general unemployment fund.
2,07% between EUR 17,888 and EUR 51,976 in 2015 2,15% between EUR 17,693 and EUR 51,414 in 2014 1,70% between EUR 17,501 and EUR 50,853 in 2013 4.55% between EUR 17,229 and EUR 50,064 in 2012
2 This rate increased 0.65 percentage points on an annual basis. As from 2008, the applicable rate is 20.40 per cent 3 This rate decreased 0.49 percentage points on an annual basis. As from 2008, the applicable rate is 1.1 per cent.
29 4.20% between EUR 16,965 and EUR 49,297 in 2011
4.20% between EUR 16,704 and EUR 48,716 in 2010 4,15 per cent between EUR 16 443 and EUR 47 802 in 2009 4,75 per cent between EUR 15 921 and EUR 46 205 in 2008 4,40 per cent between EUR 15 660 and EUR 45 017 in 2007
3,45 per cent between EUR 15 138 and EUR 43 848 in 2006 2.45 per cent between EUR 15 080 and EUR 43 587 in 2005
1.55 per cent between EUR 15 196 and EUR 43 578 in 2004 1.55 per cent between EUR 14 877 and EUR 43 065 in 2003 3.6 per cent between EUR 14 486 and EUR 41 499 in 2002 3.65 per cent between NLG 30 537 and NLG 87 957 in 2001 - 3.75 per cent between NLG 28 972 and NLG 83 259 in 2000
A percentage of the gross earnings below a ceiling for the industrial insurance associations’ redundancy payments fund.
2,66 per cent of gross earings below EUR 51,976 in 2015 3,18 per cent of gross earnings below EUR 51,414 in 2014 3,26 per cent of gross earnings below EUR 50,853 in 2013 2.77 per cent of gross earnings below EUR 50,064 in 2012 2.24 per cent of gross earnings below EUR 49,297 in 2011 1.82 per cent of gross earnings below EUR 48,716 in 2010 1.41 per cent of gross earnings below EUR 47 802 in 2009 1.36 per cent of gross earnings below EUR 46 205 in 2008 1.27 per cent of gross earnings below EUR 45 017 in 2007 1.48 per cent of gross earnings below EUR 43 848 in 2006 1.75 per cent of gross earnings below EUR 43 587 in 2005 1.89 per cent of gross earnings below EUR 43 578 in 2004
30 1.3 per cent of gross earnings below EUR 43 065 in 2003
0.89 per cent of gross earnings below EUR 41 499 in 2002 0.72 per cent of gross earnings below NLG 87 957 in 2001 1.05 per cent of gross earnings below NLG 83 259 in 2000 2. Invalidity
A percentage of gross earnings below a ceiling. 6,40 per cent below EUR 51,976 in 2015 5,98 per cent below EUR 51,414 in 2014 4.52 per cent below EUR 50,853 in 2013 5.6 per cent below EUR 50,064 in 2012 5.72 per cent below EUR 49,297 in 2011 6.36 per cent below EUR 48,716 in 2010 6.32 per cent below EUR 47 802 in 2009 6.37 per cent below EUR 46 205 in 2008 6.38 per cent below EUR 45 017 in 2007 6.38 per cent below EUR 43 848 in 2006 7.25 per cent below EUR 43 587 in 2005 7.65 per cent below EUR 43 578 in 2004 7.4 per cent below EUR 43 065 in 2003 7.85 per cent below EUR 41 499 in 2002 7.7 per cent below NLG 87 957 in 2001 7.7 per cent below NLG 83 259 in 2000 3. Public insurance for medical care
Public insurance for medical care has been reformed in 2006. A new standard health insurance system is introduced. In 2006, all individuals above the age of 18 years are obliged to insure themselves at a private insurance company. Individuals pay a nominal premium to a private insurance company for the basic health insurance of on average EUR 1,174 (in year 2015) and in addition employers pay a percentage (6.95 per cent in 2015) of gross income net of employees’ pension premiums and unemployment social
31 security contribution until a maximum of EUR 51,976 . This system has changed in 2013. Before, employees had to pay this income dependent contribution and were reimbursed for it by their employers. This reimbursement was added to the taxable income of the employee.
III.2. NORWAY
The rates are regionally differentiated according to five regional zones, with rates ranging from 0 in the northernmost part to 14.1 per cent in the most central areas.
From July 1 2001 until December 31 2006 the employer’s SSC was reduced by 4 percentage points for most employees above 62 years (although not below zero).
III.2. POLAND
The rates of social security contributions for employers are: old-age pension insurance contribution - 9.76 %
disability pension insurance contribution - 6.5 % (from February 2012), 4,5 % (2008-January 2012), 6,5 % (1999-2007),
Work accident insurance contribution (the rate varies across industries) - 0.4 % – 8.12% (rate used for calculation - 1.62%)
contributions to Labour Fund - 2.45 % (from 1999), 3% (years 1993-1998), 2% (years 1990-1992),
Contribution to Benefits Guarantee Fund - 0.1% (from year 2006), 0.15% (years 2003-2005), 0.08% (years 1999-2002), 0.15% (1998), 0.18 (1997), 0.5% (from 1.03.1996 to 12.1996), 0.2% (from 1.03.1995 to 29.02.1996), 0.5% (from 2.04.1994 to 28.02.1995), 1% (from 1.01.1994 to 1.04.1994).
Base of assessment of these contributions is revenue as defined in Act on personal income tax (which is approximately the same as gross wage).
The ceiling to contributions (old-age, disability) and pensionable earning is set at 2.5 times average earnings projected for a given year in the state budget law. It is 117 870 PLN in 2015.
The above described system concerning social insurance (i.e. old-age pension, disability pension and work accident insurance contributions) was introduced in 1999. Previously – the social contributions were paid only by employers, base of assessment of contributions was payroll and rates of contributions were: 45% (years 1990-1998), 38% (years 1987-1989), 33% (from 1.07.1982 to 31.12.1986), 25% (from 1.01.1981 – 30.06.1983).
Contribution to Labour Fund (from1990) and Benefits Guarantee Fund (from1994) were also paid. III.2. SLOVAK REPUBLIC
There is both a minimum (only for full-time employees) and a maximum contribution, defined by the minimum base (the value given in the column for the lower threshold in the table) and the upper threshold. The thresholds are the same as for employee social security contributions. See explanation to Table III.1
32 for further details. The same changes to upper thresholds are valid as for employees as from 2011and 2013 onwards.
For the purposes of this table, the social insurance contribution rate for employers for 2005 onwards is assumed to be 25.2 per cent, in addition to a 10 per cent health insurance contribution. The social insurance rate reflects contributions to sickness insurance (1.4 per cent), disability insurance (3 per cent), retirement insurance (14 per cent), the Guarantee fund (0.25 per cent), and accident insurance (0.8 per cent), for unemployment (1 percent) and to the Reserve fund (4.75 per cent).
From January 2005, Slovakia has introduced the privately managed fully funded pillar. This means that a given proportion (9 percentage points) of social contributions paid by the employer for retirement insurance flows directly to the private pension funds and not to the Social insurance Agency as in previous years. As from September 2012 pension sharing scheme has been changed. Employer’s retirement contribution rate to the fully funded pillar (II .pillar) has been reduced from 9 per cent to 4 per cent (for more see pension contribution sharing table below).
Period
Percentage of gross earnings
I Pillar II Pillar Total
Previous system (up to September 2012) 9% (5% employer + 4% employee contribution)
9% (employer
contribution) 18% Current system (from September 2012)* 14% (10% employer + 4%
employee contribution)
4% (employer
contribution) 18%
* As from 2017 contribution rate to the II. pillar will automatically increase by 0.25 p.p. per year (i.e. contribution rate to the I. pillar will decrease in the same volume)
A new health insurance contribution allowance is also eligible for employers. The condition and amount of the allowance is the same as for employees (see explanation in III.1).
III.2. SLOVENIA
The compulsory social security insurance system consists of four schemes as follows:
pension and disability insurance; health insurance;
unemployment insurance; Maternity leave insurance.
The taxable base for social security insurance contributions paid by employers is the total amount of the gross wage or salary including vacation payments, fringe benefits and remuneration of expenses related to work above a certain threshold. The assessment period is the calendar month. Employers contribute an amount as a percentage of their remuneration as follows.
Scheme name Rate of contribution ( % ) Pension insurance 8.85 Health insurance 7.09 Unemployment insurance 0.06 Maternity leave 0.10 Total 16.10