An Analysis of Data Corruption in the Storage Stack
Lakshmi N. Bairavasundaram
∗, Garth R. Goodson
†, Bianca Schroeder
‡Andrea C. Arpaci-Dusseau
∗, Remzi H. Arpaci-Dusseau
∗∗
University of Wisconsin-Madison
†Network Appliance, Inc.
‡University of Toronto
{
laksh, dusseau, remzi
}
@cs.wisc.edu, [email protected], [email protected]
Abstract
An important threat to reliable storage of data is silent data corruption. In order to develop suitable protection mechanisms against data corruption, it is essential to un-derstand its characteristics. In this paper, we present the first large-scale study of data corruption. We analyze cor-ruption instances recorded in production storage systems containing a total of1.53million disk drives, over a pe-riod of41months. We study three classes of corruption: checksum mismatches, identity discrepancies, and par-ity inconsistencies. We focus on checksum mismatches since they occur the most.
We find more than 400,000 instances of checksum mismatches over the 41-month period. We find many interesting trends among these instances including: (i) nearline disks (and their adapters) develop checksum mismatches an order of magnitude more often than enter-prise class disk drives, (ii) checksum mismatches within the same disk are not independent events and they show high spatial and temporal locality, and (iii) checksum mismatches across different disks in the same storage system are not independent. We use our observations to derive lessons for corruption-proof system design.
1
Introduction
One of the biggest challenges in designing storage sys-tems is providing the reliability and availability that users expect. Once their data is stored, users expect it to be per-sistent forever, and perpetually available. Unfortunately, in practice there are a number of problems that, if not dealt with, can cause data loss in storage systems.
One primary cause of data loss is disk drive unreli-ability [16]. It is well-known that hard drives are me-chanical, moving devices that can suffer from mechani-cal problems leading to drive failure and data loss. For example, media imperfections, and loose particles caus-ing scratches, contribute to media errors, referred to as
latent sector errors, within disk drives [18]. Latent sector errors are detected by a drive’s internal error-correcting codes (ECC) and are reported to the storage system.
Less well-known, however, is that current hard drives and controllers consist of hundreds-of-thousands of lines of low-level firmware code. This firmware code, along with higher-level system software, has the potential for harboring bugs that can cause a more insidious type of disk error – silent data corruption, where the data is silently corrupted with no indication from the drive that an error has occurred.
Silent data corruptions could lead to data loss more of-ten than laof-tent sector errors, since, unlike laof-tent sector er-rors, they cannot be detected or repaired by the disk drive itself. Detecting and recovering from data corruption re-quires protection techniques beyond those provided by the disk drive. In fact, basic protection schemes such as RAID [13] may also be unable to detect these problems. The most common technique used in storage systems to detect data corruption is for the storage system to add its own higher-level checksum for each disk block, which is validated on each disk block read. There is a long his-tory of enterprise-class storage systems, including ours, in using checksums in a variety of manners to detect data corruption [3, 6, 8, 22]. However, as we discuss later, checksums do not protect against all forms of corruption. Therefore, in addition to checksums, our storage system also uses file system-level disk block identity informa-tion to detect previously undetectable corrupinforma-tions.
In order to further improve on techniques to handle corruption, we need to develop a thorough understanding of data corruption characteristics. While recent studies provide information on whole disk failures [11, 14, 16] and latent sector errors [2] that can aid system designers in handling these error conditions, very little is known about data corruption, its prevalence and its character-istics. This paper presents a large-scale study of silent data corruption based on field data from1.53million disk drives covering a time period of41months. We use the
same data set as the one used in recent studies of latent sector errors [2] and disk failures [11]. We identify the fraction of disks that develop corruption, examine fac-tors that might affect the prevalence of corruption, such as disk class and age, and study characteristics of corrup-tion, such as spatial and temporal locality. To the best of our knowledge, this is the first study of silent data cor-ruption in production and development systems.
We classify data corruption into three categories based on how it is discovered: checksum mismatches, iden-tity discrepancies, and parity inconsistencies (described in detail in Section 2.3). We focus on checksum mis-matches since they are found to occur the most. Our im-portant observations include the following:
(i) During the 41-month time period, we observe more than400,000instances of checksum mismatches,8%of which were discovered during RAID reconstruction, cre-ating the possibility of real data loss. Even though the rate of corruption is small, the discovery of checksum mismatches during reconstruction illustrates that data corruption is a real problem that needs to be taken into account by storage system designers.
(ii) We find that nearline (SATA) disks and their adapters develop checksum mismatches an order of magnitude more often than enterprise class (FC) disks. Surprisingly, enterprise class disks with checksum mismatches de-velop more of them than nearline disks with mismatches. (iii) Checksum mismatches are not independent occur-rences – both within a disk and within different disks in the same storage system.
(iv) Checksum mismatches have tremendous spatial lo-cality; on disks with multiple mismatches, it is often con-secutive blocks that are affected.
(v) Identity discrepancies and parity inconsistencies do occur, but affect 3 to 10 times fewer disks than checksum mismatches affect.
The rest of the paper is structured as follows. Section 2 presents the overall architecture of the storage systems used for the study and Section 3 discusses the method-ology used. Section 4 presents the results of our analy-sis of checksum mismatches, and Section 5 presents the results for identity discrepancies, and parity inconsisten-cies. Section 6 provides an anecdotal discussion of cor-ruption, developing insights for corruption-proof storage system design. Section 7 presents related work and Sec-tion 8 provides a summary of the paper.
2
Storage System Architecture
The data we analyze is from tens-of-thousands of pro-duction and development Network ApplianceTMstorage systems (henceforth calledthe system) installed at
hun-dreds of customer sites. This section describes the ar-chitecture of the system, its corruption detection mecha-nisms, and the classes of corruptions in our study.
2.1
Storage Stack
Physically, the system is composed of a storage-controller that contains the CPU, memory, network in-terfaces, and storage adapters. The storage-controller is connected to a set of disk shelves via Fibre Channel loops. The disk shelves house individual disk drives. The disks may either be enterprise class FC disk drives or nearline serial ATA (SATA) disks. Nearline drives use hardware adapters to convert the SATA interface to the Fibre Channel protocol. Thus, the storage-controller views all drives as being Fibre Channel (however, for the purposes of the study, we can still identify whether a drive is SATA and FC using its model type).
The software stack on the storage-controller is com-posed of the WAFLR file system, RAID, and storage
layers. The file system processes client requests by issu-ing read and write operations to the RAID layer, which transforms the file system requests into logical disk block requests and issues them to the storage layer. The RAID layer also generates parity for writes and reconstructs data after failures. The storage layer is a set of cus-tomized device drivers that communicate with physical disks using the SCSI command set [23].
2.2
Corruption Detection Mechanisms
The system, like other commercial storage systems, is designed to handle a wide range of disk-related errors. The data integrity checks in place are designed to de-tect and recover from corruption errors so that they are not propagated to the user. The system does not know-ingly propagate corrupt data to the user under any cir-cumstance.
We focus on techniques used to detect silent data cor-ruption, that is, corruptions not detected by the disk drive or any other hardware component. Therefore, we do not describe techniques used for other errors, such as trans-port corruptions retrans-ported as SCSI transtrans-port errors or la-tent sector errors. Lala-tent sector errors are caused by physical problems within the disk drive, such as media scratches, “high-fly” writes, etc. [2, 18], and detected by the disk drive itself by its inability to read or write sec-tors, or through its error-correction codes (ECC).
In order to detect silent data corruptions, the system stores extra information to disk blocks. It also peri-odically reads all disk blocks to perform data integrity checks. We now describe these techniques in detail.
Corruption Class Possible Causes Detection Mechanism Detection Operation Checksum mismatch Bit-level corruption; torn write; RAID block checksum Any disk read
misdirected write
Identity discrepancy Lost or misdirected write File system-level block identity File system read Parity inconsistency Memory corruption; lost write; RAID parity mismatch Data scrub
bad parity calculation
Table 1:Corruption classes summary.
(a) Format for enterprise class disks
0 0 0 1 1 1 520 520 520 520 520 520
4 KB File system data block
520 520
64−byte Data Integrity Segment
(b) Format for nearline disks
0 0 0 0 1 1 1 1 4 KB File system data block
512 512 512 512 512 512 512 512 512 448 bytes unused
64−byte Data Integrity Segment +
(c) Structure of the data integrity segment (DIS)
.
Checksum of data block Identity of data block
...
Checksum of DIS
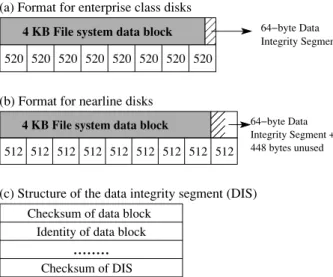
Figure 1: Data Integrity Segment. The figure shows the different on-disk formats used to store the data integrity seg-ment of a disk block on (a) enterprise class drives with520B sectors, and on (b) nearline drives with512Bsectors. The fig-ure also shows (c) the structfig-ure of the data integrity segment. In particular, in addition to the checksum and identity informa-tion, this structure also contains a checksum of itself.
2.2.1 Data Integrity Segment
In order to detect disk block corruptions, the system writes a 64-byte data integrity segment along with each disk block. Figure 1 shows two techniques for storing this extra information, and also describes its structure. For enterprise class disks, the system uses 520-byte sec-tors. Thus, a 4-KB file system block is stored along with 64 bytes of data integrity segment in eight 520-byte sec-tors. For nearline disks, the system uses the default 512-byte sectors and store the data integrity segment for each set of eight sectors in the following sector. We find that the protection offered by the data integrity segment is well-worth the extra space needed to store them.
One component of the data integrity segment is a checksum of the entire 4 KB file system block. The checksum is validated by the RAID layer whenever the data is read. Once a corruption has been detected, the
original block can usually be restored through RAID re-construction. We refer to corruptions detected by RAID-level checksum validation aschecksum mismatches.
A second component of the data integrity segment is block identity information. In this case, the fact that the file system is part of the storage system is utilized. The identity is the disk block’s identity within the file system (e.g., this block belongs to inode 5 at offset 100). This identity is cross-checked at file read time to ensure that the block being read belongs to the file being accessed. If, on file read, the identity does not match, the data is reconstructed from parity. We refer to corruptions that are not detected by checksums, but detected through file system identity validation asidentity discrepancies.
2.2.2 Data Scrubbing
In order to pro-actively detect errors, the RAID layer pe-riodicallyscrubsall disks. A data scrub issues read op-erations for each physical disk block, computes a sum over its data, and compares the computed check-sum to the checkcheck-sum located in its data integrity seg-ment. If the checksum comparison fails (i.e., a checksum mismatch), the data is reconstructed from other disks in the RAID group, after those checksums are also verified. If no reconstruction is necessary, the parity of the data blocks is generated and compared with the parity stored in the parity block. If the parity does not match the ver-ified data, the scrub process fixes the parity by regener-ating it from the data blocks. In a system protected by double parity, it is possible to definitively tell which of the parity or data block is corrupt.
We refer to these cases of mismatch between data and parity as parity inconsistencies. Note that data scrubs are unable to validate the extra file system identity infor-mation stored in the data integrity segment, since, by its nature, this information only has meaning to the file tem and not the RAID-level scrub. Depending on sys-tem load, data scrubs are initiated on Sunday evenings. From our data, we find that an entire RAID group is scrubbed approximately once every two weeks on an av-erage. However, we cannot ascertain from the data that every disk in the study has been scrubbed.
2.3
Corruption Classes
This study focuses on disk block corruptions caused by both hardware and software errors. Hardware bugs in-clude bugs in the disk drive or the disk shelf firmware, bad memory, and adapter failures. Software bugs could also cause some corruption. In many cases, the cause of corruption cannot be identified. We detect different forms of corruption using the different data protection mechanisms in place. As mentioned earlier, we distin-guish between these forms in our study. Table 1 gives a summary of these corruption classes.
• Checksum mismatches (CMs): This corruption class refers to cases where the corruption is detected from mismatched data and checksum. The cause could be (i) data content corrupted by components within the data path, or (ii) a torn write, wherein only a portion of the data block is written successfully, or (iii) a mis-directed write, wherein the data is written to either the wrong disk or the wrong location on disk, thus overwrit-ing and corruptoverwrit-ing data [3, 15]. Checksum mismatches can be detected anytime a disk block is read (file system reads, data scrubs, RAID reconstruction and so on).
•Identity discrepancies (IDs): This corruption class refers to a mismatch detected when a disk block iden-tity check is performed during a file system read. The cause could be (i) a lost write, which typically occurs be-cause a write destined for disk is not written but thought of as written, or (ii) a misdirected write, where the orig-inal disk location is not updated. We are aware of actual cases when the disk firmware replied successfully to a write that was never written to stable media. Identity dis-crepancies can be detected only during file system reads. •Parity inconsistencies (PIs): This corruption class refers to a mismatch between the parity computed from data blocks and the parity stored on disk despite the indi-vidual checksums being valid. This error could be caused by lost or misdirected writes, in-memory corruptions, processor miscalculations, and software bugs. Parity in-consistencies are detected only during data scrubs.
Our study primarily focuses on checksum mismatches, since we find that these corruptions occur much more frequently.
3
Methodology
This section describes some terminology, our data col-lection and analysis methodology, and notation used to discuss our results.
3.1
Terminology
We use the following terms in the remaining sections.
Disk class Enterprise Class or nearline disk drives with respectively Fibre Channel and ATA interfaces. Disk family A particular disk drive product. The same
product (and hence a disk family) may be offered in different capacities. Typically, disks in the same family only differ in the number of platters and/or read/write heads [17].
Disk model The combination of a disk family and a par-ticular disk size. Note that this term does not imply an analytical or simulation model.
Disk age The amount of time a disk has been in the field since its ship date, rather than the manufacture date. In practice these these two values are typically within a month of each other.
Corrupt block This term refers to a 4-KB file system block with a checksum mismatch.
Corrupt disk This term is used to refer to a disk drive that has at least one corrupt block.
3.2
Data Collection and Analysis
We now describe our data collection and analysis methodology and some limitations.
Data collection:The storage system has a built-in, low-overhead mechanism called Autosupport to log impor-tant system events back to a central repository. These messages can be enabled for a variety of system events including disk errors. Not all customers enable logging, although a large percentage do. Those that do, some-times do so only after some period of initial use. These logs allow customized support based on observed events. Although these logs are primarily intended for support, they have also been utilized for analyzing various disk errors. In addition to our corruption study, this repos-itory (the “Network Appliance Autosupport Database”) has been used in disk failure [11] and latent sector er-ror [2] studies.
Analysis: We study corruption instances that were logged in tens of thousands of storage systems for a pe-riod of41months starting in January 2004. These sys-tems belong to a range of different models, run differ-ent versions of storage-controller software (perhaps with one or more updates during the study period) and contain many different models or versions of hardware compo-nents. In order to have a complete history of the activities of the disks used in the study, we constrain our sample to only those disks that were shipped after January 2004. Our sample consists of1.53million disk drives. These drives belong to 14 disk families and 31 distinct models. To derive statistically significant results, we often further constrain the sample set depending on the analysis being performed. For example, we sometimes use shorter time
periods for our analysis so as to maximize the number of models we can study; clearly not all disk families and models have been in the field for the same duration. The disk models we consider for each study may have one of the following constraints:
•Model has at least 1000 disks in the field for time period being considered.
•Model has at least 1000 disks in the field and at least 15 corrupt disks for time being considered.
The first constraint is used for studies of factors that impact checksum mismatches, while other studies use the second constraint. In addition to the constraints on the model sample, we often restrict our data to include only the first17months since a drive was shipped. This helps make results more comparable, since many of the drives in the study were shipped on different dates and have been in the field for different amounts of time.
While we usually present data for individual disk mod-els, we sometimes also report averages (mean values) for nearline disks and enterprise class disks. Since the sam-ple size for different disk models per disk class varies considerably, we weigh the average by the sample size of each disk model in the respective class.
Limitations:The study has a few limitations that mostly stem from the data collection process. First, for a vari-ety of reasons, disks may be removed from the system. Our study includes those disks up to the point of their removal from the system. Therefore, we may not ob-serve errors from otherwise error prone disks after some period of time. Second, since the logging infrastructure has been built with customized support as the primary purpose, the data can be used to answer most but not all questions that are interesting for a study such as ours. For example, while we can identify the exact disk when an error is detected during a scrub, we cannot verify that every disk in the study has been scrubbed periodically in the absence of errors.
3.3
Notation
We denote each disk drive model asfamily-type. For anonymization purposes,familyis a single letter repre-senting the disk family (e.g., Quantum Fireball EX) and typeis a single number representing the disk’s particular capacity. Although capacities are anonymized, relative sizes within a family are ordered by the number repre-senting the capacity. For example, n-2 is larger than n-1, and n-3 is larger than both n-1 and n-2. The anonymized capacities do not allow comparisons across disk families. Disk families fromAtoE(upper case letters) are nearline disk families, while families fromftoo(lower case let-ters) are enterprise class disk families. Lines on graphs labeled NL andES represent the weighted average for nearline and enterprise class disk models respectively.
We present data as the probability of developing x checksum mismatches for a particular sample of disks. The notationP(XT ≥ L)denotes the probability of a disk developing at leastLchecksum mismatches within T months since the disk’s first use in the field.
4
Checksum Mismatches
This section presents the results of our analysis of check-sum mismatches. We first provide basic statistics on the occurrence of checksum mismatches in the entire pop-ulation of disk drives. We then examine various fac-tors that affect the probability of developing checksum mismatches. Next, we analyze various characteristics of checksum mismatches, such as spatial locality. Further, we look for correlations between occurrence of check-sum mismatches and other system or disk errors. Finally, we analyze the source of the disk requests that discovered the mismatches.
4.1
Summary Statistics
During the 41-month period covered by our data we ob-serve a total of about 400,000checksum mismatches. Of the total sample of1.53million disks, 3855 disks de-veloped checksum mismatches – 3088 of the 358,000 nearline disks (0.86%) and 767 of the1.17million enter-prise class disks (0.065%). Using our probability repre-sentation,P(Xt ≥ 1)= 0.0086 for nearline disks, and P(Xt ≥ 1)= 0.00065 for enterprise class disks with-out any restriction on time,t. This indicates that nearline disks may be more susceptible to corruption leading to checksum mismatches than enterprise class disks. On av-erage, each disk developed 0.26 checksum mismatches. Considering only corrupt disks, that is disks that experi-enced at least one checksum mismatch, the mean number of mismatches per disk is 104, the median is 3 and the mode (i.e. the most frequently observed value) is 1 mis-match per disk. The maximum number of mismis-matches observed for any single drive is 33,000.
4.2
Factors
We examine the dependence of checksum mismatches on various factors: disk class, disk model, disk age, disk size, and workload.
4.2.1 Disk Class, Model and Age
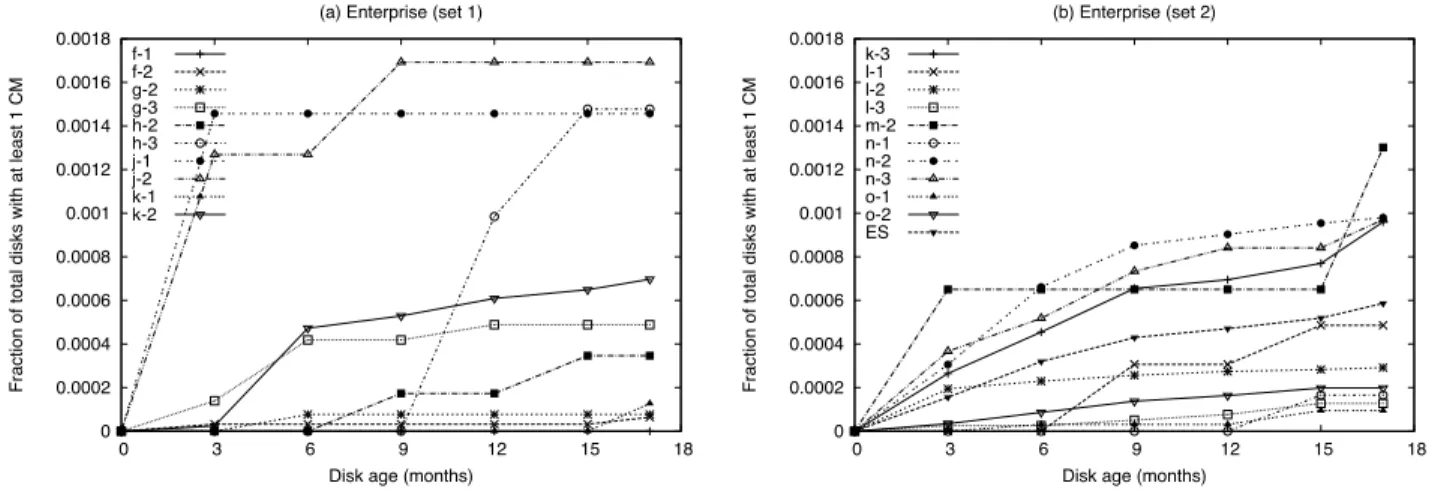
Figures 2 and 3 show the probability of a disk developing checksum mismatches as it ages for nearline and enter-prise class disks respectively. The graphs plot the cu-mulative distribution function of the time until the first
0 0.005 0.01 0.015 0.02 0.025 0.03 0.035 0.04 0 3 6 9 12 15 18
Fraction of total disks with at least 1 CM
Disk age (months) A-1 C-1 D-1 D-2 E-1 E-2 NL
Figure 2: Impact of disk age on nearline disks. The probability that a disk develops checksum mismatches as it ages is shown for nearline disk models. Note that the probability is cumulative.
checksum mismatch occurs. The figures can be repre-sented asP(Xt≥1)fort={3, 6, 9, 12, 15, 17}months, i.e., the probability of at least one checksum mismatch after t months. Note the different Y-axis scale for the nearline and enterprise class disks.
We see from the figures that checksum mismatches de-pend on disk class, disk model and disk age.
Observation 1 Nearline disks (including the SATA/FC adapter) have an order of magnitude higher probabil-ity of developing checksum mismatches than enterprise class disks.
Figure 2 (line ‘NL’ – Nearline average) shows that 0.66% of nearline disks develop at least one mismatch during the first17months in the field (P(X17 ≥ 1) = 0.0066), while Figure 3(b) (line ‘ES’) indicates that only 0.06% of enterprise class disks develop a mismatch dur-ing that time (P(X17≥1)= 0.0006).
Observation 2 The probability of developing check-sum mismatches varies significantly across different disk models within the same disk class.
We see in Figure 2 that there is an order of magnitude difference between models ‘C-1’ and ‘E-2’ for develop-ing at least one checksum mismatch after17months; i.e.,
P(X17≥1) = 0.035for ‘C-1’ and0.0027for ‘E-2’. Observation 3 Age affects different disk models differ-ently with respect to the probability of developing check-sum mismatches.
On average, as nearline disks age, the probability of developing a checksum mismatch is fairly constant, with some variation across the models. As enterprise class disks age, the probability of developing the first check-sum mismatch decreases after about 6-9 months and then stabilizes.
4.2.2 Disk Size
Observation 4 There is no clear indication that disk size affects the probability of developing checksum mis-matches.
Figure 4 presents the fraction of disks that develop checksum mismatches within 17 months of their ship-date (i.e., the rightmost data points from Figures 2 and 3;
P(X17 ≥ 1)). The disk models are grouped within their families in increasing size. Since the impact of disk size on the fraction of disks that develop checksum mis-matches is not constant across all disk families (it occurs in only 7 out of 10 families), we conclude that disk size does not necessarily impact the probability of developing checksum mismatches.
4.2.3 Workload
Observation 5 There is no clear indication that work-load affects the probability of developing checksum mis-matches.
The systems in the study collect coarse workload data including the number of read and write operations, and the number of blocks read and written for each week of our study. To study the effect of workload on checksum mismatches, we computed the correlation coefficient be-tween the workload data and the number of checksum mismatches observed in the system.
We find that in all cases the correlation coefficient is less than 0.1 (in fact, in most cases less than 0.001), in-dicating no significant correlation between workload and checksum mismatches. However, these results might be due to having only coarse system rather than per-drive workload data. A system consists of at least 14 disks and can have as many as several hundred disks. Aggregating data across a number of disks might blur existing correlations between an individual drive’s work-load and corruption behavior.
4.3
Characteristics
In this subsection, we explore various characteristics of checksum mismatches. First, we analyze the number of mismatches developed by corrupt disks. Then, we ex-amine whether mismatches are independent occurrences. Finally, we examine whether the mismatches have spatial or temporal locality.
4.3.1 Checksum mismatches per corrupt disk Figure 5 shows the cumulative distribution function of the number of checksum mismatches observed per cor-rupt disk, i.e. the Y-axis shows the fraction of corcor-rupt
0 0.0002 0.0004 0.0006 0.0008 0.001 0.0012 0.0014 0.0016 0.0018 0 3 6 9 12 15 18
Fraction of total disks with at least 1 CM
Disk age (months) (a) Enterprise (set 1)
f-1 f-2 g-2 g-3 h-2 h-3 j-1 j-2 k-1 k-2 0 0.0002 0.0004 0.0006 0.0008 0.001 0.0012 0.0014 0.0016 0.0018 0 3 6 9 12 15 18
Fraction of total disks with at least 1 CM
Disk age (months) (b) Enterprise (set 2) k-3 l-1 l-2 l-3 m-2 n-1 n-2 n-3 o-1 o-2 ES
Figure 3: Impact of disk age on enterprise class disks. The probability that a disk develops checksum mismatches as it ages is shown for enterprise class disk models. Note that the probability is cumulative.
0 0.005 0.01 0.015 0.02 0.025 0.03 0.035 D-1 D-2 E-1 E-2
Fraction of total disks with at least 1 CM
Disk Model (a) Nearline 0 0.0002 0.0004 0.0006 0.0008 0.001 0.0012 0.0014 0.0016 0.0018 f-1 f-2 g-2 g-3 h-2 h-3 j-1 j-2 k-1 k-2 k-3 l-1 l-2 l-3 n-1 n-2 n-3 o-1 o-2
Fraction of total disks with at least 1 CM
Disk Model (b) Enterprise
Figure 4: The impact of disk size. The figures show the fraction of disks with at least one checksum mismatch within17 months of shipping to the field for (a) nearline disk models, and (b) enterprise class disk models.
0 0.1 0.2 0.3 0.4 0.5 0.6 0.7 0.8 0.9 1 1 2 3 4 5 10 20 50 100 200 500 1K
Fraction of corrupt disks having upto X CMs
Number of CMs (a) Nearline A-1 C-1 D-1 D-2 E-1 E-2 NL 0 0.1 0.2 0.3 0.4 0.5 0.6 0.7 0.8 0.9 1 1 2 3 4 5 10 20 50 100 200 500 1K
Fraction of corrupt disks having upto X CMs
Number of CMs (b) Enterprise k-2 k-3 l-1 l-2 n-2 n-3 o-2 ES
Figure 5:Checksum mismatches per corrupt disk. The fraction of corrupt disks as a function of the number of checksum mismatches that develop within17months after the ship date for (a) nearline disk models and (b) enterprise class disk models. Note that the x-axis is not linear in scale – the lines in the graph are used only to help distinguish the points of different disk models, and their slopes are not meaningful.
disks that have fewer than or equal to X number of cor-rupt blocks. The figure can be represented asP(X17 ≤ x|X17 ≥1)forx={1, 2, 3, 4, 5, 10, 20, 50, 100, 200, 500, 1000}.
Observation 6 The number of checksum mismatches per corrupt disk varies greatly across disks. Most cor-rupt disks develop only a few mismatches each. However, a few disks develop a large number of mismatches.
Figure 5 shows that a significant fraction of corrupt disks (more than a third of all corrupt nearline disks and more than a fifth of corrupt enterprise disks) de-velop only one checksum mismatch. On the other hand, a small fraction of disks develop several thousand check-sum mismatches. The large variability in the number of mismatches per drive is also reflected in the great differ-ence between the mean and median: while the median is only 3 mismatches per drive, the mean is 78.
A more detailed analysis reveals that the distributions exhibit heavy tails. A large fraction of the total number of checksum mismatches observed in our study is experi-enced by a very small fraction of the corrupt disks. More precisely, 1% of the corrupt disks (the top 1% corrupt disks with the largest number of mismatches) produce more than half of all mismatches recorded in the data. Observation 7 On average, corrupt enterprise class disks develop many more checksum mismatches than cor-rupt nearline disks.
Figure 5(a) (line ‘NL’) and Figure 5(b) (line ‘ES’) show that within17months 50% of corrupt disks (i.e., the median) develop about 2 checksum mismatches for nearline disks, but almost 10 for enterprise class disks. The trend also extends to a higher percentage of corrupt disks. For example, 80% of nearline corrupt disks have fewer than 20 mismatches, whereas 80% of enterprise class disks have fewer than 100 mismatches. Given that very few enterprise class disks develop checksum mis-matches in the first place, in the interest of reliability and availability, it might make sense to replace the enterprise class disk when the first mismatch is detected.
Observation 8 Checksum mismatches within the same disk are not independent.
We find that the conditional probability of develop-ing further checksum mismatches, given that a disk has at least one mismatch, is higher than the probability of developing the first mismatch. For example, while the probability that a nearline disk will develop one or more checksum mismatches in17months is only 0.0066, the conditional probability of developing more than 1 mis-match given that the disk already has one mismis-match is as high as 0.6 (1minus0.4, the probability of exactly 1 block developing a checksum mismatch in Figure 5).
Finally, it is interesting to note that nearline disk model ‘E-1’ is particularly aberrant – around 30% of its corrupt disks develop more than 1000 checksum mismatches. We are currently investigating this anomaly.
4.3.2 Dependence between disks in same system Observation 9 The probability of a disk developing a checksum mismatch is not independent of that of other disks in the same storage system.
While most systems with checksum mismatches have only one corrupt disk, we do find a considerable number of instances where multiple disks develop checksum mis-matches within the same storage system. In fact, one of the systems in the study that used nearline disks had 92 disks develop checksum mismatches. Taking the max-imum number of disks in the systems in the study into consideration, the probability of 92 disks developing er-rors independently is less than1e−12, much less than 1e−05, the approximate fraction of systems represented by one system. This dependence is perhaps indicative of a common corruption-causing component, such as a shelf controller or adapter. We are aware of such compo-nents causing corruptions.
4.3.3 Spatial Locality
We measure spatial locality by examining whether each corrupt block has another corrupt block (a neighbor) within progressively larger regions (locality radius) around it on the same disk. For example, if in a disk, blocks numbered 100, 200 and 500 have checksum mis-matches, then blocks 100 and 200 have one neighbor at a locality radius of 100, and all blocks (100, 200, and 500) have at least one neighbor at a locality radius of 300.
Figure 6 shows the percentage of corrupt blocks that have at least one neighbor within different locality radii. Since a larger number of checksum mismatches will sig-nificantly skew the numbers, we consider only disks with 2 to 10 mismatches. The figure can be represented as P(Xr
t ≥1|2≤Xt≤10).Xris the number of corrupt blocks in block numbers< a−r, a+r >around corrupt blocka (but excludingaitself). The values for radius rare{1, 10, 100, ..., 100M}blocks, and0 < t ≤ 41 months. The figure also includes a lineRandomthat sig-nifies the line that would be obtained if the checksum mismatches were randomly distributed across the block address space. This line can be used as a comparison point against the other lines. Note that this line is at0 for most of the graph, signifying that there is no spatial locality for a random distribution.
For the actual data for the different disk models, we see that most disk models are much higher on the graph thanRandomwhen the x-axis value is1; for more than
0 0.1 0.2 0.3 0.4 0.5 0.6 0.7 0.8 0.9 1
1 10 100 1000 10000 100000 1e+06 1e+07 1e+08 1e+09
Fraction of CMs having at least 1 neighbor
Locality Radius (in blocks) (a) Nearline A-1 C-1 D-1 D-2 E-1 E-2 NL Random 0 0.1 0.2 0.3 0.4 0.5 0.6 0.7 0.8 0.9 1
1 10 100 1000 10000 100000 1e+06 1e+07 1e+08 1e+09
Fraction of CMs having at least 1 neighbor
Locality Radius (in blocks) (b) Enterprise k-2 k-3 n-2 n-3 ES Random
Figure 6:Spatial Locality. The graphs show the probability of another checksum mismatch within a given radius (disk block range) of one checksum mismatch. Each figure also includes a line labeled “Random” corresponding to when the same number of mismatches (as nearline and enterprise class respectively) are randomly distributed across the block address space. Only disks with between 2 and 10 mismatches are included.
0 0.2 0.4 0.6 0.8 1 1 10 100 1000 10000 100000 1e+06
Fraction of checksum mismatches
Minutes (a) Nearline A-1 C-1 D-1 D-2 E-1 E-2 0 0.2 0.4 0.6 0.8 1 1 10 100 1000 10000 100000 1e+06
Fraction of corruption events
Minutes (b) Enterprise k-2 k-3 l-1 l-2 n-2 n-3 o-2 o-3
Figure 7:Inter-arrival times. The graphs show the cumulative distribution of the inter-arrival times of checksum mismatches per minute. The fraction of mismatches per model is plotted against time. The arrival times are binned by minute.
50% of the corrupt blocks in nearline disks and more than 40% of the corrupt blocks in enterprise class disks, the immediate neighboring block also has a checksum mismatch (on disks with between 2 and 10 mismatches). These percentages indicate very high spatial locality. Observation 10 Checksum mismatches have very high spatial locality. Much of the observed locality is due to consecutive disk blocks developing corruption. Beyond consecutive blocks, the mismatches show very little spa-tial locality.
We see from the figures that, while the lines for the disk models start at a very high value when the x-axis value is 1, they are almost flat for most of the graph, moving steeply upwards to 1 only towards the end (x-axis values more than1e+06). This behavior shows that most of the spatial locality is due to consecutive blocks
developing checksum mismatches. However, it is im-portant to note that even when the consecutive mismatch cases are disregarded, the distribution of the mismatches still has spatial locality.
Given the strong correlation between checksum mis-matches in consecutive blocks, it is interesting to exam-ine the run length of consecutive mismatches, i.e., how many consecutive blocks have mismatches. We find that, among drives with at least 2 checksum mismatches(and no upper bound on mismatches), on average 3.4 consec-utive blocks are affected. In some cases, the length of consecutive runs can be much higher than the average. About 3% of drives with at least 2 mismatches see one or more runs of 100 consecutive blocks with mismatches. 0.7% of drives with at least 2 mismatches see one or more runs of 1000 consecutive mismatches.
4.3.4 Temporal Locality
Figure 7 shows the fraction of checksum mismatches that arrive (are detected) withinxminutes of a previous mis-match. The figure can be represented as P(Xt+x ≥ k+1|Xt=k∧XT≥k+ 1)fork≥ 1,0≤ t < T ≤ 41
months, and1≤ x≤ 1e+ 06minutes.
Observation 11 Most checksum mismatches are de-tected within one minute of a previous detection of a mis-match.
The figure shows that the temporal locality for detect-ing checksum mismatches is extremely high. This be-havior may be an artifact of the manner in which the de-tection takes place (by scrubbing) and the fact that many mismatches are spatially local and are therefore likely to be discovered together. Further analysis shows that this is not necessarily the case.
Observation 12 Checksum mismatches exhibit tempo-ral locality over larger time windows and beyond the ef-fect of detection time as well.
In order to remove the impact of detection time, we ex-amine temporal locality over larger time windows. For each drive, we first determine the number of checksum mismatches experienced in each 2-week time window that the drive was in the field and then compute the au-tocorrelation function (ACF) on the resulting time series. The autocorrelation function (ACF) measures the corre-lation of a random variable with itself at different time lagsl. The ACF can be used to determine whether the number of mismatches in one two-week period of our time-series is correlated with the number of mismatches observed l 2-week periods later. The autocorrelation coefficient can range between 1 (high positive correla-tion) and -1 (high negative correlacorrela-tion). A value of zero would indicate no correlation, supporting independence of checksum mismatches.
Figure 8 shows the resulting ACF. The graph presents the average ACF across all drives in the study that were in the field for at least17months and experienced check-sum mismatches in at least two different 2-week win-dows. Since the results are nearly indistinguishable for nearline and enterprise class drives, individual results are not given. If checksum mismatches in different 2-week periods were independent (no temporal locality on bi-weekly and larger time-scales) the graph would be close to zero at all lags. Instead we observe strong autocorre-lation even for large lags in the range of up to 10 months.
4.4
Correlations with other error types
Our system logs data on various other system and disk errors as well. We attempted to establish correlations for0 5 10 15 0 0.2 0.4 0.6 0.8 1 Lag (months) Autocorrelation
Figure 8: Temporal Autocorrelation. The graph shows the autocorrelation function for the number of checksum mis-matches per 2-week time windows. This representation of the data allows us to study temporal locality of mismatches at larger time-scales without being affected by the time of detec-tion.
checksum mismatches with system resets, latent sector errors, and not-ready-conditions.
Observation 13 Checksum mismatches correlate with system resets.
The conditional probability of a system reset at some point of time, given that one of the disks in the system has a checksum mismatch, is about 3.7 times the uncon-ditional probability of a system reset. After a system reset, the system performs higher-level recovery opera-tions; for example, a thorough file system integrity check may be run.
Observation 14 There is a weak positive correlation be-tween checksum mismatches and latent sector errors.
The probability of a disk developing latent sector er-rors,P(Yt≥1), is 0.137 for nearline disks and 0.026 for enterprise class disks (Y is the number of latent sector errors,0 < t ≤ 41months). The conditional probabil-ityP(Yt ≥ 1|Xt ≥ 1) = 0.195 for nearline disks and 0.0556 for enterprise class disks. Thus, the conditional probability of a latent sector error, given that a disk has checksum mismatch, is about 1.4 times the unconditional probability of a latent sector error in the case of nearline disks and about 2.2 times the unconditional probability for enterprise class disks. These values indicate a weak positive correlation between the two disk errors.
In order to test the statistical significance of this corre-lation we performed a chi-square test for independence. We find that we can with high confidence reject the hy-pothesis that checksum mismatches and latent sector er-rors are independent, both in the case of nearline disks and enterprise class disks (confidence level of more than 99.999%). Interestingly, the results vary if we repeat the
chi-square test separately for each individual disk model (including only models that had at least 15 corrupt disks). We can reject independence with high certainty (at least 95% confidence) for only four out of seven nearline mod-els (B-1, C-1, D-1, E-2) and two out of seven enterprise class models (l-1, n-3).
Observation 15 There is a weak correlation between checksum mismatches and not-ready-conditions.
The probability of a disk developing not-ready-conditions,P(Zt≥1), is 0.18 for nearline and 0.03 for
enterprise class disks. P(Zt ≥ 1|Xt ≥ 1)is 0.304 for nearline and 0.0155 for enterprise class disks. Thus, the conditional probability of a not-ready-condition, given that a disk has checksum mismatch, is about 1.7 times the unconditional probability of a not-ready-condition in the case of nearline disks and about 0.5 times the un-conditional probability for enterprise class disks. These values indicate mixed behavior – a weak positive corre-lation for nearline disks and a weak negative correcorre-lation for enterprise class disks.
In order to test the statistical significance of the corre-lation between not-ready-conditions and checksum mis-matches, we again perform a chi-square test for indepen-dence. We find that for both nearline and enterprise disks we can reject the hypothesis that not-ready conditions and random corruptions are independent with more than 96% confidence. We repeat the same test separately for each disk model (including only models that had at least 15 corrupt disks). In the case of nearline disks, we can reject the independence hypothesis for all models, except for two (A-1 and B-1) at the 95% confidence level. How-ever, in the case of enterprise class disks, we cannot re-ject the independece hypothesis for any of the individual models at a significant confidence level.
4.5
Discovery
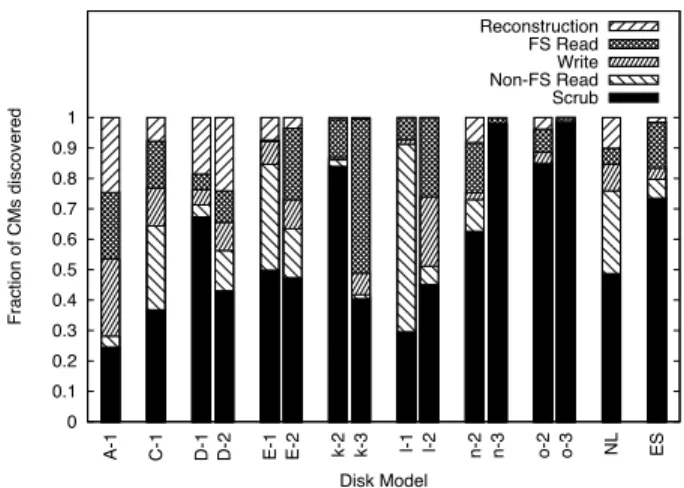
Figure 9 shows the distribution of requests that detect checksum mismatches into different request types. There are five types of requests that discover checksum mis-matches: (i) Reads by the file system (FS Read) (ii) Partial RAID stripe writes by the RAID layer (Write) (iii) Reads for disk copy operations (Non-FS Read) (iv) Reads for data scrubbing (Scrub), and (v) Reads per-formed during RAID reconstruction (Reconstruction). Observation 16 Data scrubbing discovers a large per-centage of the checksum mismatches for many of the disk models.
We see that on the average data scrubbing discovers about 49% of checksum mismatches in nearline disks (NL in the figure), and 73% of the checksum mismatches in enterprise class disks (ES in the figure). It is quite
0 0.1 0.2 0.3 0.4 0.5 0.6 0.7 0.8 0.9 1
A-1 C-1 D-1 D-2 E-1 E-2 k-2 k-3 l-1 l-2 n-2 n-3 o-2 o-3 NL ES
Fraction of CMs discovered Disk Model Reconstruction FS Read Write Non-FS Read Scrub
Figure 9: Request type analysis. The distribution of re-quests that discover checksum mismatches across the request types scrub, non-file sytstem read (say, disk copy), write (of partial RAID stripe), file system read, and RAID reconstruc-tion.
possible that these checksum mismatches may not have been discovered in the absence of data scrubbing, po-tentially exposing the system to double failures and data loss. We do not know the precise cause for the dispar-ity in percentages between nearline and enterprise class disks; one possibility this data suggests is that systems with nearline disks perform many more disk copy opera-tions (Non-FS Read), thus increasing the percentage for that request type.
Observation 17 RAID reconstruction encounters a non-negligible number of checksum mismatches.
Despite the use of data scrubbing, we find that RAID reconstruction discovers about 8% of the checksum mis-matches in nearline disks. For some models more than 20RAID reconstruction. This observation implies that (a) data scrubbing should be performed more ag-gressively, and (b) systems should consider protection against double disk failures [1, 4, 5, 9, 10, 12].
4.6
Comparison with Latent Sector Errors
In this subsection, we compare the characteristics of checksum mismatches, with the characteristics of latent sector errors, identified in a recent study [2].
Table 2 compares the behavior of checksum mis-matches and latent sector errors. Some of the interesting similarities and differences are as follows.
Frequency: The probability of developing checksum mismatches is about an order of magnitude smaller than that for latent sector errors. However, given that cus-tomers use a few million disk drives, it is important to handle both kinds of errors. Also, since latent sector er-rors are more likely to be detected, it is more likely that an undetected checksum mismatch will lead to data loss.
Characteristic Latent sector errors Checksum mismatches
Nearline Enterprise Nearline Enterprise
% disks affected per year (avg) 9.5% 1.4% 0.466% 0.042%
As disk age increases, increases remains constant remains fairly decreases, then
P(1st error) constant stabilizes
As disk size increases, increases increases unclear unclear
P(1st error)
No. of errors per disk with about 50 about 50 about 100 about 100
errors (80 percentile)
Are errors independent ? No No No No
Spatial locality at 10 MB at 10 MB at 4KB at 4KB
Temporal locality very high very high very high very high
Known Correlations not-ready-conditions recovered errors system resets, system resets, not-ready-conditions not-ready-conditions Table 2:Checksum mismatches vs. Latent sector errors. This table compares our findings on checksum mismatches with characteristics of latent sector errors identified by a recent study, for both nearline and enterprise class disk models. In addition to listed correlations, latent sector errors and checksum mismatches share a weak positive correlation with each other.
0 0.0001 0.0002 0.0003 0.0004 0.0005 0.0006 0.0007 0.0008
A-1 C-1 D-1 D-2 E-1 E-2 NL
Fraction of total disks with at least 1 ID
Disk Model (a) Nearline 0 0.0001 0.0002 0.0003 0.0004 0.0005 0.0006 0.0007 0.0008 f-1 f-2 g-2 g-3 h-2 h-3 j-1 j-2 k-1 k-2 k-3 l-1 l-2 l-3 m-2 n-1 n-2 n-3 o-1 o-2 ES
Fraction of total disks with at least 1 ID
Disk Model (b) Enterprise
Figure 10: Identity Discrepancies. The figures show the fraction of disks with at least one identity discrepancy within17 months of shipping to the field for (a) nearline disk models, and (b) enterprise class disk models.
0 0.001 0.002 0.003 0.004 0.005 0.006 0.007
A-1 C-1 D-1 D-2 E-1 E-2 NL
Fraction of total disks with at least 1 PI
Disk Model (a) Nearline 0 0.0002 0.0004 0.0006 0.0008 0.001 0.0012 0.0014 0.0016 0.0018 0.002 f-1 f-2 g-2 g-3 h-2 h-3 j-1 j-2 k-1 k-2 k-3 l-1 l-2 l-3 m-2 n-1 n-2 n-3 o-1 o-2 ES
Fraction of total disks with at least 1 PI
Disk Model (b) Enterprise
Figure 11: Parity Inconsistencies. The figures show the fraction of disks with at least one parity inconsistency within17 months of shipping to the field for (a) nearline disk models, and (b) enterprise class disk models.
Disk model: The nearline disk model E-2 has the high-est percentage of disks developing latent sector errors, but the lowest percentage of disks developing checksum mismatches within the set of nearline disk models. Impact of disk class: For both latent sector errors and checksum mismatches, enterprise class disks are less likely to develop an error than nearline disks. Surpris-ingly, however, in both cases, enterprise class disks de-velop a higher number of errors than nearline disks, once an error has developed.
Spatial locality: Both latent sector errors and checksum mismatches show high spatial locality. Interestingly, the difference in the locality radii that capture a large fraction of errors – about 10 MB for latent sector errors versus consecutive blocks for checksum mismatches – provides an insight into how the two errors could be caused very differently. Latent sector errors may be caused by me-dia scratches that could go across tracks as opposed to consecutive sectors (hence a larger locality radius) while consecutive blocks may have checksum mismatches sim-ply because the corruption(s) occurred when they were written together or around the same time.
5
Other Data Corruptions
This section presents our results on the frequency of oc-currence for two corruption classes: identity discrepan-cies, and parity inconsistencies. These corruption classes are described in Section 2.3.
5.1
Identity Discrepancies
These errors were detected in a total365disks out of the1.53million disks. Figure 10 presents the fraction of disks of each disk model that developed identity dis-crepancies in17months. We see that the fraction is more than an order of magnitude lower than that for checksum mismatches for both nearline and enterprise class disks.
Since the fraction of disks that develop identity dis-crepancies is very low, the system recommends replace-ment of the disk once the first identity discrepancy is de-tected. It is important to note, that even though the num-ber of identity discrepancies are small, silent data cor-ruption would have occurred if not for the validation of the stored contextual file system information.
5.2
Parity Inconsistencies
These errors are detected by data scrubbing. In the ab-sence of a second parity disk, one cannot identify which disk is at fault. Therefore, in order to prevent potential data loss on disk failure, the system fixes the inconsis-tency by rewriting parity. This scenario provides further motivation for double-parity protection schemes.
Figure 11 presents the fraction of disks of each disk model that caused parity inconsistencies within17 months since ship date. The fraction is 4.4 times lower than that for checksum mismatches in the case of near-line disks and about 3.5 times lower than that for check-sum mismatches for enterprise class disks.
These results assume that the parity disk is at fault. We believe that counting the number of incorrect parity disks reflect the actual number of error disks since: (i) entire shelves of disks are typically of the same age and same model, (ii) the incidence of these inconsistencies is quite low; hence, it is unlikely that multiple different disks in the same RAID group would be at fault.
6
Experience
This section uses results from our analysis of corruption and leverages our experience in protecting against data corruption to develop insights into how storage systems can be designed to deal with corruption. First, we de-scribe unexplained corruption phenomena and anecdotal insight into the causes of corruption, and then we dis-cuss the lessons learned from our experience. Finally, we list some questions that could be looked at in future data analysis.
6.1
Anecdotes
6.1.1 Some block numbers are worse
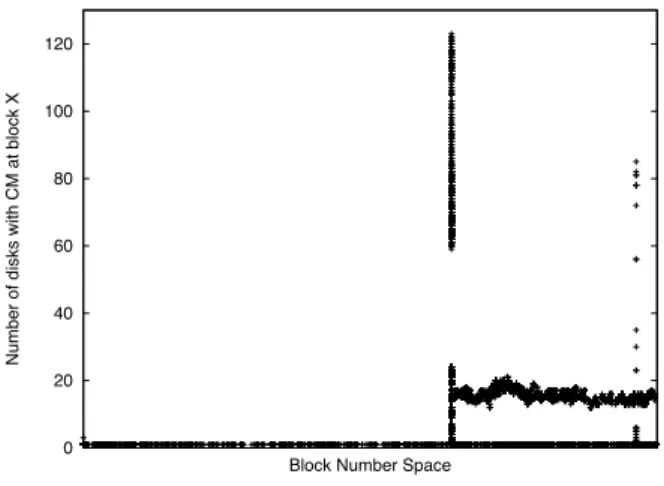
From analysis, we find that specific block numbers could be much more likely to experience corruption than other block numbers. This behavior was observed for the disk model ‘E-1’. Figure 12 presents for each block number, the number of disk drives of disk model ‘E-1’ that de-veloped a checksum mismatch at that block number. We see in the figure that many disks develop corruption for a specific set of block numbers. We also verified that (i) other disk models did not develop multiple check-sum mismatches for the same set of block numbers (ii) the disks that developed mismatches at the same block numbers belong to different storage systems, and (iii) our software stack has no specific data structure that is placed at the block numbers of interest.
These observations indicate that hardware or firmware bugs that affect specific sets of block numbers might exist. Therefore, RAID system designers may be well-advised to usestaggeredstripes such that the blocks that form a stripe (providing the required redundancy) are placed at different block numbers on different disks.
We also observed a large number of block-specific er-rors on other drive models. In at least one of these in-stances, the block contained a heavily read and written file system metadata structure – a structure akin to the
0 20 40 60 80 100 120
Number of disks with CM at block X
Block Number Space
Figure 12: Distribution of errors across block num-bers. For each disk block number, the number of disks of disk model E-1 that develop checksum mismatches at that block number is shown. The units on the x-axis have been omitted in order to anonymize the disk size of disk model E-1.
superblock. This suggests the importance of replicating important metadata structures [15, 20].
6.1.2 Other component failures
We have observed instances of the SATA/FC adapter causing data corruption in the case of disk models A-1, D-1 and D-2. Thus, it is very likely that the numbers for these disk models in Section 4 are influenced by faulty shelf controllers. Such behavior may also point to why different disks in the same system may not have inde-pendent failure behavior with respect to data corruption (Observation 9).
6.1.3 Cache flush bug
One of the disk drive models in the study had a bug spe-cific to flushing the disk’s write cache. Upon reception of a cache flush command, the disk drive sometimes re-turned success without committing the data to stable stor-age on the disk medium. If, for any reason, the disk was then power-cycled the data just written was lost. How-ever, thanks to block identity protection (and RAID), the storage system did not lose data.
6.2
Lessons Learned
We present some of the lessons learned from the analy-sis for corruption-proof storage system design. Some of these lessons are specific to RAIDs, while others can be applied to file systems as well.
• Albeit not as common as latent sector errors, data corruption does happen; we observed more than400,000 cases of checksum mismatches. For some drive models
as many as 4% of drives develop checksum mismatches during the17months examined. Similarly, even though they are rare, identity discrepancies and parity inconsis-tencies do occur. Protection offered by checksums and block identity information is therefore well-worth the ex-tra space needed to store them.
•A significant number (8% on average) of corruptions are detected during RAID reconstruction, creating the possibility of data loss. In this case, protection against double disk failures [1, 4, 5, 9, 10, 12] is necessary to prevent data loss. More aggressive scrubbing can speed the detection of errors, reducing the likelihood of an error during a reconstruction.
•Although, the probability of developing a corruption is lower for enterprise class drives, once they develop a corruption, many more are likely to follow. Therefore, replacing an enterprise class drive on the first detection of a corruption might make sense (drive replacement cost may not be a huge factor since the probability of first corruption is low).
•Some block numbers are much more likely to be af-fected by corruption than others, potentially due to hard-ware or firmhard-ware bugs that affect specific sets of block numbers. RAID system designers might be well advised to usestaggeredstripes such that the blocks that form the stripe are not stored at the same or nearby block number.
•Strong spatial locality suggests that redundant data structures should be stored distant from each other.
•The high degree of spatial and temporal locality also begs the question of whether many corruptions occur at the exact same time, perhaps when all blocks are written as part of the same disk request. This hypothesis suggests that important or redundant data structures that are used for recovering data on corruption should be written as part of different write requests spaced over time.
•Strong spatial and temporal locality (over long time periods) also suggests that it might be worth investigating how the locality can be leveraged for smarter scrubbing, e.g. trigger a scrub before it’s next scheduled time, when probability of corruption is high orselectivescrubbing of an area of the drive that’s likely to be affected.
•Failure prediction algorithms in systems should take into account the correlation of corruption with other er-rors such as latent sector erer-rors, increasing the probabil-ity of one error when an instance of the other is found.
6.3
Future Work
Future data analysis studies could focus on questions on data corruption and its causes that our current study does not answer. We discuss some such questions below.
(i) Our study looks at corruption numbers across dif-ferent disk models. We find that the numbers vary sig-nificantly across disk models, suggesting that disks (and
their adapters) may directly or indirectly cause corrup-tion most of the time. However, disks are only one of the storage stack components that could potentially cause corruption. A recent study shows that other storage sub-system components do have a significant impact on stor-age failures [11]). A future study could focus on corrup-tion numbers across different models or versions of all hardware and software components. Such a study may also help pinpoint the exact sources of data corruption.
(ii) The impact of workload on the prevalence of data corruption is unclear, especially due to the lack of fine-grained disk-level workload information. Future stud-ies may focus on obtaining this information along with recording disk corruption occurrences.
7
Related Work
There are very few studies of disk errors. Most disk fault studies examine either drive failures [14, 16, 17, 18] or latent sector errors [2]. Of the large scale drive failure studies, Schroeder and Gibson [16] analyze data from about 100,000 disks over a five year time period. They find that failure rate increases over time, and error rates are not constant with disk age. Pinheiro et al. [14] ana-lyze data associated with over 100,000 disks over a nine month period. They use this data to analyze the correla-tion of disk failures to environmental factors and usage patterns. They find that the annualized failure rate is sig-nificantly higher for drives after the first year. Jiang et al. [11] study various aspects of storage subsystem fail-ures. For example, they determine that subsystem com-ponents other than disks cause a significant fraction of observed failures. Shah and Elerath [7, 17, 18] have performed a number of studies on the reliability of disk drives. They find from these studies that there are many factors, including disk drive vintage, which influence the failure rate of disks and that there is a large variation be-tween disk models and families.
There is a large body of work regarding techniques for detecting and recovering from data corruption. Sivathanu et. al [19] survey data integrity techniques within storage systems, and classify integrity violation types and detec-tion and correcdetec-tion schemes. Prabhakaran et al. [15] de-velop a taxonomy to classify file system failures. They find that many of the file systems tested do not detect nor recover from most disk corruption errors. Many of the file systems tested use some form of disk block type checking (e.g., a magic-number for metadata), however lost or misdirected writes still cause corruption if the block’s new type matched its previous type.
Using checksums to protect data integrity is an old concept, especially in communication systems. The Tan-dem NonStop Server [3] was designed to use end-to-end checksums at the host, writing it to disk with the data
and verifying it on read. However, the majority of file systems today still rely on disk drives to report internal errors. Two of the more recent file systems to use check-sums to detect corrupted data include Sun’s ZFS [21] and Google’s GFS [8]. ZFS uses 64-bit checksums to val-idate the data path. A checksum is stored with every block pointer and is validated by the file system layer. If a checksum error is encountered and a mirrored copy is available, the mirrored copy is used to correct the data. GFS also uses checksums to protect data integrity. GFS distributes data across chunk servers that break the chunks into 64KB data blocks, each protected by a 32-bit checksum. On a checksum mismatch, the correct data is retrieved from a replica. Both file systems use some form of periodic scrubbing to validate data.
8
Conclusion
We have analyzed data corruption instances detected in 1.53 million disks used in our production storage sys-tems. We classified these instances into three classes: checksum mismatches, identity discrepancies, and par-ity inconsistencies. We find that only a small fraction of disks develop checksum mismatches. An even smaller fraction are due to identity discrepancies or parity in-consistencies. Even with the small number of errors ob-served it is still critical to detect and recover from these errors since data loss is rarely tolerated in enterprise-class and archival storage systems.
We have identified various characteristics of check-sum mismatches, including (i) the probability of devel-oping the first checksum mismatch is almost an order of magnitude higher for nearline disks than for enterprise class disks, (ii) checksum mismatches are not indepen-dent and the number of mismatches per disk follows a heavy-tailed distribution, and (iii) checksum mismatches also show high spatial and temporal locality, encouraging system designers to develop schemes that spread redun-dant data with respect to both the on-disk location and time at which they are written.
We have obtained insights for corruption-proof stor-age design from the statistical and anecdotal evidence we have collected. We believe that such insights are essen-tial for designing highly reliable storage systems.
Acknowledgments
This material is based upon work supported by the Na-tional Science Foundation under the following grants: CCF-0621487, CNS-0509474, CCR-0133456, as well as by generous donations from Network Appliance.
We thank the Autosupport team at NetApp for their help in gathering data. Members of the RAID group
including Atul Goel, Tomislav Grcanac, Rajesh Sun-daram, Jim Taylor, and Tom Theaker provided insightful comments on the analysis. David Ford, Stephen Harp-ster, Steve Kleiman, Brian Pawlowski and members of the Advanced Technology Group provided excellent in-put on the work. Ramon del Rosario, Jon Elerath, Tim Emami, Aziz Htite, Hung Lu, and Sandeep Shah helped understand characteristics of disks and systems in the study, and mine Autosupport data. Finally, we would like to thank our shepherd Alma Riska and the anony-mous reviewers for their detailed comments that helped improve the paper.
Any opinions, findings, and conclusions or recom-mendations expressed in this material are those of the authors and do not necessarily reflect the views of NSF or other institutions.
References
[1] G. A. Alvarez, W. A. Burkhard, and F. Cristian. Tolerating Mul-tiple Failures in RAID Architectures with Optimal Storage and
Uniform Declustering. InProceedings of the 24th Annual
Inter-national Symposium on Computer Architecture (ISCA ’97), pages 62–72, Denver, Colorado, June 1997.
[2] L. N. Bairavasundaram, G. R. Goodson, S. Pasupathy, and J. Schindler. An Analysis of Latent Sector Errors in Disk Drives. In Proceedings of the International Conference on Measure-ments and Modeling of Computer Systems (SIGMETRICS’07), San Diego, California, June 2007.
[3] W. Bartlett and L. Spainhower. Commercial Fault Tolerance: A
Tale of Two Systems. IEEE Transactions on Dependable and
Secure Computing, 1(1):87–96, Jan. 2004.
[4] M. Blaum, J. Brady, J. Bruck, and J. Menon. EVENODD: An Optimal Scheme for Tolerating Double Disk Failures in RAID
Architectures. InProceedings of the 21st Annual International
Symposium on Computer Architecture (ISCA ’94), pages 245– 254, Chicago, Illinois, Apr. 1994.
[5] P. Corbett, B. English, A. Goel, T. Grcanac, S. Kleiman, J. Leong, and S. Sankar. Row-diagonal parity for double disk failure
cor-rection. InProceedings of the 3rd USENIX Symposium on File
and Storage Technologies (FAST ’04), pages 1–14, San Francisco, California, Apr. 2004.
[6] M. H. Darden. Data Integrity: The Dell—EMC
Dis-tinction. http://www.dell.com/content/topics/global.aspx/power/ en/ps2q02 darden?c=us&cs=555&l=en&s=biz, May 2002. [7] J. G. Elerath and S. Shah. Server Class Disk Drives: How
Reli-able Are They. InThe Proceedings of the 50th Annual Reliability
and Maintainability Symposium, pages 151–156, Los Angeles, California, Jan. 2004.
[8] S. Ghemawat, H. Gobioff, and S.-T. Leung. The Google File
System. InProceedings of the 19th ACM Symposium on
Operat-ing Systems Principles (SOSP ’03), pages 29–43, Bolton Landing (Lake George), New York, October 2003.
[9] J. L. Hafner. WEAVER Codes: Highly Fault Tolerant Erasure
Codes for Storage Systems. InProceedings of the 4th USENIX
Symposium on File and Storage Technologies (FAST ’05), San Francisco, California, Dec. 2005.
[10] J. L. Hafner, V. W. Deenadhayalan, K. Rao, and J. A. Tomlin. Ma-trix Methods for Lost Data Reconstruction in Erasure Codes. In
Proceedings of the 4th USENIX Symposium on File and Storage Technologies (FAST ’05), San Francisco, California, Dec. 2005.
[11] W. Jiang, C. Hu, A. Kanevsky, and Y. Zhou. Is Disk the Dom-inant Contributor for Storage Subsystem Failures? A
Compre-hensive Study of Failure Characteristics. InProceedings of the
6th USENIX Symposium on File and Storage Technologies (FAST
’08), San Jose, California, Feb. 2008.
[12] C.-I. Park. Efficient Placement of Parity and Data to Tolerate
Two Disk Failures in Disk Array Systems.IEEE Transactions on
Parallel and Distributed Systems, 6(11):1177–1184, Nov. 1995. [13] D. Patterson, G. Gibson, and R. Katz. A Case for Redundant
Ar-rays of Inexpensive Disks (RAID). InProceedings of the 1988
ACM SIGMOD Conference on the Management of Data (SIG-MOD ’88), pages 109–116, Chicago, Illinois, June 1988. [14] E. Pinheiro, W. D. Weber, and L. A. Barroso. Failure Trends in a
Large Disk Drive Population. InProceedings of the 5th USENIX
Symposium on File and Storage Technologies (FAST ’07), San Jose, California, Feb. 2007.
[15] V. Prabhakaran, L. N. Bairavasundaram, N. Agrawal, H. S. Gu-nawi, A. C. Arpaci-Dusseau, and R. H. Arpaci-Dusseau. IRON
File Systems. InProceedings of the 20th ACM Symposium on
Op-erating Systems Principles (SOSP ’05), pages 206–220, Brighton, United Kingdom, Oct. 2005.
[16] B. Schroeder and G. A. Gibson. Disk Failures in the Real World:
What Does an MTTF of 1,000,000 Hours Mean to You? In
Proceedings of the 5th USENIX Symposium on File and Storage Technologies (FAST ’07), San Jose, California, Feb. 2007. [17] S. Shah and J. G. Elerath. Disk Drive Vintage and its Effect on
Reliability. InThe Proceedings of the 50th Annual Reliability
and Maintainability Symposium, pages 163–167, Los Angeles, California, Jan. 2004.
[18] S. Shah and J. G. Elerath. Reliability Analyses of Disk Drive
Fail-ure Mechanisms. InThe Proceedings of the 51st Annual
Reliabil-ity and MaintainabilReliabil-ity Symposium, pages 226–231, Alexandria, Virginia, Jan. 2005.
[19] G. Sivathanu, C. P. Wright, and E. Zadok. Ensuring data integrity
in storage: Techniques and applications. InProceedings of the
ACM Workshop on Storage Security and Survivability (StorageSS
’05), pages 26–36, Fairfax, Virginia, November 2005.
[20] M. Sivathanu, V. Prabhakaran, A. C. Arpaci-Dusseau, and R. H. Arpaci-Dusseau. Improving storage system availability with
D-GRAID. InProceedings of the 3rd USENIX Symposium on File
and Storage Technologies (FAST ’04), pages 15–30, San Fran-cisco, California, Apr. 2004.
[21] Sun Microsystems. ZFS: The last word in file systems.
www.sun.com/2004-0914/feature/, 2006.
[22] R. Sundaram. The Private Lives of Disk Drives.
http://www.netapp.com/go/techontap/matl/sample/ 0206tot resiliency.html, Feb. 2006.
[23] Information Technology: SCSI Primary Commands (SPC-2). Technical Report T10 Project 1236-D Revision 5, Sept. 1998.