USING UTILITY THEORY TO EVALUATE IVR MENU STRUCTURE AND REDUCE DRIVING DISTRACTION
Michael E. Rakauskas HumanFIRST Program
ITS Institute, University of Minnesota Minneapolis, MN 55455 E-mail: [email protected]
Summary: It has been shown that drivers often exhibit degraded driving performance while concurrently engaging in secondary tasks, such as talking on a mobile phone using navigation systems and other in-vehicle devices. As there seem to be limited solutions at present to hasten or limit these behaviors, this paper outlines how utility theory can be applied to design more efficient and understandable menus. To determine the value of information presented by an interface menu, the frequency of using information in the menu (goals) and the amount of effort it takes to accomplish these goals are quantified for each type of information. This paper outlines a utility analysis that compares the current Minnesota 511 traveler information system and an alternative design intended to improve the user experience and lighten the cognitive load of drivers. The analysis indicated that the proposed changes in design increase value to the user by helping them more efficiently find and identify requested information. Designers can use this technique in order to increase the value of menu information, and in turn help users find and identify requested information more efficiently. It is hoped that more efficient menus will reduce the amount of time and attention that drivers spend using them, allowing for increased attention on the primary task of driving.
INTRODUCTION
Eby & Vivoda (2005) have reported that 3.7 percent of Minnesotans are engaged in a hand-held phone conversation while driving at any given time during the day. This does not include hands-free phone conversations or engagement in other in-vehicle technologies, such as advanced traveler information systems (ATIS), navigation aids, and entertainment devices, which may also cause attention to be averted from the driving task.
Studies and guidelines of voice menu systems have begun to establish methodologies for building more accessible and usable Interactive Voice Response (IVR) menus (Bond and
Carmac, 1999; ISO, 1994; Schumacher, Hardzinski, & Schwartz, 1995). For example, it has been shown that increased hierarchical menu depth (i.e., number of sequential menu choices) is related to the perceived complexity of retrieving desired information, leading to degraded visual search, decision making, response selection, and certainty when locating information (Jacko &
Salvendy, 1996). In this analysis, it will be shown how depth (represented in the cost of finding information) interacts with breadth (adequacy of information) in a traveler information menu.
At this time, there has not been a considerable amount of scientific research focused on how accessing a menu, such as the 511 traveler information system, interacts with driving a vehicle. Kelly, Stanley, and Lassacher (2005) examined the effects of using a cell phone to interface 511 as a traveler information system. They reported that using voice commands to gather information from 511 was as risky as holding a conversation on a hands-free cell phone, and comparable to many of the cognitive tasks that are often asked of participants.
The purpose of this evaluation is to objectively quantify the value of information elements of Minnesota’s 511 traveler information system (MN511). As a comparison, an alternative menu (V2) was proposed based on literature reviews, as well as heuristic and utility evaluations of the MN511 menu. Through the principles of utility theory, the value of the information presented in both menu structures was objectively evaluated in terms of the usage probability and utility. This will allow for an objective and quantifiable evaluation of proposed improvements to the MN511 traveler information system.
METHODS
Two separate sets of scores (probability and utility) are necessary to compute and compare the value of information types in the menu structures. The frequencies of using information in the menus (the user’s goals) are identified and quantified in a probability matrix. Also, the amount of effort it takes to complete these goals will be quantified in a utility matrix, in terms of how many actions are necessary before finding the information.
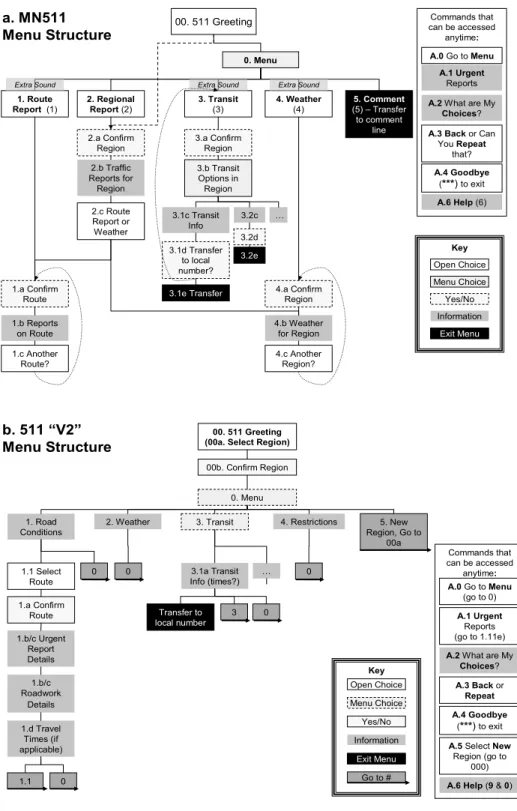
The functional menu structure, based on dialogue prompts (nodes) and possible actions, was identified for the current live MN511 system (Figure 1a). Based on this structure, a script of the dialogue heard at each prompt in the current live MN511 system was generated. The MN511 structure and script were used to generate and script the V2 structure (Figure 1b). In generating the probability matrix outcomes, these structures (Figure 1) were used to identify the paths to each information node. The scripts were used to determine the adequacy of information, but are too extensive to be presented here.
Probability Matrix
This analysis must take into account what outcomes are relevant to the user in terms of how he or she will be using the system. The probability matrix facilitates this by quantifying how likely the user is to find and identify the information they are searching for. The probability of finding useful information was calculated using the past frequency of accessing each information type in MN511, the percentage of useful information, and a score representing the adequacy of
information found.
Requirement Frequencies (p(req)) Usage data from April 2005 through March 2006 of the live MN511 traveler information system was provided by the Minnesota Department of
Transportation (Mn/DOT) in order to determine the frequency at which users accessed each type of information. This included the types of information that were most frequently queried (e.g., traffic, weather) and what specific voice commands were most-frequently given when using MN511 (e.g., “menu,” “route reports”).
00. 511 Greeting 0. Menu 1. Route Report(1) 2. Regional Report(2) 3. Transit (3) 4. Weather (4) 5. Comment (5) – Transfer to comment line 2.a Confirm
Region 3.a Confirm Region 2.b Traffic Reports for Region 3.b Transit Options in Region 4.b Weather for Region 1.c Another
Route? 4.c Another Region?
3.1e Transfer
1.b Reports on Route
Extra Sound Extra Sound
1.a Confirm Route Extra Sound Key Open Choice Menu Choice Information Exit Menu Yes/No 3.1d Transfer to local number? 3.1c Transit Info 2.c Route Report or Weather 3.2e 3.2d 3.2c … Commands that can be accessed anytime: A.6 Help(6) A.0 Go to Menu
A.3 Backor Can You Repeat
that?
A.2What are My
Choices? A.4 Goodbye (***) to exit A.1 Urgent Reports a. MN511 Menu Structure 4.a Confirm Region b. 511 “V2” Menu Structure 1.d Travel Times (if applicable) 2. Weather 3. Transit 1. Road Conditions Transfer to local number 3.1a Transit Info (times?) … 00. 511 Greeting (00a. Select Region)
00b. Confirm Region 0. Menu 4. Restrictions 1.b/c Roadwork Details 1.b/c Urgent Report Details Key Open Choice Menu Choice Information Exit Menu Yes/No Go to # Commands that can be accessed anytime:
A.6 Help(9 & 0)
A.0 Go to Menu
(go to 0)
A.3 Backor
Repeat A.2What are My
Choices? A.4 Goodbye (***) to exit A.1 Urgent Reports (go to 1.11e)
A.5 Select New
Region (go to 000) 0 5. New Region, Go to 00a 1.1 Select Route 1.a Confirm Route 0 0 0 1.1 0 3
Figure 1. Depiction of a) MN511, and b) 511 V2 menu structures; calls start at node 00 and proceed downward
The 511 Deployment Coalition outlines that all state-based 511 phone systems should
incorporate traffic, transit, and weather information (511 Deployment Coalition, 2005). Using these categories as guidelines, we identified the frequency of calls that access these categories of
broken down into route report, urgent report, and regional report information categories. A complete list of requirement frequencies can also be found in Table 1.
Requirement Frequencies p(req) Weather 18% Transit 3% Traffic - Urgent 11% Traffic -Route 23% Traffic -Regional 45% Traffic (all) 79%
Figure 2. Requirement frequencies of the MN511 traveler information system from April 2005 through March 2006
Adequacy (A). Not all information presented in a menu prompt may be related to a user’s query. The adequacy of information can be quantified in a number of ways (e.g., time to listen to a prompt, number of relevant bits of information) depending on the menu. For this analysis, adequacy was quantified as that the number of relevant sentences at an information node divided by the total sentences at that node. Using the menu script, the sentences at the information nodes were counted based on relevancy to a passenger vehicle driver using MN511. For example, when finding route information, relevant sentences included those pertaining to a route, while the total sentences included those pertaining to the route, truck permits, and mobile homes. The adequacy scores for MN511 and V2 are presented in the probability matrix (Table 1).
Table 1. Probability matrices for outcomes of finding information using MN511 and V2
Information p(req) A NF FI FA A NF FI FA Traffic 0.79 Route 0.23 0.92 0.77 0.02 0.21 1.00 0.77 0.00 0.23 Regional 0.45 0.37 0.55 0.28 0.17 1.00 0.55 0.00 0.45 Urgent 0.11 0.45 0.89 0.06 0.05 1.00 0.89 0.00 0.11 Transit 0.03 1.00 0.97 0.00 0.03 1.00 0.97 0.00 0.03 Weather 0.18 1.00 0.82 0.00 0.18 1.00 0.82 0.00 0.18 Outcomes MN511 V2 Outcomes
Probability Outcomes. Since no preexisting data exists on users’ understanding of the
information presented in MN511, the probability matrix was completed based on three possible outcomes. The resulting probabilities represent how likely it is that a search for each information
type will result in each outcome. First, if the user does not find the information they are looking for (NF – not find), the outcome frequency is 1 minus the requirement frequency.
NF Outcome Frequency = 1 – p(req)information type [1]
If the user can find the information but does not believe it is adequate for answering the question (IF – find, inadequate), the outcome is equal to the requirement frequency times the inadequacy of the information they found (i.e., 1 minus the adequacy score).
FI Outcome Frequency = p(req)information type * (1 – Ainformation type) [2]
If the user finds the information and it is considered adequate to answer the question (FA – find, adequate), the outcome is equal to the requirement frequency times the adequacy of the
information they found.
FA Outcome Frequency = p(req)information type * Ainformation type [3]
The resulting outcomes for MN511 and V2 are presented in the probability matrices (Table 1).
Utility Matrix
The utility of finding information for a particular information type is determined by the benefit of finding the information less the cost of searching.
Cost (C). The cost or difficulty for finding information was defined as the count of action nodes that need to be taken along the most efficient route, weighted by 0.10. The cost scores for MN511 and V2 are presented in the utility matrix (Table 1).
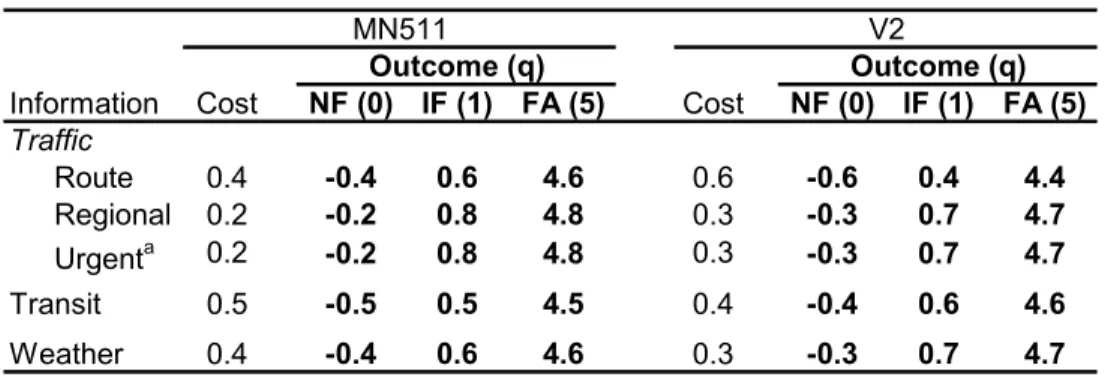
Benefit (q). The most accessible method to realize usefulness of information in the menu would be to have users rate how well their information need was met on a scale (e.g., from 1 = Not at all to 5 = Completely), which is planned for future testing. If actual data had been collected from participants using MN511, then the benefit (q) would equal this scaled subjective response. In lieu of this, we have assigned two levels of successful information location outcome, q = 1 for FI and q = 5 for FA; q = 0 was assigned for an unsuccessful search (NF). For all levels of predicted success, the utility of each information type is equal to the benefit less the cost of searching (q – C). The resulting outcomes for MN511 and V2 are presented in the utility matrices (Table 2).
RESULTS: COMPUTING VALUE
The value of meeting each goal (i.e., the likelihood of finding a useful answer to a question) can now be calculated by multiplying the probability that a particular piece of information will be found (probability outcomes) by the utility of that piece of information (utility outcome). The total value for each information type is the sum of these value outcomes for each outcome type. The resulting outcomes and total values for MN511 and V2 are shown in the value matrices (Table 3).
Table 2. Utility matrices of outcomes for finding information using MN511 and V2
Information Cost NF (0) IF (1) FA (5) Cost NF (0) IF (1) FA (5)
Traffic 0 1.00 5.00 0 1.00 5.00 Route 0.4 -0.4 0.6 4.6 0.6 -0.6 0.4 4.4 Regional 0.2 -0.2 0.8 4.8 0.3 -0.3 0.7 4.7 Urgenta 0.2 -0.2 0.8 4.8 0.3 -0.3 0.7 4.7 Transit 0.5 -0.5 0.5 4.5 0.4 -0.4 0.6 4.6 Weather 0.4 -0.4 0.6 4.6 0.3 -0.3 0.7 4.7 Outcome (q) MN511 Outcome (q) V2
a Cannot be accessed during the 00 nodes of either menu structure
Table 3. Value matrices of using current MN511 and V2 information types
Total Total
Information NF FI FA Value NF FI FA Value
Traffic Route -0.31 0.01 0.98 0.68 -0.46 0.00 1.01 0.55 Regional -0.11 0.23 0.80 0.91 -0.17 0.00 2.12 1.95 Urgent -0.18 0.05 0.24 0.11 -0.27 0.00 0.52 0.25 Transit -0.49 0.00 0.14 -0.35 -0.39 0.00 0.14 -0.25 Weather -0.33 0.00 0.83 0.50 -0.25 0.00 0.85 0.60 MN511 V2 Outcomes Outcomes
There is positive value in searching for all types of information, aside from transit information, using both menus. This suggests that overall, both menus are effective at allowing the user to find and understand the information they are searching for.
It seems that the shortcut to regional reports in MN511 (depicted with a dashed connection between nodes 00 and 2.a in Figure 1a) decreased the cost of finding this type of information, resulting in a relatively high total value. In comparison, using V2 increased the value of regional and urgent information types more dramatically due to an increase in appropriateness of the information even though the cost of finding these types of information increased. Similarly, the value of finding route information is lower when using V2 compared to MN511 because there is a higher cost involved in navigating to this information.
There was higher value for finding transit and weather information types when using the V2 menu as compared to the MN511. These trends were not due to increasing appropriateness of information, since the appropriateness stayed constant. Instead, these examples show how decreasing the cost of finding information can also add value.
DISCUSSION AND CONCLUSIONS
For many of the information types, the V2 menu structure showed improvements in the value afforded to an information-seeking user. It is therefore predicted that the proposed changes to the
MN511 menu structure present in V2 would allow for faster and more accurate traffic, transit, and weather information retrieval.
All results and stated differences were not tested for statistical significance and as such should be taken with a grain of salt. This methodology is intended to provide a tool by which designers and usability practitioners can quickly quantify comparisons between interface designs as a precursor to user testing. The value scores produced facilitate the identification of where costs and
information adequacy can be modified in order to best streamline potential menu designs. The value scores for these information types would be better serviced by results from user testing, specifically a scaled response of how useful information from the system is to answering users questions. The values above represent potential high (FA) and low (FI) values of a 5-point scaled response in order to span the full range of potential outcomes. Testing with real user responses would allow collapsing the FA and FI outcomes by using a benefit score (q) equal to mean information quality score on a subjective scale.
These results will be empirically tested in an upcoming driving simulation study in which drivers will use both systems while driving and be measured in terms of driving performance,
information retrieval, and perceived value of the information. The results will be used to further improve the current MN511 system, as well as to gain further information into how accessing a menu while driving affects driving performance. It is hoped that the amount of attention needed to process menu choices can be reduced and a higher level of attention can be paid to the road. Information derived from utility analyses can contribute to policy and design recommendations for 511, IVR, and ATIS services accessed while driving. As an addition to the assessment toolbox, this methodology could be used to evaluate the relative value or distraction of touch screen displays, voice response, or traditional knob control interface designs increasingly prevalent in the vehicle.
ACKNOWLEDGMENTS
This research was made possible by funding from Mn/DOT. Operational funds for the HumanFIRST Program are provided by the ITS Institute at the University of Minnesota.
REFERENCES
511 Deployment Coalition. (2005). 511 - America’s travel information number. Implementation and operational guidelines for 511 services. Version 3.0, September. Retrieved April 10, 2006 from http://www.deploy511.org/docs/511%20Guidelines%20Version%203.0.pdf Bond, C., & Carmac, M. (1999). Your call is important to us… please hold. Ergonomics in
Design, 7(4), 9-15.
Eby, D.W., & Vivoda, J.M. (2005). Driver hand-held cellular phone use in Minnesota, August 2005. Minnesota Department of Public Safety report. September. Retrieved April 4, 2006 from http://www.dps.state.mn.us/OTS/crashdata/2005_CellPhoneRep.pdf
International Standards Organization [ISO]. (1994). User interface to telephone-based services: Voice Messaging Applications. ISO/IEC DIS 13714. Geneva: Author.
Kelly, M.J., Stanley, L.M., & Lassacher, S. (2005). Driver performance while using a cellular telephone interface to a traveler information system. Report prepared by Western
Transportation Institute, Montana State University, for the Research and Innovative Technology Administration, USDOT, July 25.
Schumacher, R.M, Hardzinski, M.L., & Schwartz, A.L. (1995). Increasing the usability of interactive voice response systems: Research and guidelines for phone-based interfaces.