Real-Time Context-Aware Microservice
Architecture for Predictive Analytics
and Smart Decision-Making
GUADALUPE ORTIZ 1, JOSÉ ANTONIO CARAVACA 1, ALFONSO GARCÍA-DE-PRADO 1,
FRANCISCO CHÁVEZ DE LA O 2, AND JUAN BOUBETA-PUIG 1
1UCASE Software Engineering Group, School of Engineering, University of Cádiz, Puerto Real 11519, Spain 2University Centre of Merida, GEA Artificial Evolution Group, University of Extremadura, Badajoz 06800, Spain Corresponding author: Guadalupe Ortiz ([email protected])
This work was supported in part by the Spanish Ministry of Science and Innovation, in part by the European Union FEDER Funds under Grant TIN2015-65845-C3-3-R, Grant RTI2018-093608-B-C33, Grant TIN2017-85727-C4-4-P, and Grant RED2018-102654-T, in part by the Regional Government of Extremadura, and in part by the Department of Commerce and Economy, conceded by the European Regional Development Fund, ‘‘A Way to Build Europe,’’ under Grant IB16035.
ABSTRACT The impressive evolution of the Internet of Things and the great amount of data flowing through the systems provide us with an inspiring scenario for Big Data analytics and advantageous real-time context-aware predictions and smart decision-making. However, this requires a scalable system for constant streaming processing, also provided with the ability of decision-making and action taking based on the performed predictions. This paper aims at proposing a scalable architecture to provide real-time context-aware actions based on predictive streaming processing of data as an evolution of a previously provided event-driven service-oriented architecture which already permitted the context-aware detection and notification of relevant data. For this purpose, we have defined and implemented a microservice-based architecture which provides real-time context-aware actions based on predictive streaming processing of data. As a result, our architecture has been enhanced twofold: on the one hand, the architecture has been supplied with reliable predictions through the use of predictive analytics and complex event processing techniques, which permit the notification of relevant context-aware information ahead of time. On the other, it has been refactored towards a microservice architecture pattern, highly improving its maintenance and evolution. The architecture performance has been evaluated with an air quality case study.
INDEX TERMS Context awareness, context-aware services, service-oriented architecture, decision making, microservice architecture.
I. INTRODUCTION
The impressive evolution of the Internet of Things (IoT) over the last years has strongly favored the provision of information by multiple sensors and other devices connected to the Internet; not only that, all the information flowing through the Internet is considered useful and relevant for multiple domains. This way, the amount of generated data is huge. As a result, the Big Data term is coined: Big Data [1] refers to a large amount of heterogeneous data which flow along the information systems and are analyzed with the aim of improving decision-making in the domain in ques-tion [2]. However, the amount of data generated in this The associate editor coordinating the review of this manuscript and approving it for publication was Xiping Hu .
scope is so huge, and it is generated so fast, that a constant streaming processing is required so as to obtain real-time relevant information to actually improve our business decision-making.
Additionally, such an amount of useful information has fostered an interest in context-aware applications [3]. These gather user contexts in order to adapt their behavior to their users’ needs and situations. The great benefit is that context-aware applications can adapt and particularize this informa-tion to the users’ context, through smart decision-making, definitely improving user experience. Context awareness has become a fundamental requirement for software engineer-ing indeed, as highlighted by the European Union, which identifies research and development for context-aware IoT computation as an Horizon 2020 challenge [4].
Based on such a scenario, in the past we proposed
CARED-SOA (Context-Aware Event-Driven
Service-Oriented Architecture), a holistic architecture which per-mits dealing with context awareness in Service-Oriented Architecture (SOA), providing the means for context dealing from reception to delivery of personalized context-aware services [5], [6].
However, such an architecture is not enough to build a completely functional system in many predictive scopes. Moreover, there are some scenarios which require an action that cannot be taken once the situation has occurred. For instance, if the goal of the system is to prevent natural dis-asters, it is useless to make the detection when the disaster is already happening. For such scenarios, it is necessary to detect the situations in advance, that is, to be able to predict them. Predictive analytics (PA) optimizes the IoT’s value in several scopes and domains: for instance, it favors increasing productivity and efficiency of predictive maintenance in a production environment, it permits automating decisions and improves decision-making to minimize risks, avoid errors and increase revenues in several domains, it can prevent health issues and further damages due to natural disasters, and so on and so forth. However, monolithic traditional PA systems [7], [8] present several drawbacks: first of all, they are usually designed to cover a single task, therefore if the goal changes it is usually necessary to design a completely new system. Additionally, they are difficult to evolve since they focus on a specific function and changing any small feature usually means rebuilding and redeploying the whole system; besides, the system is usually highly coupled, lacking a good modular structure, thus if any system component fails it is very difficult to replace it without modifying other com-ponents. Moreover, when we need to scale any of the mod-ules, the whole system must be scaled [9]. Hence, in order to address this issue our first research question is:
RQ1: Is it possible to evolve our previously proposed
CARED-SOA architecture from real-time context-aware detection to prediction of situations of interest in the IoT by enriching the architecture with PA?
CARED-SOA is founded on an Event-Driven Service-Oriented Architecture (ED-SOA or SOA 2.0) [10] through the use of Complex Event Processing (CEP) [11] technol-ogy (see [5] for further details on CARED-SOA). There are several approaches which aim at integrating CEP with PA [12], [13]; however, one of the key challenges in this scope is to maintain reasonably efficient processing [14]. On the other hand, although some approaches have explored the potential of CEP in the scope of context-aware IoT appli-cations [15], [16], to the best of our knowledge no current approach integrates PA in such a field [17].
Thus, due to the existence of previous approaches integrat-ing CEP and PA successfully, on the one hand, and context awareness and CEP on the other, we firmly believe that we can evolve and enhance our mature CARED-SOA with context-aware predictive functionalities towards a new archi-tecture, Predictive CARED-SOA. This archiarchi-tecture, which
will be the main contribution of this paper, would permit to adapt application behavior to the context predictively and reactively, through the use of several distributed components and making use of (1) PA for predictions and (2) CEP for smart decision-making.
Indeed, CEP and PA are very different technologies: with CEP, it is possible to design automatic decision-making for situations which are currently happening, whereas PA allows us to build systems that are able to learn in time. The lat-ter are frequently used for forecast, classification or recom-mendation making. Despite the differences between these technologies, they could be considered as complementary technologies by integrating them in order to build a sys-tem with a combined functionality: a syssys-tem able to predict situations that will happen in the future and make smart context-aware decisions depending on these predictions. This way, it would be possible to have a system which responds to situations beforehand. Facing the design and implementation of such a system leads us to the second research question.
RQ2:Would it be beneficial to evolve CARED-SOA
archi-tecture to a microservices archiarchi-tecture model?
Even though the design and development of a microservice-based application has some challenges, mainly due to having multiple distributed independent components, there is no doubt about its advantages in terms of loose coupling and scalability of the architectures which these applications are able to build [18]. Particularly, having the system split into independent units of software with a clearly defined function-ality as well as being able to send messages means that such units are easy to replace, autonomously developed, indepen-dently deployable, decentralized and built and released with automated processes [9].
Given the intrinsically distributed nature of context-aware IoT systems in general, and CARED-SOA in particular, we strongly believe that evolving our architecture towards a model based on the microservice pattern would provide additional advantages to it. Even though in the scope of microservice architectures, it is often the case that each service exposes a REST Application Programming Inter-face (API) and consumes other services’ APIs, we also find asynchronous message-based communications among dif-ferent services composing the system. In our event-driven scenario, some microservices publish events and others sub-scribe to them through a message broker. This, together with the feature of deploying each microservice independently, will facilitate the architecture’s scalability, maintenance and evolution. Besides, scalability and elasticity are both key aspects in the IoT domain [19], which are definitely facili-tated when using a microservice architecture [20].
Therefore, the main contributions of this paper in rela-tion to our previously proposed architecture CARED-SOA are, on the one hand, the migration of the full monolithic architecture to a micro-service based one, with the inherent advantages just mentioned. For this purpose, it will be neces-sary to extract the context broker, the notification system and the system REST services from the monolithic architecture
to decouple them from the Enterprise Service Bus (ESB), ensuring that communications are established according to the micro-service paradigm and guaranteeing that the system continues to respond efficiently. On the other hand, the sec-ond main contribution of this paper is the ease of integrating PA into the evolved CARED-SOA, through the integration of a prediction module, adaptable to different models, without the need to adapt or modify the rest of the components of the detection architecture. This way, if we design our detection architecture in any IoT domain following this paper’s pro-posal, we can extend it with any prediction model, according to arising needs without costs of evolution for the existing architecture. It is not the aim of this paper to provide new pre-diction algorithms neither compare several PA techniques, but to provide an appropriate and efficient software architecture, which can be integrated with several PA models to improve smart decision-making in IoT domains.
To illustrate how prediction is integrated into the architec-ture and evaluate the performance of the new micro-service architecture, we extended our air quality detection and warn-ing case study to illustrate the novel CARED-SOA architec-ture, to now predict the different levels of air quality for each pollutant and location and notify users of potential health risks based on their specific context.
The rest of the paper is organized as follows. Background information is explained in Section II and Section III exam-ines related work in the literature. Afterwards, Section IV describes the proposed architecture. Then, the prediction module is detailed in Section V. Finally, performed eval-uation is presented in Section VI, the proposed architec-ture and research question findings are further discussed in Section VII, and conclusions and future work are outlined in Section VIII.
II. BACKGROUND
In this section, we introduce microservice architecture pattern as well as Big Data streaming processing.
A. MICROSERVICE ARCHITECTURE PATTERN
Microservice architecture pattern emerges as an alternative for monolithic architectures and applications [21], which are difficult to maintain and evolve due to the high coupling among their components. The mentioned pattern proposes splitting applications into small interconnected services [22]. Currently, Richardson [23] provides 44 patterns for microser-vices architecture. In the following paragraphs we summarize the key patterns for the architecture proposed in this paper.
The Microservice Architecture Core pattern is based on
the need of having a server-side, which might have several different clients and might require to expose an API for third-party consumers. Such a server side will probably have the need to integrate with other applications and require access to databases in order to develop the business logic.
The pattern proposed solution is an architecture with a set of loosely coupled collaborating services. Each ser-vice should implement an identified function of the server
application and should have access to its own database. Besides, the communications between services should be based on HTTP/REST synchronous requests or asynchronous message queueing protocols. Each service should be designed to allow independent development and deployment.
If we have followed the previously explained pattern for core microservice architecture, we will have identified and implemented a set of independent services, according to the Single Service Instance per Hostpattern.
In such a case, we can benefit from the chance of deploying them independently in different hosts with the advantage of enhancing throughput and availability.
Once we have identified and implemented a set of independent services, we will need to (1) let the clients to communicate with such services and (2) allow inter-process communication between services. These requirements can be satisfied by using theMessagingpattern.
Using message communication patterns, such as request/ reply, notifications or publish/subscribe, we will obtain a loose coupling architecture with an improved availability thanks to the use of the message broker buffer mechanism.
TheRemote Procedure Invocation (RPI)pattern is an
alter-native for both the communications between the client and the offered services and for the inter-process one.
Several RPI technologies can be used, being REST one of the more often used. The main benefit of using such a pattern is the facility for request/reply protocol implementation keep-ing the latest simple and avoidkeep-ing the need to use an inter-mediate broker. The decision between a messaging broker or an RPI will depend on the commitment of availability versus simplicity according to our project requirements.
B. BIG DATA STREAMING PROCESSING
As previously mentioned, big data produces a huge and fast amount of data, which requires a constant streaming pro-cessing. Among others, stream processing provides us with the following advantages: increasing available real-time data, extracting actionable intelligence as well as smart acting on real-time. Therefore, traditional data processing infrastruc-tures are limited to conducting real-time data processing.
There are several alternatives for big data processing, but among them Hadoop [24] has taken great relevance [25]. Apache Hadoop is an open source project that integrates a set of tools that make it ideal for working with large amounts of data. Besides, Hadoop has the ability to be distributed in a heterogeneous cluster of machines, allowing for economical use. One further advantage of Hadoop is the integration of additional tools: on the one hand,Hadoop Distributed File
System(HDFS) allows a distributed storage of information
known by all the nodes taking part of the system; on the other hand, Hadoop integratesMapReducetools that permit information parallel processing, providing the user with the ability to design their applications in different programming languages. In fact, one of the main advantage of the ecosys-tem created by Hadoop is preventing the developer from
having to code manually the tasks for information parallel processing.
In 2012, a new approach for data processing was
devel-oped under the Yet Another Resource Negotiator (YARN)
project [26]. It is the evolution ofMapReduceto a new way of working that divides the work of theJobTrackerinto two new tasks: (1) theResource Manageris in charge of resources self-management in its multiple nodes and (2) the
Appli-cation Masteris responsible for negotiating resources with
theResource Manager, regardless of the resources managed
by the Node Manager. YARN enables Hadoop to support
more varied processing approaches as well as a wider range of applications. As an example, Hadoop clusters can now run interactive queries and data application transmissions simultaneously with MapReduce batch jobs.
It is noteworthy that Hadoop was originally designed for batch data processing but not for real-time one, since it has a high latency because of read/write operations. In partic-ular, Hadoop works primarily with the disk, performing all read/write functions on HDFS, what results in a decrease in the speed for information processing. To face this lim-itation, new tools for working with real-time large vol-umes of data were made available for its integration with Hadoop, such as Storm. The Apache Storm project is a system designed to retrieve real-time data streams from multiple sources in a distributed, fault-tolerant, and highly available manner. Moreover, Hadoop can be integrated with other reliable and efficient CEP engines, as we will see in this paper.
Even more, a new platform focused on distributed in-memory data analysis in the field of data science is Apache Spark [27]. One of the main advantages of Spark is the use of Resilient Distributed Datasets (RDD). RDDs are ideal for par-allel operators of computer pipelines and are, by definition, immutable, making Spark a unique form of fault tolerance. Any work designed to be run on Hadoop can also be started up with Spark, but considering the memory requirements available on the system. Note that a job executed with Spark can be up to 100 times faster than the same job executed with Hadoop.
As described above, Apache Spark allows us to process information faster since the work is done in memory, rather than on disk. This is a noteworthy advantage in this ecosystem where the fundamental idea is the abstraction of the user from the data with which he works. Indeed, thanks to the use of the tool Spark SQL [28], we can take great advantage of Spark’s strengths and the project’s abstraction philosophy as we explain in the following lines. In a big data system, we find structured and semi-structured data, which makes it difficult to process as a whole. By using the so-called DataFrames provided by Spark SQL, the user benefits from the structured data processing logic, allowing the management of data from different sources as structured data, similarly to having them in a relational database table. Spark SQL has three main capabilities for processing structured and semi-structured data: (1)dataframeabstraction in different languages, such
as Python, Java and Scala; (2) data processing from different sources, such as JSON, Hive Tables, Cassandra; and (3) work-ing with data uswork-ing traditional SQL connectors, such as JDBC/ODBC.
Additionally, another tool used for real-time data process-ing is Apache Spark Streamprocess-ing [29]. This tool works in conjunction with Spark and provides continuous data pro-cessing capability. That way, Spark Streaming can process both real-time data from a wide range of sources (streams from message brokers, and sensors and devices connected via TCP sockets), and data stored on file systems, such as HDFS or Amazon S3. Moreover, Spark Streaming can process data using a variety of algorithms and high-level functions such
asmap,reduce,joinandwindow[30]. Even more, there are
plenty of libraries for analyzing time series data, such as Spark-TS. In particular, this library helps developer to focus on the business processes, rather than on the algorithm imple-mentation. Once processed, the data is sent to file systems (being data saved as files) or to real-time dashboards. So, the integration of Apache Hadoop together with Spark Streaming becomes a perfect candidate for applying PA algorithms in streaming processing [25].
III. RELATED WORK
The study of time series allows us to analyze a given situation or a set of situations over time. Currently, this study can be performed on a large number of IoT domains by sensing the device. The Big Data boom allows us to analyze a large amount of data, but classical techniques do not permit the analysis of such amounts of information we can generate today in the IoT, so we are forced to implement new methods of processing these data, among which are the type of data presented in this paper, the time series. The study of time series is based on models such as ARIMA, ARIMAX, Expo-nential Weighted Moving Average, Holt-Winters method, GRACH and ARGRACH. This new demand gives rise to a significant number of libraries that can be integrated into Apache Spark, such as Econometrics [31], Pandas, Mat-lab, R’s zoo and xts packages [32], ChronixDB [33] and FLINT [34], [35]. Thus, these libraries allow the analysis of time series through Apache Spark, using the classic models under the Big Data paradigm. Many researchers have used these models and libraries to solve problems in which it is necessary to analyze time series. For example, in [36] the authors study the financial problem in data from the National Stock Exchange of India (NSE) for a period of one year, using ARMA, ARIMA, ARCH and GARCH models, using Apache Spark for processing. Works such as [37] predict traffic flow through time series with Spark and in others, such as in [38], the authors work with time series related to health care data. However, most of the literature we find are limited to the analysis of time series, but do not provide an archi-tecture that integrates the entire flow of data from sending the data from the IoT to providing a result to the user or interested entity. Indeed, it is not easy to find publications that cover all areas of our proposal: CEP and streaming data, PA,
context-awareness, and microservices in the scope of the IoT. For this reason, we are going to analyze papers in which at least 2 of the most relevant technologies or domains of the article converge.
Recently, some works have been proposed in order to ben-efit from the integration of CEP and PA. Krumeich et al. [39] highlight the advantages of using CEP together with PA in the industry. Additionally, Flouriset al.[14] emphasize the efficiency of such a combination. Nevertheless, both studies are very theoretical, and they fail to propose a particular archi-tecture to combine CEP and PA. Taher and Zeitouniet al.[40] describe a framework named autoCEP, which is used to build CEP patterns in a predictive way by using time series; again, they do not present a full architecture which inte-grates CEP with PA. The same authors have extended their previous work by combining the autoCEP and the Butterfly frameworks to build a system that allows us to make early predictions of security violations during the transport of art works [41]. While predictions are made uniquely during the CEP process in that work, in our proposal predictions take place before this process, so these predictions feed the events stream income in the CEP engine, therefore enriching the decision-making process in real time. Moreover, there are other proposals that implement the integration of PA and CEP separately. Christet al. [42] implement the PA component by using conditional density estimations applied to the steel manufacturing, while Wanget al.[43] make use of Bayesian Networks and Akbaret al. [12], [44] use adaptive moving window regression, both applied to road traffic. The main difference between these approaches and our proposal is that we propose a flexible and scalable architecture distributed over multiple machines in which each component is respon-sible for a specific task. This architecture design, therefore, allows us to customize every part of the system and keep them uncoupled, facilitating the system’s maintenance and evolution. In addition, we use the Autoregressive Integrated Moving Average (ARIMA) prediction model [45], which is not used in any of the mentioned approaches. ARIMA works adequately with time series, making real-time predictions reliable.
On the other hand, there are works that make predictions based on context awareness. Xia and Tinjie [46] make use of the Hidden Markov Model to predict business informa-tion, and Zhaoet al. [47] use the same model to predict antibody-specified epitopes. In addition, Xinet al.[48] pro-pose a framework, which is based on location context and user preferences, to predict demanded services such as hotel reservations, while Chuanget al.[49] have built a method to predict learning situations. Even though all of these proposals make predictions using information from the environment, such as the location or the learning environment, none of them uses the predicted information to automatically make deci-sions or take action. Moreover, these works do not describe the physical architecture supporting the proposed method. Remarkably, these limitations are overcome in our architec-ture’s proposal.
Distributed computing of data for the IoT is yet a field with open research challenges and opportunities [50], [51]; even though many proposals focus on how to process data in the fog/edge [52], there is still a clear need for processing IoT big data streams, which cannot be dealt with in the fog [53], [54]. Isah and Zulkernine [54] propose a scalable framework for data stream ingestion that feeds the data arriv-ing at the server to Spark streamarriv-ing through the Nifi-Kafka data ingestion software and sends the processed data into the message queue for subscription by the clients. However, event prediction is not addressed in this work. While they make use of Nifi-Kafka software, we use a message broker service connected to both the microservice component for event detection and the microservice component for event prediction. On the one hand, the event detection compo-nent, through an ESB, is in charge of homogenizing raw data into a common format required by the CEP engine. On the other, the event prediction component is capable of sending prediction events to the CEP engine, through the message broker service, thus improving the decision-making process in real time. Similarly to our approach, Truong [55] proposes an architecture that makes use of a message bro-ker as the gateway between the sensor data and the predic-tive analytics module, but it only focuses on prediction and not on its combination with real-time pattern detection and is not based on a microservice architecture. In contrast to Isah and Zulkernine’s work, Truong’s architecture includes an Apache Nifi software inside the predictive analytics mod-ule and not as the gateway between sensor data and the processing module. Also, the work from Bashir et al. presents an IoT data analysis framework (IBDA) [56] which deals with the storage and analysis of real-time data generated by IoT sensors in intelligent buildings through the use of Apache Spark and Apache Flume. However, this work only focuses on detecting events of interest and does not integrate any prediction algorithm.
When focusing on microservices for the IoT, we find several relevant works. For instance, Butzinet al.[57] ana-lyze the advantages of using a microservice architecture in the field of the IoT versus a monolithic architecture and propose the most useful microservices pattern in such a scope. Also, in [58] a microservice-based approach to support service scalability, modularity, and reusability web objects in the IoT environment is proposed. The proposal from Krylovskiyet al. [59] is also of great interest, where microservice architecture is put forward as the architec-tural style to design a Smart City IoT platform. This work is still in its early stages, but they plan to include a context-awareness module and discuss the main advantages of basing the architecture in the microservice style. The work from Sunet al. [60] also deserves a special mention. They propose a new microservice IoT framework that improves features from other existing ones; we can highlight they contemplate the inclusion of a machine learning and artifi-cial intelligence module in the proposed framework, but the proposal is still in the early stages of design.
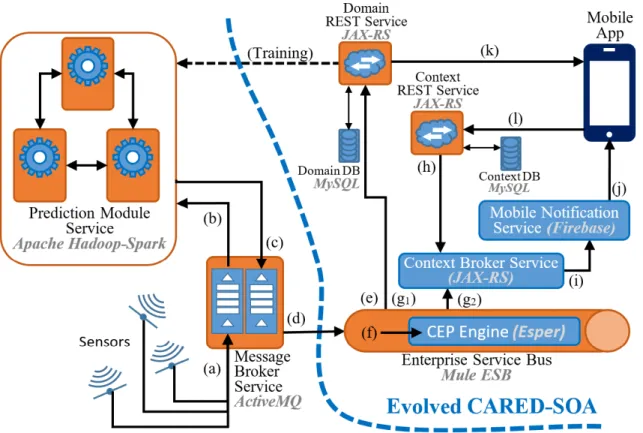
FIGURE 1. Predictive CARED-SOA architecture.
Therefore, we can wrap up this section with two main conclusions: on the one hand, the topic we are dealing with in this paper is of great interest and there are several approaches that tackle it from different perspectives, although these are incomplete from our point of view as they do not contemplate the basic axes of our proposal in an all-in-one solution — event pattern detection, real time prediction, context aware-ness and a microservices architecture— with the advantages that these entail. On the other hand, most of the existing proposals are at an incipient stage of development, remaining in most cases at the architecture design stage; not surprisingly, Roda et al. report the lack of empirical evaluation in existing proposals for microservice architectures [17], which we do face in this article.
IV. ARCHITECTURE
In this section, we describe the architecture proposed to face the previously motivated challenge and research questions.
A. ARCHITECTURE REQUIREMENTS
In order to build a real-time context-aware microservice architecture for smart PA, the following essential architec-tural requirements and functionalities must be fulfilled:
1. Being able to process a huge amount of heterogeneous data very fast in order to make useful predictions in time.
2. Facilitating the detection of potentially dangerous sit-uations for a particular domain depending on these predictions.
3. Providing a way to automatically make smart decisions and send alert notifications to end users.
Designing the architecture in a distributed way to make it scalable, extensible, maintainable and reusable.
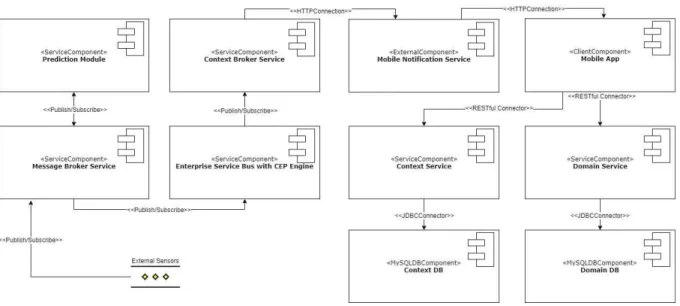
B. ARCHITECTURE COMPONENTS AND MICROSERVICES We propose a decoupled and reusable architecture based on the microservice architecture pattern that fulfils all the estab-lished requirements [61]. It is noteworthy that while small services are preferable, we always have to bear in mind that the main purpose is to decompose the architecture to facilitate its development and deployment, and the grain of the services might be finer or grosser depending on the architecture spe-cific requirements [22]. This architecture is composed of the following independent services and additional components (see Figure 1):
1. Sensors. There are several domain-specific physical or virtual sensors in different locations (virtual sensors are data sources for a particular domain, even though they do come directly from a physical sensor). The measurements provided by the sensors are sent to a message queue in a message broker located in a ded-icated server, so that such measurements can feed the prediction algorithm.
2. Message Broker Service. Message brokers implement an asynchronous mechanism which allows source and target messages to be completely decoupled, as well as allowing the messages to be stored in the broker until they can be processed by the target element.
These brokers may use standard message queues or be combined with a publish/subscribe mechanism. In our architecture, we implemented a publish/subscribe mechanism with 2 subscribers: a prediction module and an ESB, both of which will be later explained. Sharing the data by using a message broker microservice allows us to easily include and remove components in a decou-pled way, without forcing the data provider to have to adapt to different communication protocols or data format depending on whether the data will be used for detection and/or prediction. This way, we have a single entry to the system, simplifying the submission of data to it and its integration with possible new modules which might be added depending on arising needs. 3. Domain Database. The domain database provides
his-torical data of sensor measurements, values for made predictions and values for detected complex events. 4. Context Database. The context database stores
infor-mation about users and their contexts and subscrip-tions, as well as recommendations according to the domain and contexts.
5. Domain REST Service. The domain REST service provides an API. In particular, this API facilitates accessing to information such as current, predicted or historical sensed values. The domain REST service accesses the domain database.
6. Context REST Service. The context REST service provides an API which users can use to interact with the system. The REST service makes recommenda-tions according to the domain and context. The context REST service accesses the context database. This way, when the user fills in his/her personal data and/or the app detects the location or physical activity, such con-text information is submitted to the server-side through a request to the context REST service, transparently to the user. Further details on such a service and the types of contexts dealt with by it can be found at [6]. Simi-larly, when an alert is detected on the server, a request is made to the context service to provide the user with the most appropriate recommendations based on such an alert, depending on the user context.
7. Prediction Module Service.This is one of the most important components of the architecture. This service is in charge of analyzing the data received from the sen-sors through the message queue and processing them to predict future data. It stores and obtains informa-tion from the domain database, through the domain service, to read the historical data stored in order to enrich the model. It is also connected to the message broker service to receive the streaming data from the sensors in real time, then it uses these data to build the prediction model. In the case study proposed in this paper, we have implemented and tested the archi-tecture with an ARIMA prediction model, since it is a suitable model for time series as is the case here. Once predictions are obtained, they are submitted to
a second message queue to which the ESB is also subscribed. This module and the ARIMA prediction model are further explained in Section V. As we can see in Figure 1, the remaining elements were part of our CARED-SOA architecture. We briefly describe them below; further details can be found at [5].
8. Enterprise Service Bus. In CARED-SOA, the ESB processes the information received from the sensors in order to detect situations of interest. In this work, the ESB also receives the data predicted in the predic-tion module through subscribing to the corresponding message queue. The data in the ESB follows the same process as in CARED-SOA: data are transformed in the required format, stored in the database, processed by the CEP engine and, in case of alert detection, notified to the user through a mobile notification.
9. CEP Engine. By using CEP, we can analyze and cor-relate huge amounts of data which flow through infor-mation systems in real time. Through the definition of event patterns, we specify the conditions to be met in order to detect situations of interest for a particular domain based on some input data events.
10. Context Broker Service. The context broker service, based on the alerts detected in the ESB and the con-text information available in the concon-text database, will determine which notifications are to be sent to reg-istered users. The context broker service is separated from the Context Rest Service to facilitate its extension to provide notifications to other services, not only to Firebase, such as a dashboard and an actuator. Further details about the context broker can be found at [5]. 11. Mobile Notification Service. A notification service is
invoked in order to alert users subscribed through a mobile notification.
12. Mobile App. We have implemented a mobile client with a twofold functionality: firstly, the user can check current sensed data or other relevant domain data, such as domain recommendations depending of the user’s personal context, etcetera, through the invoca-tion of the domain REST service from the app. Sec-ondly, they can receive context-aware detected domain alerts in form of notifications, as well as predicted ones.
Regarding the particular technologies, we have imple-mented the system using ActiveMQ message broker, MySQL database, JAX-RS REST services deployed in an Apache Tomcat server, Apache Hadoop and Apache Spark for the prediction module, Mule ESB, Esper CEP engine, Firebase Notification Service and Android mobile application. Thus, Apache Spark —used for predictive analytics— and Esper CEP —for real time pattern detection— are complementary. C. COMPONENT INTEGRATION AND COMMUNICATION Please note that for the prediction module to make accurate predictions it is necessary to train the PA model. If we do not have domain real data in advance, the module has to be
trained for a period of time with the domain data reaching the architecture in real time; however, if we have historical data from the domain in question, we can train the prediction module in advance and have it ready to predict from the system start-up. This is why we represented the connection of the prediction module with the database service with a dotted line in Figure 1, since it reads the historical data once in order to enrich the model. If there are enough data to train the model, it is trained, otherwise it will be trainer later. When this step is completed, the prediction module subscribes to the message queue where the sensors are sending current sensed data. At the same time, the ESB subscribes to the message queue where the predicted data will be sent, and the CEP engine registers the defined patterns to be detected. Then, the system remains waiting for the inputs and the following steps, identified in Figure 1, are executed:
a) Once the system is started, data from the sensor measurements are constantly received in the message queue.
b) Then, the prediction module (see Section V), which is connected in streaming to the message queue, receives the data immediately and the system starts to make predictions.
c) When the system makes a prediction, it sends predicted data to a second message queue.
d) The ESB connected to the message broker receives the data immediately from both message queues (our focus in this paper is on the predicted data message queue). e) Such data are sent to the database server for inclusion
in the historical database with predictions.
f) The data are transformed into the appropriate event for-mat to be processed by the CEP engine and submitted to the mentioned engine. The CEP engine processes such data and detects if any of the complex events described by the implemented patterns is triggered.
g) When an alert pattern is detected, it is both (g1) stored through the domain server in the domain database and (g2) sent to the context broker service.
h) Once the context broker receives an alert from the ESB, it checks in the context database, through the context REST service, which notifications have to be sent according to the alert and user contexts.
i) With such information, a notification is created and posted from the context broker to the mobile notifica-tion service.
j) The mobile notification service sends the correspond-ing notifications, to the system’s registered users with the mobile app installed in their devices.
At any time, in parallel, the REST public services can be invoked from the mobile app or from other clients
k) To allow users to know domain values and
l) To subscribe to several topics in order to receive noti-fications informing users about values and predictions for the domain in question, when appropriate.
Let us remember that this architecture is an evolution and enhancement of CARED-SOA [5]. CARED-SOA receives
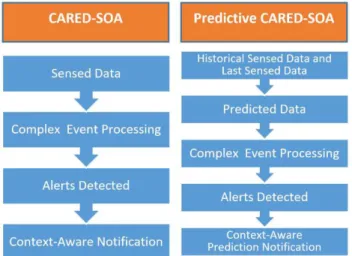
FIGURE 2. Comparison of CARED-SOA and predictive CARED-SOA.
sensing data, can detect alerts in real time by using the CEP technology, and is able to send context-aware notifications as shown in the left-hand side of Figure 2. However, Predictive CARED-SOA receives sensing and historical data, thanks to which it can predict future data by using PA. Then, based on several predicted future data, it can predict more complex alerts by using CEP and finally notify context-aware predic-tions, as shown in the right-hand side of Figure 2.
V. PREDICTION MODULE
In this section, we will firstly explain the internal logical architecture of the prediction module and secondly the PA model used for the predictions.
A. PREDICTION MODULE ARCHITECTURE AND TECHNOLOGIES
The prediction module has to be fast enough to make the predictions in real time, as well as being scalable and fault-tolerant. For these reasons, we decided to implement the module in a distributed way by using the following two frameworks: Hadoop [24] and Spark [27] with Spark Streaming [29].
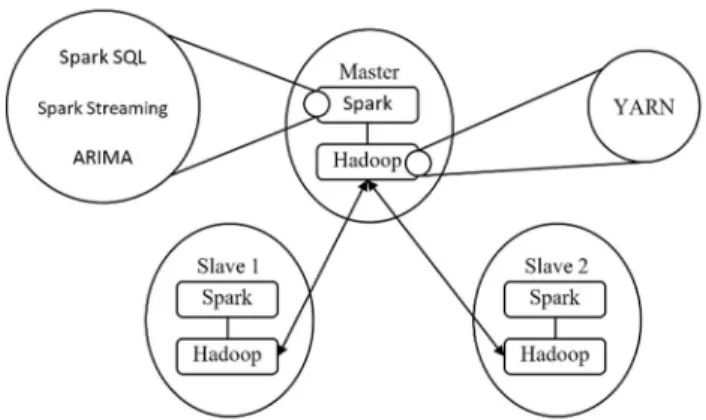
Figure 3 shows a diagram describing how Hadoop and Spark work together in the system through the master-slave paradigm. While Hadoop offers many features for distributed systems, we essentially used one of them: YARN for resource distribution (memory assignation and permission manage-ment); HDFS was not necessary in this case since we kept all the data in memory. To summarize, Hadoop has been used to build the base of the distributed system, controlling the resources and facilitating communications between the master node and the slave ones.
Spark is the executor that processes the different tasks in the distributed system, i.e. it is in charge of database readings making use of SparkSQL, of message queues connections using Spark Streaming and of data processing such as training of the learning model and predictions with Spark TS [62].
FIGURE 3. Prediction module architecture.
Although Hadoop has its own executors, we decided to use Spark because, as previously explained, it provides additional useful tools [63] and its processing speed is higher than with Hadoop alone [64], [65].
B. PREDICTION MODEL
Depending on the particular application domain, different prediction models can be more or less efficient. In order to check how the system behaved, we focused on an extension of the specific case study presented in [5] with CARED-SOA. This case study deals with detecting air quality alerts based on pollutant measurements. As explained in [5], [6], the alerts are based on the different pollutant concentration levels: each pollutant concentration, depending on the measured value, is classified into different levels depending on the reference index used (for instance, good, moderate, unhealthy and very unhealthy, according to the Andalusian local government index [66]). The case study has been extended by predict-ing the different levels for the most relevant pollutants and notifying users of the expected air quality levels which are dangerous to their health based on their particular context.
In particular, we used the measurements taken by the Andalusian local government’s air sensor network. Every net-work station may measure more or fewer pollutants depend-ing on the particularities of the geographical area where the station in question is located. We will only focus on the most common pollutants Carbon Monoxide (CO), Nitrogen Dioxide (NO2), Ozone (O3), Particulate Matters (PM2,5and PM10) and Sulphur Dioxide (SO2), even though the sys-tem can be extended with further pollutants at any time. The Andalusian regional government provides us with an on-demand service to receive the whole region’s air pollu-tant sensing data in our dedicated server every 10 minutes, which we redirect to the message queue service. Further details on air quality measurement and classification can be found at [67].
Therefore, the system’s input data are several pollutant values measured every ten minutes; that means the system works with time series; a time series is a sequence of data taken at successive, equally spaced points in time.
There are several different models that can work with time series for forecasting, as mentioned in Section III. In this paper, the model used for the predictions is ARIMA [68], a PA model which works appropriately with time series. ARIMA is composed of three different models that work together in order to make very reliable predictions: autoregression, integration and moving average. The main benefit of using ARIMA is the model’s flexibility. However, ARIMA does not work properly with non-stationary time series. This is not a limitation to our work, since the presence of the pol-lutants analyzed by the system is stationary. In particular, to measure the seasonality of the data, the Augmented Dickey-Fuller Test [69]was used; this test returns the so-called p-value. When very low values are obtained, less than 0.05, we conclude that the data are stationary, which is our case.
1) AR: AUTOREGRESSION
An autoregressive model describes a process in which every observation is predictable using the previous observations in time. The most basic scenario would be using only the last observation; in this case, the observationOt could be
calculated from the observationOt−1 and a constant C, as shown in (1):
Ot =X1·Ot−1+C (1)
In a generic formula, using p order is described by using (2):
Ot =X1·Ot−1+X2·Ot−2+. . .+Xp·Ot−p+C (2)
2) I: INTEGRATION
The integration part works with the stationarity of the time series which is being analyzed. Stationarity can be defined as the variation of the distribution of the time series. It allows us to detect if the sequence is cyclic or contains loops. Stationarity in a range of the sequence from instantt-k to instantt can be calculated as the division of the covariance of both observations by the square root of the product of both variances; as shown in (3):
COV(Ot,Ot−k)
√
VAR(Ot)·VAR(Ot−k)
(3)
3) MA: MOVING AVERAGE
The moving average models allow us to predict the value of an observation in an instant from a random variable and the random variables of the previous observations. These models are used to minimize other models’ errors due to unexpected situations. As with the autoregressive models, by using only the last observation, we could predict the observation Ot,
using the random variablesAtandAt−1, as shown in (4):
Ot =At−V1·At−1 (4)
In general, when usingpobservations the formula is as in (5):
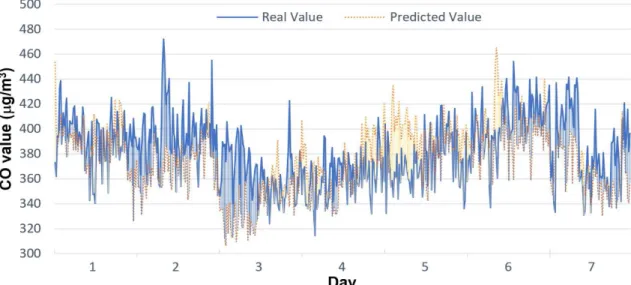
FIGURE 4. CO real and predicted values for a given week.
VI. EVALUATION
Since former CARED-SOA performance (without predic-tion) has already been evaluated in [5], [16], in this section, first of all we pay special attention to evaluating the accu-racy of the prediction model used in the prediction module and, then, the prediction module and the full architecture — Predictive CARED-SOA— performance, separately.
A. PREDICTION MODULE ARCHITECTURE AND TECHNOLOGIES
As previously explained, we have implemented the archi-tecture in Figure 1 for the air quality case study and the ARIMA model has provided us, in the prediction module (see Figure 3), with the predictions for CO, NO2, O3, PM2.5, PM10and SO2pollutant values for all the Andalusian stations for the coming 24 hours. With our enhanced architecture we predict the expected levels of air quality for each pollutant and location, and users are warned in advance depending on their context.
In this sub-section, we focus on evaluating the accuracy of the prediction module. Following well-known Kohavi’s recommendation we have used a 10-fold cross-validation technique [53] due to the method’s stability. In particular, a collection of data composed by 118370 registers provided by the Andalusian local government from 2014/01/01 to 2016/03/31 was used in the cross-validation technique [53] using 70% of data for training and the remaining 30% for validation purposes. Besides, in order to calculate the most suitable window size for ARIMA history, the error has been calculated for windows between 1 and 14 days, with 144 sam-ples per day for each gas, and in each case we have selected the window with a lower error. The selected windows have been included in Table 1.
Table 1 shows the prediction absolute error obtained after testing the system for each pollutant, as well as the value
TABLE 1.Prediction absolute error and range values of each pollutant.
range which the pollutant can take and the standard deviation of the prediction made. We can observe significant differ-ences between the errors, since each pollutant has a different value range. As an example, CO has a wide range with a minimum registered value of 41 and a maximum of 1541, whereas SO2 has a small one with a minimum value of 0 and a maximum of 17. Of course, the error does not only depend on the range value, but having taken it into account, we can consider the errors are low enough to regard the predictions as valid. Further error metrics have been calculated and included in Appendix. Section A.
In addition, Figure 4 depicts a chart showing CO predic-tions (continuous line) for a particular station —Mazagon— for seven days in a week against the real values (dotted line) of the same pollutant in the same week. We have included blue/dark shadow when the real value is higher than the predicted one, and orange/light shadow when the predicted value is higher than the real one. We can check that both the real and the predicted values follow the same pattern. Even though there are some differences (for instance from day 4th to 6th in Figure 4), the error is not large enough to make a false prediction alert, since most of the predicted levels for every pollutant (good, moderate, unhealthy and very unhealthy) matched the actual levels at which the measured concentra-tions were categorized; therefore, the predicconcentra-tions are accurate
enough to be taken into consideration. In addition, over a period of 2 months we monitored the actual and predicted data measured for pollutants CO, NO2, O3, PM2.5, PM10and SO2in the city of Mazagon (Andalucía, Spain).1We selected Mazagon because it provides measurements for the 6 pollu-tants and it has variability in the levels reached within the said 2 months. Although it does not provide 144 samples per day, there are enough daily samples. From these data we have checked the actual and predicted level of air quality for each pollutant according to the Andalusian government index [66] (see Table 6 in Appendix. Section B): the results
have been particularly good for pollutants CO and NO2
(100% success) and perhaps not so good for O3, PM2.5, SO2 and PM10 (48.64 to 93.81 % success). Further analysis on the predictions can be found in Appendix. Section B. It is important to remember that in this paper we are not trying to provide the best prediction model for air quality, but a software architecture in which we could replace our model with any other without requiring further changes to the rest of the architecture. There are already many studies that compare different prediction models appropriate for air quality that can be taken as reference to choose the most suitable one in each case, such as the one proposed in [70].
Therefore, now the user can not only receive context-aware alerts about current air quality values on his/her mobile device, but also reliable context-aware predictions of air qual-ity alerts. This way, the user can plan in advance his/her daily activities based on the predicted air quality alerts for his/her particular context.
B. PREDICTION MODULE PERFORMANCE EVALUATION In addition to the prediction accuracy evaluation, we have conducted a performance evaluation of the prediction module isolated.
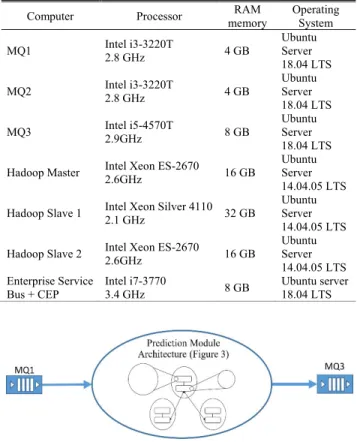
We have tested the performance with two configurations. In both configurations we have simulated synthetic data with nITROGEN [71], an Internet of Things RandOm GENera-tor, which permits fast generation of heterogeneous data in multiple formats and submits it to several target protocols as soon as they are generated. In particular, we have generated the same data used in the described case study together with the prediction model in Section V.B (air quality data). Every message is composed of the information of the station (iden-tifier, data about the location and measurement timestamp) and different values for every of the 6 relevant pollutants (identifier, value, unit and validation codes), and is sent to the corresponding Active MQ message queue. The features of all the machines used in such configurations are specified in Table 2, which also includes the features of the machines needed for the evaluation in Section VI.C.
The difference between both configured performance tests is that, in the first one (see Figure 5), we have a unique incom-ing message queue and, in the second one (see Figure 6), there are two incoming message queues (to double the 1Such data can be accessed at http://dx.doi.org/10.17632/4y586x9bhv.1.
TABLE 2.Features of the machines used in the performance evaluation.
FIGURE 5.Configuration 1 for prediction module performance evaluation.
FIGURE 6.Configuration 2 for prediction module performance evaluation.
incoming messages to the predictive module). As shown in Figure 5, the prediction module, subscribed to the message queue MQ1, processes the messages received from this queue and sends the results to MQ3 (MQ2 is not used in this configuration).
The performance tests have been carried out preloading the queue with a series of messages to discard the time of arrival of the messages in the queue and focus on module’s pro-cessing time. Therefore, MQ1 queue has been preloaded with 1 000, 5 000, 10 000, 20 000, 50 000 and 100 000 incoming messages in successive tests. Such messages consist of JSON data including 13 simple fields with information about the pollutant station as well as timestamp fields used to manage system response time measurements and a nested JSON field with information about all the pollutants, 5 fields per pollu-tant. The average size per message is almost 1Kb. We have to bear in mind that such processing time includes (1) reading
the messages reaching the queue, (2) parsing the JSON, (3) splitting every pollutant to be processed separately — each message is split into 6 different events—, (4) introducing each pollutant value in the corresponding temporal series, (5) introducing each temporal series into the ARIMA model processing, (6) creating a new JSON object with the predicted data for the 6 pollutants, and (7) sending the JSON object to the MQ3 queue.
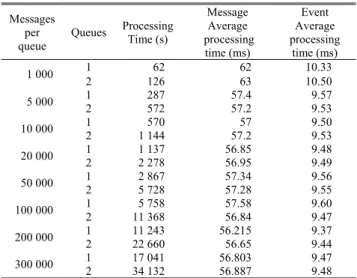
TABLE 3. Prediction module performance results for configuration 1 and 2.
We also used a second configuration in our set of tests to ensure the scalability of the system: both MQ1 and MQ2 were used for sending messages in parallel to the prediction mod-ule (see Figure 6). Again, we preloaded both queues with a fixed number of messages, and checked how much time the prediction module needs to process them, from message reception —previously explained step (1)— to predictions submission to MQ3 —previously explained step (7)—. The system test was performed with 1 000, 5 000, 10 000, 20 000, 50 000 and 100 000 incoming messages with the two incom-ing queues in parallel. The results of both configurations, shown in Table 3 and simplified in Figure 7, provide really successful performance figures. Let us explain the data shown in the table: when we send 1 000 messages from a queue, we are able to process those 1 000 messages in 62 seconds, so each message is processed on average in 62 ms. Since each message is composed of 6 events, each relating to 6 different pollutants which are split for separate processing, each of these events requires an average of 10.33 ms for being processed. When we have 2 queues sending in parallel 1 000 messages to the system from each of them, the system is able to process the 2 000 messages in 126 seconds, which translates into an average of 63 seconds per message and 10.50 ms per event. Thus, as we can see in Figure 7 and Table 3, the average time for processing every message is under 0.06 seconds and, for each separate event, 0.01 sec-onds when receiving inputs of up to 300 000 messages (1 800 000 events, for this case study). So even if we double
FIGURE 7. Message average processing time in the prediction module for configuration 1 and 2.
the number of incoming messages per second by sending them in parallel from 2 queues, the message processing time remains the same.
C. PREDICTIVE CARED-SOA PERFORMANCE EVALUATION Once confirmed that the prediction module is working suit-ably in terms of functionality and performance, we proceed to evaluate the performance for the entire architecture. Bear in mind that the only added complexity is due to the predic-tion system training, which has been done in a distributed framework to reduce the computational costs. As previously mentioned, CARED-SOA architecture’s performance (with-out prediction and based on a more monolithic architec-tural model) was already evaluated in [5], [16]. Assuming that an architecture based on microservices will be highly scalable, the main focus of this subsection is to check that the proposed architecture is reasonably efficient for a set of mid-range machines (which could always be better) and a reasonable number of events for an IoT domain. To avoid overloading a mobile with a high number of notifications, as in [5], we have avoided making mobile notifications for intensive performance tests, but emulated them sending final notifications of interest to a message queue since there is no significant difference between sending the notification one way or the other. We proceed again to test the system’s perfor-mance with 2 configurations, using one entrance queue and two entrance queues for configurations 1 and 2 respectively (see Figures 8 and 9, respectively). Please note that now the evaluated processing time includes not only the prediction stage, but also the detection stage, from the moment the data is read at MQ1 until it reaches MQ3.
For the performance tests we have employed the worksta-tions previously specified in Table 2.
The results of both configurations, shown in Table 4 and simplified in Figure 10, once again show successful perfor-mance results: the average time for processing every message is still under 0.06 seconds and, for every separate event, 0.01 seconds when receiving inputs of up to 300 000 mes-sages (1 800 000 events, for this case study). As expected,
FIGURE 8. Configuration 1 for Predictive CARED-SOA performance evaluation.
FIGURE 9. Configuration 2 for Predictive CARED-SOA performance evaluation.
FIGURE 10. Message average processing time in predictive CARED-SOA for configuration 1 and 2.
according to our previous performance results with CARED-SOA [5], the use of CEP for analyzing the incoming data is an efficient solution.
As a result, we can affirm that our system provides an appropriate performance and is highly scalable. Indeed, Hadoop is a highly scalable and reliable architecture pre-pared to be distributed in several machines and able to process large data sets. We can, therefore, conclude that a microservice-based architecture pattern, used in conjunction with Hadoop, Spark Streaming and additional queues and components, is essential to ensure the system’s scalability and elasticity.
VII. DISCUSSION
This section discusses the main contributions of the paper in relation to the research questions stated in Section I.
TABLE 4.Predictive CARED-SOA performance results for configuration 1 and 2.
RQ1: Is it possible to evolve our previously proposed
CARED-SOA architecture from real-time context-aware detection to prediction of situations of interest in the IoT by enriching the architecture with PA?
We can definitely say that our approach has improved CARED-SOA through the inclusion of a PA technique in the architecture. As previously explained, the ARIMA model has been implemented in the case study as a PA solu-tion, but it could be replaced by other models. Indeed, our previously proposed CARED-SOA architecture focused on context-aware data processing related to the IoT will be able to offer greater functionality and cover a wider field of application through the inclusion of PA and the possibility of offering predictions. Furthermore, since the inclusion of PA techniques in the architecture has been integrated with CEP, the architecture allows us to provide predictions of events of interest in real time, as we not only predict specific data in a field of application, but also the situations of interest that those data would imply in the domain in question if the prediction was fulfilled. On the other hand, given that the system notifies such predicted situations at the very moment they are predicted, it allows us to act before such situations occur and prevent undesirable scenarios. Last but not least, the fact that the prediction module is decoupled from the remaining modules and that its communication with the rest of the architecture is carried out through weak coupling communication techniques such as REST communications and/or through a publish/subscribe protocol permits chang-ing not only the most appropriate algorithm for prediction according to the application domain, but also the complete module when necessary. Let us reiterate that CARED-SOA can process diverse context information. In this case study, only the location of the air quality sensors remains relevant, but more details about other types of context can be found at [5], [6], [16].
In addition, the evaluation of the prediction module’s performance, as well as of the prediction architecture as
FIGURE 11. Predictive CARED-SOA Microservice decomposition component model. a whole, show that the architecture achieves more than
acceptable performance results for the context-aware data processing environment in the Internet of Things: note that the architecture processed 9 events per ms when receiving 300 000 messages (1 800 000 events) and we improved our previous performance rate for CARED-SOA, as explained in Section VI.C. Thus, we can affirm that decision-making is facilitated in this field, in real time and efficiently.
RQ2:Would it be beneficial to evolve CARED-SOA
archi-tecture to a microservices archiarchi-tecture model?
We have undoubtedly explained the benefits of evolv-ing CARED-SOA to Predictive CARED-SOA through the use of a microservice architecture; in the following para-graphs we further discuss the software architecture pattern implemented through assessing the conformance of the pro-posed architecture to microservice decomposition patterns to show up the main benefits. According to [21], two main issues are to be taken into account: (1) constrains based
on independent deployments and (2) constrains based on
shared dependencies. To clarify the architecture assessment, we have represented in Figure 11 the microservice decom-position component model of the proposed architecture in Figure 5.
On the one hand, only loosely coupled interfaces are allowed to be used for communications among components, as stated by Zdun et al. [21]: ‘‘From the viewpoint of an architecture decomposition model, independently deployable means that no components that are part of a microservice have in-memory connectors (or subclasses thereof or similar strongly coupled connectors) to other components that are part of that microservice’’. Indeed, our architecture’s compo-nents are deployable independently and deployed in differ-ent hosts, benefiting fromSingle Service Instance per Host pattern advantages. These advantages include: not conflict-ing resources allocation, avoidconflict-ing dependency versions and
easy monitoring, management, evolution and redeployment of each service instance.
On the other hand, according to [21] decomposi-tions should ‘‘avoid sharing other components or sharing
them in a strongly coupled fashion’’. So, our
architec-ture supports loosely coupled connectors such as event-driven, publish/subscribe interactions and message queuing. Additionally, our architecture benefits from the advantages of
theMessagingpattern: loose coupling, improved availability
and a choice of protocols to be used in the communications. As well as by the definition in theMicroservice Architecture
Core Pattern, HTTP resource API requests are considered
lightweight and simple communication mechanisms, follow-ing theRemote Procedure Invocationpattern.
As it can be seen in Figure 11, all the communications between the different system components are based on REST-ful and publish/subscribe connectors. Moreover, each service has its own database (with the JDBC connector), thus keeping decoupled from other services, and an API Gateway is not mandatory. With the aim of fostering loose coupling and reusability, we preferred to keep access to domain and to context services independently. Finally, the communication with external components and elements is also based on HTTP loosely coupled connections and publish/subscribe messaging. This provides additional benefits, as explained by Richarson in [23]:
• Keeping each function located in a microservice easy and speed the service development and deployment.
• Continuous application delivery and deployment are
facilitated, thanks to the use of small and independent services.
• Maintenance is improved by using small and
inde-pendent services, which facilitate fault isolation and scalability.
• Application evolution is addressed since we avoid
we can replace services independently with a new tech-nology stack, should it be necessary.
VIII. CONCLUSION
In this paper, we have presented a microservices-based context aware architecture which provides smart real-time predictions and context-aware notifications based on users’ subscriptions. Therefore, users can now be notified of rele-vant information beforehand and they can act in advance to prevent undesirable situations. The proposal goes one step beyond the state of the art, providing the full architectural implementation for a real scenario and its empirical evalu-ation. In particular, we tested the system with an air quality case study, predicting the different levels for the most relevant pollutants and notifying users of the expected air quality lev-els dangerous to their health based on their particular context; we also evaluated the prediction’s accuracy as well as the performance of the proposed architecture for a noteworthy number of incoming data.
In our future work we expect to test our system in sev-eral domains with different prediction models, benefiting from the evolution advantages derived from having used a microservice architecture pattern. In particular, we are cur-rently working in two new domains: in the domain of allergic diseases [72] as well as in the field of water supply efficient management, the latest being one of the key challenges for the European Commission in the Horizon 2020 program [73] and expected to be dealt with in future research lines in the scope of sustainable smart cities [74], [75]. Besides, we are also working on the implementation of a catalogue of services that will permit the selection and automatic integration into the proposed architecture of the most appropriate service, accord-ing to the type of input data, as well as the preferred protocol for communication through a publish/subscribe mechanism.
APPENDIX
A. FORECAST METRICS AND RESULTS
We have measured the errors for each of the pollutants according to the eight metrics specified in [70], which are defined in Table 5 and whose equation can be found in [70]. For this purpose, we used historical data for all the stations provided by the Andalusian government over a period of 2 years. The results of the evaluated metrics for each pollutant are shown in Table 6.
B. LEVELS
To evaluate how accurate the predictions were in accordance to the number of hits on the alert level for each of the pollutants, we evaluated whether the pollutants’ predicted levels for a given air sensor station matched the actual level at that station over a period of two months. In particular, we evaluated the predicted levels for June and July 2019 in Mazagon (Spain), using the initial days of June for training the algorithm according to the windows in Table 1 (all the details about obtained values from the link can be seen in footnote 1). The levels, according to the Andalusian local
TABLE 5.Metrics used to evaluate the difference between forecast and actual pollutant values [70].
TABLE 6.Results for the case study metrics evaluation.
government index [66], are shown in Table 7. The percentages of success per pollutant are shown in Table 8. As we can see in it, we have obtained very good results for CO and NO2; the

![TABLE 5. Metrics used to evaluate the difference between forecast and actual pollutant values [70].](https://thumb-us.123doks.com/thumbv2/123dok_us/1369701.2683410/15.864.445.806.142.279/table-metrics-evaluate-difference-forecast-actual-pollutant-values.webp)
![TABLE 7. Andalusian government pollutant concentration levels [66].](https://thumb-us.123doks.com/thumbv2/123dok_us/1369701.2683410/16.864.54.413.127.476/table-andalusian-government-pollutant-concentration-levels.webp)