Cloud Based Processing of Real Time
Sensor-Data Streams
Paul Lapok
Submitted in partial fulfilment of
the requirements of Edinburgh Napier University for the Degree of
Master of Science
18t h Aug 2014 School of Computing Edinburgh Napier University
A u t h o r s h i p D e c l a r a t i o n
Authorship Declaration
I, Paul Lapok, confirm that this dissertation and the work presented in it are my own achievement.
Where I have consulted the published work of others this is always clearly attributed; Where I have quoted from the work of others the source is always given. With the exception of such quotations this dissertation is entirely my own work;
I have acknowledged all main sources of help;
If my research follows on from previous work or is part of a larger collaborative research project I have made clear exactly what was done by others and what I have contributed myself;
I have read and understand the penalties associated with Academic Misconduct. I also confirm that I have obtained informed consent from all people I have involved in the work in this dissertation following the School's ethical guidelines
Signed:
Date: 18.08.2014
D a t a P r o t e c t i o n D e c l a r a t i o n
Data Protection Declaration
Under the 1998 Data Protection Act, The University cannot disclose your grade to an unauthorised person. However, other students benefit from studying dissertations that have their grades attached.
The University may make this dissertation, with indicative grade, available to others.
A b s t r a c t
Abstract
The aim of the project is to design an architecture for real time sensor data streaming, management and live visualisation over the web to contribute to existing research in the field of the Web of Things. The project will investigate the infrastructure between streaming hardware and website. Typical hardware would be programmable, equipped with sensors or the ability to connect up sensors and a possibility to communicate over the internet, e.g. an Arduino board, Raspberry Pi or also a smartphone.
This project focuses on the universality and manageability of the system to allow many users to deploy the sensing data over a web portal and consume the data on their own websites or allow others to integrate the data into third party websites. The requirements for a universal and manageable streaming service will be developed by investigation of existing systems and analysis of use cases in different application areas.
The operational capability of the architecture was investigated by implementing key features and experiments. The project identified the strength and weaknesses of the architecture and investigated the feasibility of the concept. A basic prototype was developed and tested. The feasibility of several parts of the system was proved by implementations and tests. Visualisation possibilities, security and processes were investigated. System requirements for different application areas were defined. System limits were investigated such as the relation between the streamed amount of sensor values and visualisation update rate, the accuracy of the system with high visualisation update rates and the limits of creating streaming instances as a bottleneck. The experiments and tests defined the limits and gave statements about the system performance, security and feasibility.
Keywords: Sensor Streaming, Real Time, Web Service, Cloud Computing, Node.js, HTML5, WebSockets, Internet of Things, Web of Things
L i s t o f C o n t e n t
List of Content
1. Introduction ... 13 2. Literature Review ... 15 2.1. Sensor Streaming... 15 2.2. Sensor Technologies... 172.3. Sensor Streaming Area ... 18
2.4. Architecture ... 20
2.5. Web Technologies... 22
2.6. Conclusion ... 24
3. Requirement Analysis ... 25
3.1. Requirement definition ... 25
3.2. Review of Example Application Areas ... 29
3.3. List of Requirements ... 31
4. Proposed System Architecture ... 34
4.1. Overview ... 34
4.2. Management User Interface ... 35
4.3. System Tasks ... 37
4.4. System Processing Sequence ... 38
4.5. Monitoring ... 40
5. Implementation and Experiments... 41
5.1. Node.js Server instance ... 41
5.2. Registration Service ... 43
5.3. Data Visualisation ... 51
L i s t o f C o n t e n t
5.5. Security Setup and Issues ... 54
5.6. Server Instance and Limits ... 55
6. Evaluation ... 69
L i s t o f F i g u r e s
i.
List of Figures
Figure 1: Internet of Things Schematic showing the end users and application areas
based on data (Gubbi et al., 2013) ... 19
Figure 2: Architecture - Overall System ... 34
Figure 3: System Process Sequence ... 37
Figure 4: Processing Steps ... 38
Figure 5: Monitoring Process ... 40
Figure 6: Node.js Server Instance ... 42
Figure 7: Registration Management Application ... 44
Figure 8: Setup ... 51
Figure 9: Smoothie Chart ... 52
Figure 10: ECG Signal (Association for the Advancement of Medical Instrumentation, 2002) ... 53
Figure 11: ECG Visualisation ... 53
Figure 12: Instances Experiment - Results Memory ... 57
Figure 13: Instances Experiment - Results CPU 1 ... 58
Figure 14: Instances Experiment - Results CPU 2 ... 59
Figure 15: Instances Experiment - Results CPU 3 ... 59
Figure 16: Instances Experiment - Results CPU 4 ... 60
Figure 17: Instances Experiment - Results CPU 5 ... 60
Figure 18: Transmission Speed Experiment - Results CPU 1 ... 62
Figure 19: Transmission Speed Experiment - Results CPU 2 ... 63
Figure 20: Transmission Speed Experiment - Results CPU 3 ... 63
Figure 21: Transmission Speed Experiment - Results CPU 4 ... 64
Figure 22: KDiff3 - Count Irregularities ... 65
Figure 23: Lost Packages Experiment - Results CPU 1 ... 67
Figure 24: Lost Packages Experiment - Results CPU 2 ... 67
Figure 25: Lost Packages Experiment - Results CPU 3 ... 68
L i s t o f T a b l e s
ii.
List of Tables
Table 1: Valuation Basis ... 26
Table 2: Database Schema ... 44
Table 3: Acceptance Test Unique ID ... 46
Table 4: Acceptance Test Unique Port ... 47
Table 5: Acceptance Test Delete ID ... 47
Table 6: Acceptance Test Delete Port ... 48
Table 7: Acceptance Test User Sensors ... 49
Table 8: Acceptance Test All Sensors ... 49
Table 9: Acceptance Test Register Sensors ... 50
Table 10: Instances Experiment ... 56
Table 11: Transmission Speed Experiment ... 62
Table 12: Lost Packages Experiment ... 66
L i s t o f S o u r c e C o d e
iii. List of Source Code
Source Code 1: Registration Interface ... 43
Source Code 2: Receiving Data on Website ... 52
Source Code 3: Node.js Script ... 80
L i s t o f A b b r e v i a t i o n s
iv. List of Abbreviations
API
Application Programming Interface ... 16 ATAM
Architecture Trade-off Analysis Method ... 25 CPU
Central Processing Unit ... 53 ECG
Electrocardiography ... 29 GPRS
General Packet Radio Service ... 16 GSM
Global System for Mobile Communication ... 16 GUI
Graphical User Interface ... 31 HTML
Hypertext Markup Language ... 22 HTML5
Hypertext Markup Language Version 5 ... 22 IoT
Internet of Things ... 15 IP
Internet Protocol ... 16 IPv6
Internet Protocol Version 6 ... 21 Json
JavaScript Object Notation ... 42 LAN
Local Area Network ... 30 LTE
Long Term Evolution ... 27 m-Health Mobile Health ... 16 P2P Peer to Peer ... 21 QoS Quality of Service ... 24 RAM Random-Access Memory... 55 RFID Radio-Frequency Identification ... 15 SMS
L i s t o f A b b r e v i a t i o n s
SSH
Sensor Streaming Hardware ... 17 TCP
Transmission Control Protocol ... 16 TLS
Transport Layer Security... 36 UDP
User Datagram Protocol ... 41 WebGL
Web-based Graphics Library ... 23 WISP
Wireless Identification and Sensing Platform ... 18 WoO
Web of Objects ... 20 WoT
Web of Things ... 15 WSN
Wireless Sensor Networks ... 15 XMPP
A c k n o w l e d g e m e n t s
v.
Acknowledgements
I would like to thank Alistair Lawson, my research supervisor, for his patient guidance, support and useful critiques throughout this research work.
I n t r o d u c t i o n
1.
Introduction
The term “Internet of Things” has become ubiquitous in recent years, and involves the connection between objects and communication between those objects at increasingly high-speed. The internet is becoming more and more dynamic in respect to timely visualisation of data. Higher bandwidth and powerful servers allows the transfer of a large amount of data in milliseconds. This increase in resources creates opportunities for new ideas and technologies. The development of an infrastructure that meets the demand of this high speed data transfer is investigated in this work.
The aim of the project is to design an architecture for real time sensor data streaming, and for management and live visualisation of that data over the web to contribute to the existing research field of the Web of Things. This project will investigate the infrastructure between streaming hardware and website. The hardware used for this kind of streaming is typically programmable, equipped with sensors or the ability to connect up sensors and a possibility to communicate over the internet, e.g. an Arduino board, Raspberry Pi or also a smartphone.
The project focuses on the universality and manageability of the system to allow many users to deploy sensing data over a web portal and consume the data on own websites or allow others to use the data on their websites. The requirements for a universal and manageable streaming service will be developed by investigation of existing systems and analysis of use cases in different application areas.
The operational capability of the architecture will be investigated by implementations and experiments. The project will identify the strength and weaknesses of the architecture, and investigate the feasibility of the concept. A basic prototype will be developed and tested. The feasibility of several parts of the system will be proved by implementations and tests. Visualisation possibilities, security, and processes will be investigated. The experiments and tests will define the limits of the system and give statements about the system performance.
I n t r o d u c t i o n
In order to meet the above aim, the dissertation is set out as follows. In chapter 2, the literature will be reviewed. This is followed in chapter 3 by an investigation of use cases and an analysis of system requirements. The system architecture will be proposed in chapter 4. Chapter 5 treats implementations and experiments to prove the feasibility of several parts of the proposed system. In chapter 6 the work will be evaluated, followed by the conclusion and future work in chapter 7.
L i t e r a t u r e R e v i e w
2.
Literature Review
This chapter will investigate applications and services where sensing data is involved. The area of sensor streaming and sensor technologies, including Wireless Sensor Networks (WSN) and Radio-Frequency Identification (RFID) will be investigated to give an overview about technical possibilities in the field of sensing. The vision of “Internet of Things” (IoT) and the relations to sensor data streaming will be analysed. The transition to the “Web of Things” (WoT) as an evolutionary step of the IoT will be made to explain the term of virtualisation and infrastructure of sensor streaming. Then web service architectures and sensor streaming management systems will be treated and finally actual web technologies will be investigated.
2.1. Sensor Streaming
Sensors measure a physical quantity and convert that measurement to a signal, which can be presented as a single value over time. The sampling rate of a sensor may vary from milliseconds to hours depending on the tasks and requirements of a system. A large range of Sensors have been used in different applications, to enumerate all of them would be beyond the scope of this work. The focus will be on sensors that can be involved in web applications for visualisation.
Application Areas
Data from sensors have been recorded and streamed for over 30 years, mostly concentrated on environment monitoring. This has included systems monitoring drought (Deng et al., 2013), seismology (IRIS, 2014), tsunamis (Australia, 2014), landslides (Teja et al., 2014) or floods (Y. Zhang, Li, Li, & Guo, 2009) for the purpose of alerting to potentially dangerous situations. Such systems send their data at intervals to their base stations or to a centralized computer (Ha, Lee, Vu, Jung, & Ryu, 2012), sometimes directly over the web where it will be stored in databases for use in longer term research. The update rate of the sensor data in a browser or database may vary from between a few seconds up to hours according to the requirements of most of the systems reviewed, e.g. the systems previously
L i t e r a t u r e R e v i e w
mentioned. A high update rate compared to the sensor sampling rate or real-time computing, like in industrial applications, e.g. machine control, is not targeted by the systems.
There are existing systems in the area of object tracking over the web as well. Tracking systems consisting of hardware and server using the Global System for Mobile Communication (GSM), General Packet Radio Service (GPRS) and often the Google API to visualize the tracked objects as discussed in (Chadil, Russameesawang, & Keeratiwintakorn, 2008), an open source tracking system using commodity hardware as described in (El-Medany, Al-Omary, Al-Hakim, Al-Irhayim, & Nusaif, 2010), a system using ASP.NET and TCP/IP sockets sending IP data packets over the connection with a time interval of 1 minute. Other systems using the Short Message Service (SMS) to transfer the data with an interval of 12 seconds (Rao, Izadi, Tellis, Ekanayake, & Pathirana, 2009). A fire emergency system was introduced and implemented in Java (Shamszaman, Ara, Chong, & Jeong, 2014). The system has a user interface which presents sensing data but there was no focus on performance of the system especially not on a fast transmission and actualisation rate. Most of these systems store the data in databases which can be accessed over the web.
In 2010, Val Jones established a discussion on two existing solutions for Mobile Health (m-Health) systems (Jones, Gay, & Leijdekkers, 2010). Patients wear sensor systems, measuring electrical activity of the heart (Electrocardiography), electrical potential generated by muscle cells (Electromyography), weight, temperature, respiration, body position, blood pressure, blood glucose and oxygen saturation. The sensor systems transmit their data to a handheld which acts like a communication gateway to a remote healthcare location. The philosophy of both solutions is to design a generic mobile system which can be adapted to different clinical applications (Jones et al., 2010).
The present work will concentrate on high speed data transmission and visualisation. The aim is to design a system which is able to stream sensing data with a high
L i t e r a t u r e R e v i e w
transmission speed and visual update rate in a range of milliseconds. Data will not be stored on the way between the Sensor Streaming Hardware (SSH) and the website to avoid slowing down the data flow and increase the privacy and security of data. The system will be kept as universal as possible to allow operational capability in many different application areas. For that reason system attributes should be configurable for different requirements.
2.2. Sensor Technologies
Different kind of sensor technologies can be used for sensor streaming. The following section is an investigation into Wireless Sensor Networks (WSN) and RFID technologies, demonstrating how they feature as a rising technology, and pointing out the possibilities of sensor streaming now and in the future.
Wireless Sensor Networks (WSN)
WSN are used in many application areas including environment monitoring, healthcare, home automation and traffic control. WSN are networks of autonomous devices monitoring physical and environmental conditions at different locations, like temperature, vibration or pressure with sensors (Ha et al., 2012). Moreover they are used in m-Health applications, where wearable body sensor networks monitor the physical condition of patients (Jones et al., 2010). There are different architectures of sensor networks. One scenario can be of sensors which send their data to a sink node and the sink node redirects the data to the web.
Radio-Frequency Identification (RFID)
RFID allows unique identification of objects and tracking them by stationary RFID readers. Systems based on RFID technologies are focused on energy consumption caused by the limitation of energy transmission over the air. Many application areas involving RFID based systems are described e.g. in transportation and logistics domain, healthcare domain, smart environment domain, and personal and social domain (Atzori, Iera, & Morabito, 2010), as well as in Traffic Monitoring, Tracking, Smart Environments, and local and global sensing (Singh, Tripathi, & Jara, 2014).
L i t e r a t u r e R e v i e w
They all include a base station RFID reader and objects with RFID capacity. RFID can be categorised depending on how it is powered. Active RFID is battery powered and nearly similar to WSN, passive RFID is powered over the air by the RFID reader and hybrid systems like WISP (Wireless Identification and Sensing Platform) are powered by the RFID reader, but have also a small solar cell to allow data logging beyond the range of the reader, which can be up to 10 meter. A future aim is to improve the sampling rate of the sensors and the range of this system (Sample, Braun, Parks, & Smith, 2011). The reader combined with a streaming hardware acts like an interface between local RFID processing and the sensor streaming web service.
The present work will not focus on low level sensor architecture and local communication between sensors. The focus of investigation will be on the infrastructure between the SSH, which could be a sensor node or sink, and the website used to visualise data in real time.
2.3. Sensor Streaming Area
Internet of Things (IoT)
The IoT is a large area with the vision of unique identification of real world objects and interaction with and between different objects and services. Depending on different technologies or application areas the definition of IoT may vary in a number of ways. Some of these definitions focus on uniquely addressable interconnected objects by using RFID technologies, others focus on communication and interaction between objects or investigation in infrastructures and others focus on user centric approaches (Gubbi, Buyya, Marusic, & Palaniswami, 2013). The data transmission between objects is the core statement of these definitions.
Due to the interdisciplinary nature of the subject, three paradigms for realising IoT were defined. The internet – oriented (middleware), the things oriented (sensors) and the semantic oriented (knowledge). The IoT is the interception of these three paradigms (Atzori et al., 2010).
L i t e r a t u r e R e v i e w
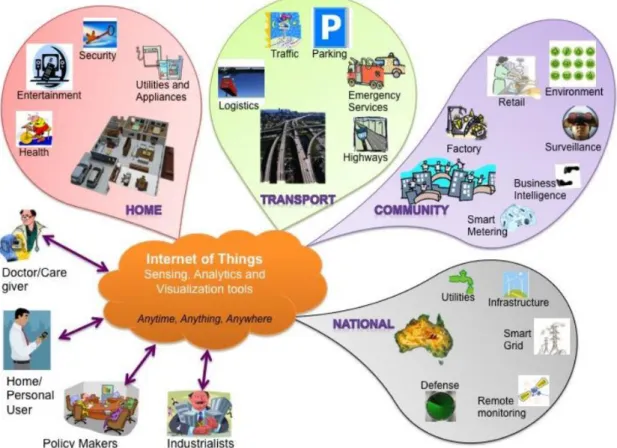
In 2013, Jayavardhana Gubbi defines the IoT as an “Interconnection of sensing and actuating devices providing the ability to share information across platforms through a unified framework, developing a common operating picture for enabling innovative applications. This is achieved by seamless large scale sensing, data analytics and information representation using cutting edge ubiquitous sensing and cloud computing.” (Gubbi et al., 2013)This definition is also an approach for this work. The present system will allow deploying and summarizing collected data from single sensors, sensor networks, RFID systems or smartphones and making them accessible over the web for visualisation purposes or allowing communication with other objects.
Figure 1: Internet of Things Schematic showing the end users and application areas based on data (Gubbi et al., 2013)
L i t e r a t u r e R e v i e w
Web of Things (WoT)
The WoT or Web of Objects (WoO) is a higher level of the IoT. It focuses on infrastructure and addresses virtualisation of real world objects. It has been defined by Zia Ush Shamszaman as: “The goal of the WoO is to deliver a service infrastructure that simplifies the management of the smart service environments able to provide a service that integrates various technologies like cloud computing and social networking. Hence, WoO allows the reuse of existing web technologies to build new applications and services by attaching smart objects to the Web. In this way, smart objects are abstracted as web services and seamlessly integrated into the living world of the Web, while services are discovered, composed and executed as needed.” (Shamszaman et al., 2014)
One output of the present work will be an infrastructure that allows easily deploying and managing sensing data. This infrastructure will be extendable and reusable in specific context, which matches the goals of the WoT. The proposed system does not abstract objects as web services, but their attributes are projected to the web in form of sensing data.
2.4. Architecture
Data Centric Systems
Data Centric systems are the state of the art. The information exchange is running through a central server. Most web services have this centric architecture. Data centric systems can handle massive connections and support different communication protocols, depending on their performance and bandwidth. Scenarios in the domain of smart cities, connected cars, crisis management and health care require user-centric services (Bendel et al., 2013). Data centric systems allow keeping manageability of data on one place. Most of introduced systems in chapter 2.1 and 2.2 are data centric systems.
L i t e r a t u r e R e v i e w
Peer to Peer networks
In Peer to Peer (P2P) networks all computers have the same status. P2P is a decentralized network architecture where every computer (Peer) is acting like a client and a server at the same time. One approach to connect objects in a P2P way, is to equip every object with hardware and tiny web servers and make them accessible over the web with a standard web browser by a TCP connection (Duquennoy, Lifl, & Grimaud, 2009). In RFID a similar approach can be found by making RFID equipped objects reachable from a network by addressing them over IPv6 address (Atzori et al., 2010). This is done by embedded webservers which make communication between objects easier. An example for near real-time device to device communication with P2P connection over Extensible Messaging and Presence Protocol (XMPP) is done by Bendel in 2013. The setup consists of a Wii Remote controlling a robot over a server with a delay of 112 milliseconds (Bendel et al., 2013). In 2013, Forsström created a P2P architecture which allow real time communication between entities and had the idea of a sensor sharing platform (Forsström & Kanter, 2013). P2P approaches may increase communication speed but making it difficult to ensure security and manageability of data. Also the scalability is an issue in case if one device needs to handle a mass of connections.
Sensing Data Management
Several projects for sensing data management exist, such as introduced by Cia, Liang and Wang in 2011, a monitoring systems, collecting sensor data like temperature or humidity and sending them to a sink node using the ZigBee communication protocol (Cai, Liang, & Wang, 2011). The data is send from the sink over a Network Bridge to a control centre where the data is stored and can be viewed. The data can be accessed over the web. Another project is presented by Zhang in 2013, which has the goal to maximize sharing and utility of available sensor data sources and data services. Zhang also compares different existing commercial sensor data platforms, like TempoDB, COSM and Sensor Cloud. TempoDB (TempoDB, 2014) is a database as a service. It has built-in visualisation tools and focus on time series data sets and on individual users, using own data (J. Zhang et
L i t e r a t u r e R e v i e w
al., 2013). COSM (LogMeIn Inc., 2014) (renamed to Xively) is a commercial platform for deployment of sensor data and visualisation in nearly real-time for industrial software solutions. It allows sharing of sensing data between users, supports certain commercial devices and focus on sensors with discrete readings (J. Zhang et al., 2013). Sensor Cloud (MicroStrain, 2014) focus on individual users, using own data and allows remote device management. It has a math engine and built-in visualisation (J. Zhang et al., 2013).
All these systems store sensor data to databases in contrast to the idea of present work, where data will be redirected and direct consumed by client applications, e.g. visualisation of data. The decision is to store data on client side. The work will investigate fast processing, high update rates for smooth visualisation and how to deliver a high grade of universality.
The Sensible Things Platform is a web service for deployment of sensors and enabling IoT based applications (Forsström, Kardeby, Österberg, & Jennehag, 2014). It allows connecting different sensors and actuators by registering them to the platform. The platform is an open source architecture which allows developers to build their application based on it. The platform uses P2P connections and has a response time of a few milliseconds. The system does not store any data in a database and is open to use for everyone.
It is nearly similar to the idea of present work with the difference that Forsströms system is a real P2P system without any central server for management of the sensor streams. It is easy to use but coding skills in java are required by the user which requires a much experienced developer.
2.5. Web Technologies
HTML5 and WebGL
The Hypertext Mark-up Language (HTML) is a core technology of the internet. HTML5 is the latest HTML standard for structuring and presenting World Wide Web content. It allows the inclusion of multimedia and graphical content without the use of
L i t e r a t u r e R e v i e w
plugins (Chen, 2011). The Web-based Graphics Library (WebGL) allows 3D accelerated graphics in web browsers. It uses JavaScript and can be used with HTML5 without any browser plugins (Chen, 2011). It is important for the visualisation part of this work because it allows the actualisation of web content in real time.
WebSockets
WebSockets allow bi-directional communication over TCP between web browsers and web servers or other client or server applications. The usual way before WebSockets exist was to ask the server for a resource, getting the response and closing the connection (Chen, 2011). In one project WebSockets were used to transfer intensive rendering visualisation data in real time. The data was rendered on server side and transferred to a client application to minimize client side processing (Wessels, Purvis, Jackson, & Rahman, 2011). An architecture for a virtual world web client was developed and evaluated consisting of WebGL and WebSockets technology (Dahl, Koskela, Hickey, & Vatjus-Anttila, 2013). WebLab-FPGA is an remote laboratory project connecting WebGL, WebSockets with hardware (Orduña & Angulo, 2014). The hardware can be remotely programmed and control a virtual pump. WebGL and HTML5 was studied in Anderson and Johansson in 2012 with focus on cross-device and cross-browser ability (Andersson & Johansson, 2012). WebSockets are integrated in the HTML5 standard. In this project WebSockets were used for the connection and data transfer between sensor streaming hardware and server and the connection between server and website.
Node.js
Node.js is a lightweight server technology for data intensive real time applications. It uses asynchronous non-blocking input and output processing and is used and established by many companies like Yahoo, eBay, Microsoft and PayPal. Node.js is built on Chrome´s Java Script runtime and is written in C++ and Java Script programming language. Programs for Node.js must be written in Java Script (Joyent Inc., 2014). Alternatives like SignalR from Microsoft exist. Node.js was chosen because of the high acceptance of the community and a larger support. In this project
L i t e r a t u r e R e v i e w
it is used as the junction between sensor streaming hardware and website. It manages the incoming data stream and broadcast it to the websites.
ASP.NET
ASP.Net is a Microsoft technology for creating web applications. It is a client and server-side technology. ASP.NET is based on the .Net Framework architecture and allows the creation, deployment and execution of web applications and web services. It makes the development process much easier because it provides a lot of development tools and advantages like libraries from the .Net Framework (Microsoft, 2014). Alternative technologies are PHP5 (Hypertext Pre-processor) or JAVA Server Pages. ASP.NET was chosen because of the possibility to use a Microsoft server technology.
2.6. Conclusion
Different technologies have been reviewed. RFID has some problems such as missing standards, mobility support, naming, transport protocols, traffic characterisation and Quality of Service (QoS) support, authentication, data integrity, privacy, and digital forgetting (Atzori et al., 2010). Several different sensor management systems were investigated with different focus, philosophies, architectures and possibilities. There are many sensor streaming services available. Most systems are focused on one specific task. The data refreshing intervals are often higher than one second. The architectures consist mostly of data centric systems with databases and are concentrating on long term research, monitoring or big data analysis. Some sensor platforms use P2P architectures. Web technologies for creating real time systems were investigated such as WebSockets, HTML5 and Node.js.
The present work aims to solve existing issues and provide a means to deploy and manage sensor data in a user friendly way. To do this, it will mainly focus on streaming data from SSH to a website and visualisation of data in real time.
R e q u i r e m e n t A n a l y s i s
3.
Requirement Analysis
This chapter is an investigation of requirements for the sensor streaming web service. The first part is a requirement definition which identifies requirements and specifications for the architecture concept. The second part analyses representative test cases in different application areas and sets them in relation to the previous definition of requirement. The last part lists all identified requirements based on the analysis.
3.1. Requirement definition
The system will be used in many different applications. The focus of the system will be on universal usability and configurability. Some requirements may change for different use cases others not. The requirements were taken form (J. Zhang et al., 2013), which is a nearly similar system handling a big amount of data and connections. Zhangs requirements arose from an Architecture Trade-off Analysis Method (ATAM) and are as follows:
Scalability
Reliability
Interoperability (Static requirement)
Security
Integrity (Static requirement)
Data Freshness (Static requirement)
Privacy
Performance
Reusability (Static requirement)
Extensibility (Static requirement)
The requirements were divided into changing and static requirements. Static requirements are not changing in different for use cases. Changing requirements
R e q u i r e m e n t A n a l y s i s
may vary for different use cases. The following changing requirements were rated to distinguish the different use cases.
Scalability
Visualisation update rate (Performance)
Importance of mobility
Importance of reliability
Importance of security
Importance of privacy
For each requirement limits are defined (high, medium or low) which are shown in Table 1. The limits are explained and will be used to distinguish the application cases in the next chapter.
Table 1: Valuation Basis
The six requirements were identified. They may have different importance and definition for different applications. The complete table can be found in the appendix (A.1).
The first requirement is the scalability. Different applications use a different amount of sensors streamed over a SSH. Some applications may stream many sensors at once and others applications may send a set of sensor data recorded in an interval. Especially in applications with an extremely high sensor sampling rate the data can
Area Healtcare Engineering Transport Private Sector HCI
Measuring ECG Manufacturing Tolerances Vehicle Telemetry Smartphone Sensors Position/ Acceleration sensors Visualisation Technology 2D-Graph Values, 2D-Model Values,
2D-Graph/Map 2D-Interaction 3D-Interaction
Scalability High Low Low Low Medium
Visualisation
Rate Low Low Medium High High
Mobility High Low High Medium Medium
Reliability Medium High Medium Medium Medium
Security High High Medium Low Low
Privacy High Medium Medium Low Low
R e q u i r e m e n t A n a l y s i s
be sent after a time interval in a set. It was assumed that most tasks will transmit between 10 and 100 values at once. A “high” amount was defined for sending more than 100 values at once, a “medium” amount for fewer than 100 values and “low” amount for fewer than 10 values sent at once.
The visualisation update rate is the second requirement. It defines the speed of actualising the data in the browser. Some applications may actualize their data in an interval of a couple seconds, like weather data, where a fast update rate is not important because the sensor data changes slowly. Other applications need timely visual feedback, such as a human computer interface for controlling web content, which needs an update rate in the range of milliseconds to produce a smooth visual feedback for the user. Based on the assumption that for most applications an interval of one second will be enough, as discussed in other systems in the literature review in section 2.1, a visualisation rate of 0.1 seconds was defined as “high”, fewer than 1 second as “medium” and more than 1 second as “low”. Smooth visualisations can be produced with a rate faster than 16 frames per second (Neumeyer & Brown, 2014), which is a visualisation rate of 0.0625 seconds. Section 5.6 investigates how close the system can get to a smooth visualisation.
Mobility is the third requirement. It is different between different application areas. Some applications will be used whilst stationary and others whilst mobile which may have an influence on data transmission speed and connection stability. Mobility was divided into “high”, which means a high flexibility nearly everywhere by using mobile internet like 3G. Long Term Evolution (LTE) was not considered since it is still not as widespread. “Medium” means location based flexibility by using Wi-Fi and “low” is for fixed wire internet connections.
Reliability is the fourth requirement. Mechanisms for monitoring the system are needed, to allow exception handling and to redeploy or scale a broken or overloaded server instance. The importance is “high” if there is no tolerance for connection problems because the data is timely needed. “Medium”, if the connection may break but a timely arrival time of data is not important. In this case data can be buffered and
R e q u i r e m e n t A n a l y s i s
send at once if the connection is rebuild. And “low” if transmitted data can be left unnoticed.
The fifth requirement is the security. The streaming data needs to be secured against unauthorised access of third parties. “High” security is a complete encryption of data with encryption certificates. “Medium” security is a secure transport between destinations. And “low” security is the transmission or raw data, which can be done in case of sharing the data.
Privacy is the sixth requirement. “High” importance of privacy was defined if the streamed data can be abused by a third party to harm an individual person or an organisation. A “medium” importance is defined if the data is privacy relevant but cannot harm an individual person or organisation. And “low”, if privacy is not important, e.g. in case of data sharing.
R e q u i r e m e n t A n a l y s i s
3.2. Review of Example Application Areas
Five different application areas were investigated to keep the web service as universal as possible. Each area includes a case, which focus on high speed streaming and direct visualisation over the web. A table which summarizes the evaluation of the cases can be found in the appendix (A.1).
3.2.1. Health
Electrocardiography (ECG) is used to measure the electrical activity of the heart and usually visualizing the values in a 2-Dimensional graph. The transmission of an ECG signal was chosen as an example because it is a complex and time critical task. An average human resting heart rate ranges from 60-80 beats per minute (American Heart Association, 2014). The ECG records also values between heartbeats, which creates a more complex graph. An ECG signal was investigated to find out how many values are recorded during a second. PhysioNet (Goldberger et al., 2000) is a database which keeps records of medical data also, among other, ECG signal data. The selected ECG signal (Association for the Advancement of Medical Instrumentation, 2002) has a sampling rate of 720Hz, which could be transmitted in two ways. The first possibility is to send every single value to the website. In that case the transmission and visualisation need to be faster than 1.4ms. The second way is to send a set of 720 values each second, which is more efficient regarding transmission speed. The systems targets flexible users with high mobility thus not critical patients, e.g. for sports, study or diagnosis purpose. Accordingly, it should be able to transfer the data over a mobile connection. In this case, connection interruptions may be caused by poor mobile connectivity. The system needs to be secure against attacks. Data privacy is very important and the data needs to be encrypted, because it has a direct relation to a person.
3.2.2. Engineering
An engineering example is a production line producing a high number of products e.g. one second per product. These products were monitored by e.g. five laser
R e q u i r e m e n t A n a l y s i s
sensors which were used for detecting manufacturing tolerances. The streaming system is used to send the measured values to a company internal website to increase the flexibility of responsible employees. The data is accessible from anywhere with any device. Tolerances can be visualized as blank values, but also as 2-Dimensional models. The system needs to transmit the five measured values immediately. The visualisation update rate depends on the speed of production which is in this case one update per second. The data can be transferred over a LAN connection, because the production line is stationary. The reliability of the system needs to be high because it is responsible for production quality and the data is kept as a record for the company. The system needs to be safe against attacks, but data do not need to be encrypted. The privacy of data is in that case not important because it has no relation to a person.
3.2.3. Transport
Vehicle telemetry is sent from a vehicle to a website to visualize energy consumption, position and acceleration of the vehicle, or CO2 emission. The data can be visualized as blank values, a 2-Dimensional graph or on a map. In this specific case are not many sensor values involved. The visualisation rate should be faster than a second to allow a smooth visualisation. The system needs to work over a mobile connection, which could cause connection interrupts. The connection between vehicle and website needs to be secured. The data privacy is important but is not in a direct relationship to a person.
3.2.4. Private Sector
A smartphone is used as an input device for interaction with web content. Sensors, like gyroscope, accelerometer and touchscreen are streamed to the website and their values can directly influence the content. There are not many sensors involved, but the visualisation update rate needs to be high to allow a smooth interaction with a minimum of delay. Wi-Fi is used for data transmission, because the interaction takes place in front of a screen. Connection loss may happen, however it is not a critical
R e q u i r e m e n t A n a l y s i s
application. The connection between device and website needs to be secure. Privacy is not of importance in this area.
3.2.5. Human Computer Interaction
Sensors position and acceleration sensors in gloves are used as an input device to interact with a 3-Dimensional environment directly inside the browser. Three Sensors, gyroscope, accelerometer and magnetometer are needed like in (YEI Corporation, 2014), which is a sensor suit for motion capture. Each sensor generates three values to represent one rigid object. In this case, two fingers are equipped with one sensor system consisting of gyroscope, accelerometer and magnetometer on each finger, which allows many different interactions with a virtual environment. The visualisation update rate needs to be very high to allow a smooth interaction with the environment. The interaction happens in front of a screen, so the sensors could communicate over Wi-Fi. The reliability of the system is in that case not very important. The importance of security and privacy is similar to the usual interaction with websites.
3.3. List of Requirements
This section lists the defined requirements of the system based on the analysis of the application areas and evaluation in the previous section of this chapter.
i. Scalability
The service can be used in different application areas. It can transmit any kind of text based data and different amount of values at once. The amount of values can be configured by a web based Graphical User Interface (GUI).
ii. Visualisation Update Rate
The system can be used with different visualisation update rates. The interval of data transmission needs to be configurable by a web based GUI.
R e q u i r e m e n t A n a l y s i s
iii. Configurability
The system needs to provide a web based GUI which allows configuration of the system. The user should make only a minimum of configurations on hardware side. The hardware should also provide a GUI for the configuration.
iv. Sensor Data Sharing
The system needs to provide a web based GUI which allows deploying, sharing and publishing the sensor stream.
v. Frontend Development
The user should only need frontend development skills in HTML and Java Script for visualizing sensor data.
vi. Visualising Data
The service should allow visualisation of sensor data as single values, 2D graphs or maps and also interaction with 3D objects without significant delay.
vii. Database Adaption
The user should be able to adapt a database and redirecting data from client side to the backend by using Java Script and storing the data to the database.
viii. Security
The service needs to provide user authentication for the management system (GUI). The user can choose between different kind of security, like encrypted, transport secured and raw data transmission. Potential threats need to be analysed and avoided.
ix. Privacy
The system should hide private user data or trace back of user connections. x. Reliability
The system needs to be reliable and handle connection loss, overloads and server break downs by monitoring the system and solving problems.
R e q u i r e m e n t A n a l y s i s
xi. System Limits
System limits should be identified and stored to give the user feedback on configuration and avoid an impossible setup, e.g. extremely high visual update rate with extremely big amount of values to transmit at the same time.
P r o p o s e d S y s t e m A r c h i t e c t u r e
4.
Proposed System Architecture
This chapter proposes a system architecture design. It starts with a general overview and description of the system and goes in more detail by investigation of a single connection. The processing sequence from the user’s point of view and the internal server processes will be described. The last part will discuss the relation to the requirements and a concept of monitoring the system.
4.1. Overview
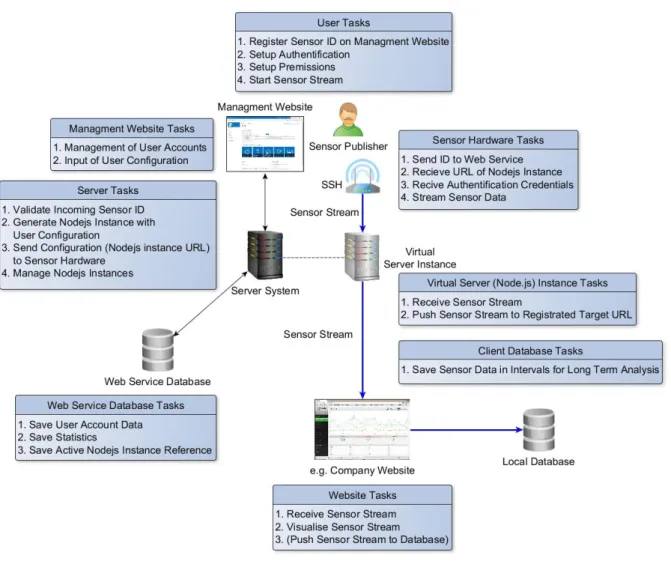
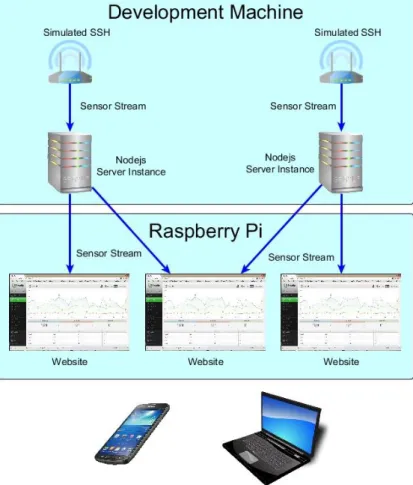
The architecture concept will provide a platform for sensor data distribution and sharing. Figure 2 shows the overall system.
P r o p o s e d S y s t e m A r c h i t e c t u r e
Different users can use the platform at once. They streaming sensor data over Wi-Fi, but it could also be a mobile connection or LAN to a virtual server instance, created by a management server. The virtual server instance is a Node.js instance and will be configured by a management website on the server by the sensor owner. It will allow configuration of security, update rate, amount of values and usage permissions for other users. The Node.js instance works as a distributor and can be consumed by many websites at once. Websites can connect to the instance and use the stream for visualisation or can redirect the data to a local or cloud-based database. The data can be visualised due to standard web technologies in many ways, e.g. graphs and 3-Dimensional models. The sensor data can be also used by other hardware, like robots or machines. It will be also possible to combine two nodes on one website or merge two sensors of different users on one server node.
4.2. Management User Interface
The management web service is an ASP.NET MVC project which provides a website with a user interface. A user can create an account, authenticate and register a sensor. The following connection properties can be configured by the interface.
Sensor Identification number
The sensor identification number will be generated automatically from the server after registration. The user needs to copy the number together with the username to the streaming hardware. It will be used to identify the sensor stream when it connects the first time to the service.
Amount of Values
The amount of values to stream in one interval to the server will be configured by the user. One sensor has usually one value. It may happen that a sensor has more values, e.g. acceleration in three dimensions, or a user connects ten different sensors to a SSH and wants to send all values to a website at once. Another possibility is to use this attribute for sensors with an extremely high sampling rate, e.g. 720Hz. This would comply with 720 updates on a website during one second,
P r o p o s e d S y s t e m A r c h i t e c t u r e
a set of, e.g. 360, 720 or 1440 values in one interval. The amount of values has an influence on the possible update rate of the system. As more values are streamed at once as larger the package size will be, as slower the data transmission and also the visualisation. The influence of different amount of values will be investigated in a later chapter.
Update Rate
The update rate is the interval in which the SSH send the data to the server and the server actualize the content of the website. Depending on the use case, the user can choose from hours up to millisecond. The influence of different update rates and limits will be investigated in a later chapter.
Data Hold
The user can decide to choose the “Data Hold” option to minimize traffic between SSH and server. The sensor data will be only streamed to the server if the measured value changes. This option is interesting for sensors which measuring slow changing physical quantities, like e.g. room temperature, light or trigger. This function should be integrated between the server and the website as a standard to lower the traffic on client side.
Sensor Publishing
The user can choose to publish the sensor data with the community or make it accessible to specific users. Other users can consume the data on their websites. Security
The user needs to configure the security between SSH and server. Three options are available for the connection. Standard is the Transport Layer Security (TLS). In addition, the data can be full encrypted by exchange of encryption certificates. But also a transmission of raw data is possible.
P r o p o s e d S y s t e m A r c h i t e c t u r e
4.3. System Tasks
After the registration and configuration, the management server creates a Node.js instance with the configured setup. Figure 3 shows a single connection between SSH, Node.js instance and website. Also the management website connected to the management server is illustrated. Each element of the architecture has individual tasks.
Figure 3: System Process Sequence
The management website provides the user interface for registration and configuration of the hardware. After creating a sensor on the website, the management server generates the Node.js server instance based on the configuration. Like mentioned in 4.2, the user has the task to configure the SSH. The
P r o p o s e d S y s t e m A r c h i t e c t u r e
SSH provide a GUI which can be accessed through the local network by the IP address of the SSH. After turning the SSH on, it connects to a registration service, where the device will be validated based on the stored configuration on the web service. The SSH receives the configuration from the service, connects to the Node.js instance over a WebSocket connection and streams sensor data to the server instance. The Node.js instance is the broker between SSH and visualisation website. It has a WebSocket connection to both ends, one to the SSH and another to the website, which could be also used bidirectional. The visualisation website can have a backend with the possibility to connect to a database and store the sensor data in intervals.
4.4. System Processing Sequence
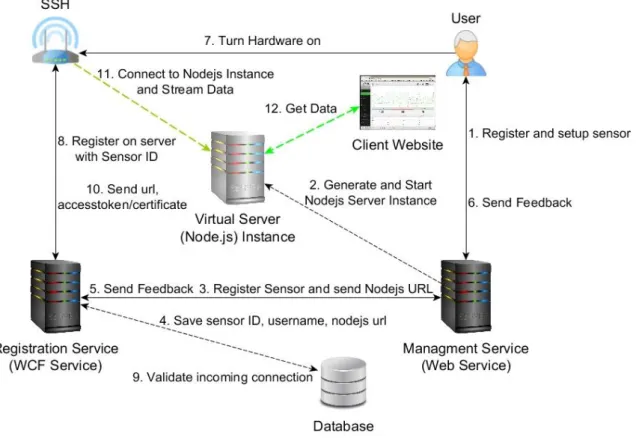
A detailed model of the service with all processing steps and interactions is illustrated below in Figure 4.
P r o p o s e d S y s t e m A r c h i t e c t u r e
The first step is the interaction of the user with the management service. The user registers and configures the sensor and data stream. The management service creates a Node.js Server instance with the user configurations and sends the configuration data and Node.js instance address to the Registration Service, which could be hosted on the same server. The Registration Service is responsible for storing configuration data, registration and first configuration of the SSH. It saves the configuration data sent by the Management Service to a database and confirms it. The Management Service confirms to the user that the setup was successful with a sensor ID and the address of the Node.js instance for connecting a website. The user configures the sensor ID and username on the SSH and turns the hardware on. The SSH will automatically connect to the Registration Service with the configured ID and username. The Registration Service compares the ID with the database records and after validation, it sends the users configurations and security certificates to the SSH. Now the SSH knows the address of the Node.js instance and has also the correct security certificates. It connects to it and starts to stream the data immediately. The user can create a website and use the Node.js instance address to fetch the sensor data from the SSH. The user has also the possibility to publish the sensor stream. In that case it appears on the management website in a shared location for a specific user. Permitted users can see the Node.js instance address, can download the certificate and connect to the instance with their websites and fetch the data.
P r o p o s e d S y s t e m A r c h i t e c t u r e
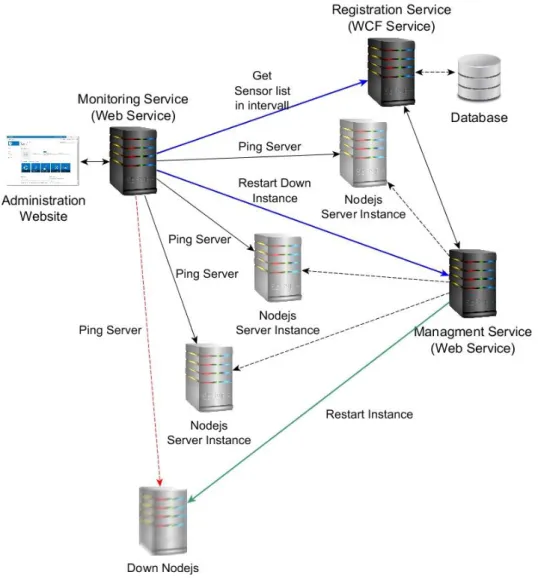
4.5. Monitoring
The system is monitored by a separate web service. The monitoring system is illustrated in Figure 5. It increases the reliability of the system. The web service has an own administration web site for statistics and provides an overview over running processes and system failures. The web service fetch a list of all running sensor stream Node.js instances from the registration web service and ping each server of this list. If a Node.js server instance is unobtainable it sends the server information to the management server, which reloads the Node.js server instance. This will guarantee that all servers are running and registered sensors can be streamed.
I m p l e m e n t a t i o n a n d E x p e r i m e n t s
5.
Implementation and Experiments
This chapter explains the implementation of the software and experiments. Different parts of the architecture concept were implemented and tested to evaluate the operational capability of the concept. The software refers to different points in the concept. Experiments will evaluate the abilities of the architecture and also reveal the limits of the system.
5.1. Node.js Server instance
A Node.js server was implemented in two versions, one version with TLS security configuration and one without. The code can be found in the appendix (A.2). The secure version uses security certificates for transport security, which means the data is encrypted between the endpoints. Both versions can be merged in one server script at a further step. It is possible to instantiate a Node.js server instance with variable ports by adding the port numbers to the execution command.
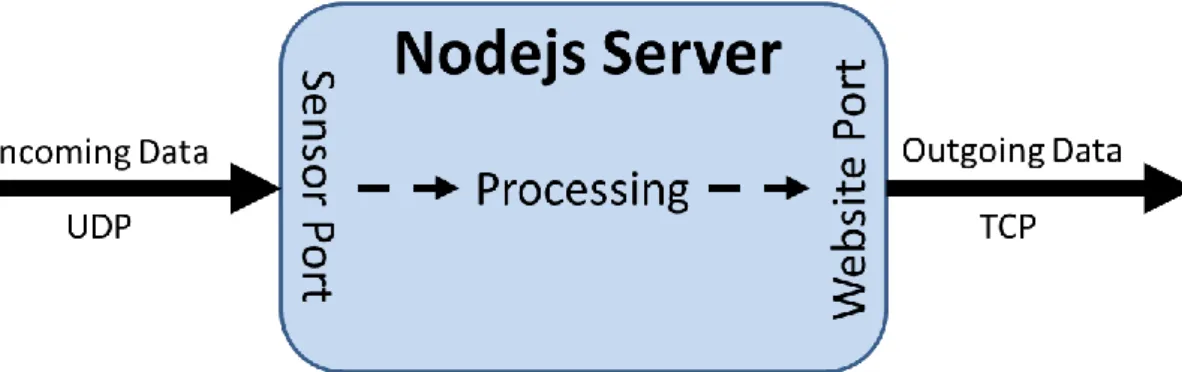
The server works as a broker between SSH and client websites. A User Datagram Protocol (UDP) connection is used for data transmission between SSH and Node.js server. An UDP connection is fast because after a package is send, there is no confirmation about the arrival of the package. So it may happen that packages get lost or arrive in a wrong order. The incoming SSH stream is received at one server port, processed and sends to websites over another port with a Transmission Control Protocol (TCP) connection, like illustrated in Figure 6. The TCP connection between server and website ensures that data packages will arrive and are also in the right order. The transmission is slower caused by the validation process.
I m p l e m e n t a t i o n a n d E x p e r i m e n t s
Figure 6: Node.js Server Instance
Due to the UDP connection which does not synchronize the incoming data, it may also happen that packages are received from the server multiple times. A processing step avoid similar packages be forwarded to websites. The incoming data packages are strings in Java Script Object Notation (Json) format. Each package has a timestamp which distinguish it from others. Reading the timestamp would require de-serializing, parsing and de-serializing, which makes the processing slow. To avoid this, only the hash value of each object will be compared with the hash value of the last object. A new timestamp inside the object generates each time a unique hash value. Similar packages have a similar hash value.
The server allows transmitting data with a variable update rate and the transmission of any kind of text based data. These properties meet the requirements of i. Scalability and ii. Visualisation update rate.
I m p l e m e n t a t i o n a n d E x p e r i m e n t s
5.2. Registration Service
A registration service was implemented to test the registration process and analyse the attributes for the registration. The service is an ASP.NET WCF service and consists of a database and a communication interface.
1. [ServiceContract]
2. public interface ISensorRegistrationService 3. {
4. [OperationContract]
5. Registration RegisterSensor(string username, int sensorid); 6.
7. [OperationContract]
8. Response AddSensor(string username, int amountOfValues, int updateRate, 9. string code);
10.
11. [OperationContract]
12. Response DeleteSensor(string username, int sensorid, string code); 13.
14. [OperationContract]
15. Response GetSensor(string username, string code); 16.
17. [OperationContract]
18. Response GetAllConnections(string code); 19.}
Source Code 1: Registration Interface
The interface allows the SSH to register a sensor which exists in the database by sending the username and sensor id. All other methods are secured by a code and can be only accessed by the system itself for communication purposes. New sensors can be added with a configuration and existing sensors can be deleted. The interface allows retrieving all sensors of one user and also all sensors at once from the database.
The database is illustrated in Table 2. It has a unique id for each record and stores username, sensor id, Node.js server address and port, client website port, access token, security certificate, visualisation update rate and amount of values to stream.
I m p l e m e n t a t i o n a n d E x p e r i m e n t s
Table 2: Database Schema
Two applications were implemented for the communication with the registration service. The first is a management application with GUI to test the WCF registration service interface. The second application is a console application to simulate the registration process accomplished by the SSH.
Figure 7: Registration Management Application
The management application, illustrated in Figure 7, allows testing the registration interface. A sensor can be added by entering the username, amount of values and update rate. If the user does not exist the registration service will create a new one. The registration service creates all other attributes automatically, like the unique sensor id, Node.js server address with unique ports, access token and security
I m p l e m e n t a t i o n a n d E x p e r i m e n t s
certificate. The combination of username and sensor id needs to be unique, that allows the user to combine multiple sensor streams. The ports need to be also unique, because the server instance is running on a physical machine and the ports are limited to 65.535. Each port can be used for one incoming and one outgoing connection on server side. One port is used for incoming data from the SSH and the other is used for the outgoing communication, a broadcast to other websites.
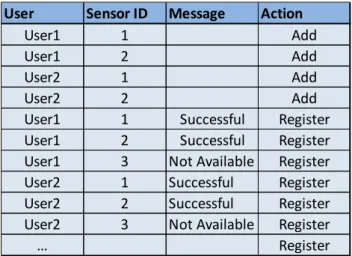
The registration application is a console application, which simulates the registration process from SSH point of view. The application takes a username and sensor id. In production state this would be configured by the user on the SSH. The registration application knows the static registration service address and connects to it automatically. The incoming data are checked on the registration server and if they are valid, the registration service response with all needed information for connection to the Node.js instance and also the update rate, amount of values to stream and the security certificate for a save TLS connection. A Node.js server instance was created before in the background which would be created by another server in production state. The registration application starts to stream random data in Json-format to the Node.js instance. The data is visible in the Node.js console and can be also viewed by a local website.
In a production state scenario the SSH configuration would be done by connecting the SSH to a local network and visiting the menu website by a local IP address owned by the SSH like in a modern Wi-Fi router. Username and id can be entered and also additional security token could be added to make the service saver.
This setup fits to requirements iii. Configurability and iv. Sensor Data Sharing. It is possible to add sensors through a GUI, the configuration of the SSH is reduced to a minimum effort and can be easily extended with a GUI interface. It is easily possible to extend the service by a web portal to allow sensor data sharing.
An acceptance tests for the registration service were defined to test the web service interface and investigate the operational capability of the registration service. The acceptance test was conducted with the registration management application.
I m p l e m e n t a t i o n a n d E x p e r i m e n t s
5.2.1. Acceptance Test: Unique username and sensor ID combination
Each user may have several SSH which are connected to the service. For identification purpose, the combination of username and sensor ID needs to be unique. Similar sensor IDs may exist but need to be owned by different users.
Examples
Adding new sensors creates a unique username and sensor ID combination. The following is expected:
Table 3: Acceptance Test Unique ID
The test was successfully passed. Each username and sensor ID combination is unique.
5.2.2. Acceptance Test: Unique ports
After adding a new sensor, the service needs to find free ports for the Node.js server instance to avoid port conflicts.
Examples
Adding new sensors create each time new port numbers. The following is expected:
User Sensor ID Unique
User1 1 yes User1 2 yes User1 3 yes User2 1 yes User2 2 yes User2 3 yes User3 1 yes User3 2 yes User3 3 yes …
I m p l e m e n t a t i o n a n d E x p e r i m e n t s
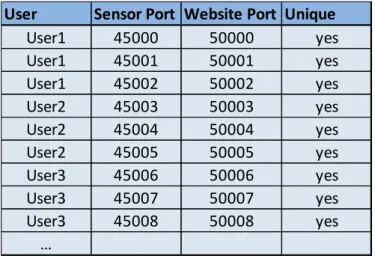
Table 4: Acceptance Test Unique Port
The test was successfully passed. The service chooses each time new ports. 5.2.3. Acceptance Test: Set sensor ID free after deleting
After deleting a sensor of a user, the sensor ID should be free to use for the next sensor.
Examples
Adding some sensors and deleting the first will set the sensor ID free for the next added sensor. The following is expected:
Table 5: Acceptance Test Delete ID
The test was successfully passed. The service set the ID from deleted sensors free. The ID is used for the next added sensor.
User Sensor Port Website Port Unique
User1 45000 50000 yes User1 45001 50001 yes User1 45002 50002 yes User2 45003 50003 yes User2 45004 50004 yes User2 45005 50005 yes User3 45006 50006 yes User3 45007 50007 yes User3 45008 50008 yes …
User Sensor ID Action
User1 1 Add User1 2 Add User1 3 Add User1 4 Add User1 5 Add User1 2 Delete User1 4 Delete User1 2 Add User1 4 Add …
I m p l e m e n t a t i o n a n d E x p e r i m e n t s
5.2.4. Acceptance Test: Set ports free after deleting
After deleting a sensor from a user the ports should be free to use for the next sensor added.
Examples
Adding some sensors and deleting the first will set the ports free for the next added sensor. The following is expected:
Table 6: Acceptance Test Delete Port
The test was successfully passed. The service set not used ports free and use them for the next added sensor.
5.2.5. Acceptance Test: Get sensors of one user
The service need to provide an overview of created sensors of a specific user. Examples
Adding some sensors for different users and retrieving the sensors by username will return a list of sensors owned by the user. The following is expected:
User Sensor ID Sensor Port Website Port Action
User1 1 45000 50000 Add User1 2 45001 50001 Add User1 3 45002 50002 Add User2 1 45003 50003 Add User2 2 45004 50004 Add User1 1 45000 50000 Delete User2 1 45003 50003 Delete User3 1 45000 50000 Add User3 2 45003 50003 Add User3 3 45005 50005 Add …
I m p l e m e n t a t i o n a n d E x p e r i m e n t s
Table 7: Acceptance Test User Sensors
The test was successfully passed. The service provides a list of sensors owned by a specific user.
5.2.6. Acceptance Test: Get all sensors
The service need to provide an overview of all available sensors stored in a database.
Examples
Adding some sensors for different users and retrieving them by a command will return a list of all sensors stored in the database. The following is expected:
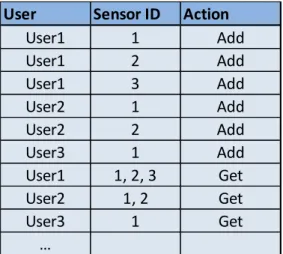
Table 8: Acceptance Test All Sensors
User Sensor ID Action
User1 1 Add User1 2 Add User1 3 Add User2 1 Add User2 2 Add User3 1 Add User1 1, 2, 3 Get User2 1, 2 Get User3 1 Get …
User Sensor ID Action
User1 1 Add User1 2 Add User1 3 Add User2 1 Add User2 2 Add User3 1 Add User1 1, 2, 3 User2 1, 2 User3 1 … Get