Open Source Infrastructure for Healthcare Data
Integration and Machine Learning Analyses
Isoviita Veli-Matti1, Salminen Liina2, Azar Jimmy1, Lehtonen Rainer1, Roering Pia3, Carpén Olli4, Hietanen Sakari2, Grénman Seija2, Hynninen Johanna2, Färkkilä Anniina1,5, Hautaniemi Sampsa1, *1Research Program in Systems Oncology, Faculty of Medicine, University of Helsinki, Finland 2Department of Obstetrics and Gynaecology, University of Turku and Turku University Hospital, Finland
3Department of Pathology and Forensic Medicine, University of Turku, Finland
4Institute of Biomedicine, Research Center for Cancer, Infections and Immunity, University of Turku, Finland
5Department of Radiation Oncology, Dana-Farber Cancer Institute, Harvard Medical School, Boston, MA, USA
*Corresponding author
Professor Sampsa Hautaniemi
Systems Oncology Research Program Research Programs Unit
Faculty of Medicine PO Box 63 00014, University of Helsinki Finland TEL: +358 50 336 4765 email: [email protected]
This project has received funding from the European Union’s Horizon 2020 research and innovation programme under grant agreement No 667403 for HERCULES, the Academy of Finland (projects 305087, 292402), the Sigrid Jusélius Foundation, and Finnish Cancer Association.
Final version of this manuscript has been pub-lished at JCO Clinical Cancer Informatics jour-nal, August 27, 2019:
ABSTRACT Purpose
We have created a cloud-based machine learning system (CLOBNET) that is an open source, lean infrastructure for electronic health record (EHR) data integration capable of extract, transform, and load (ETL) processing. CLOBNET enables comprehensive analysis and visualization of structured EHR data. We demonstrate the utility of CLOBNET by predicting primary therapy outcomes of high-grade serous ovarian cancer (HGSOC) patients based on EHR data.
Materials and Methods
CLOBNET is built using open-source software to make data preprocessing, analysis, and model training user friendly. The source code of CLOBNET is available in GitHub. The HGSOC dataset was based on a prospective cohort of 208 HGSOC patients treated at Turku University Hospital, Finland from 2009 to 2019 for whom comprehensive clinical and EHR data were available.
Results
We trained machine learning (ML) models using clinical data including a herein developed dissemination score that quantifies the disease burden at the time of diagnosis to identify patients with progressive disease (PD) or a complete response (CR) based on Response Evaluation Criteria in Solid Tumors (RECIST 1.1). The best performance was achieved with a logistic regression model, which resulted in an area under receiver operating characteristic curve (AUROC) of 0.86 with specificity of 73% and sensitivity of 89%, when classifying between PD and CR patients.
Conclusion
We have developed an open-source computational infrastructure, CLOBNET, which enables effective and rapid analysis of EHR and other clinical data. Our results demonstrate that CLOBNET allows predictions to be made based on EHR data to address clinically relevant questions.
INTRODUCTION
Electronic health record (EHR) data provide an untapped and currently underused resource for improving health care and patient management. However, many current EHR systems comprise a colossal, distributed dataset of patient information, without an integrated method for secondary use of the data, such as healthcare analytics or research, thereby severely hindering extensive use of EHR data.1-3 Furthermore, the size and complexity of EHR calls for automatic data handling systems and machine learning (ML) algorithms that can analyze and translate these data to make them useful for research, patient care, and health economics.2
Translating raw EHR data into medical benefits requires the ability to utilize vast but dispersed knowledge in various databases and machine learning (ML) algorithms in a clinically relevant way. ML algorithms are powerful because they can process highly dimensional data and discover patterns from complex data without extensive prior knowledge of the underlying variable relationships. Extract-transform-load (ETL) processes are needed to deliver the data from various sources to a single database in a usable format. Interpreting EHR data requires the use of biological and medical databases, such as the International Classification for Diseases-104 or NOMESCO Classification of Surgical Procedures.5 These requirements, together with the various formats used in managing EHR data, call for an infrastructure that allows for short and agile development cycles and for the integration of clinical expertise into systems development.
Extensive work has been done on standardizing ontologies and data structures to make EHR data, such as Informatics for Integrating Biology & the Bedside (i2b2)6,7 or Health Level 7,8 available for research and other secondary usage. Although several systems have been created to serve distinct research settings,9-11 these systems are often either too specialized or heavy-duty systems requiring
laborious setup and administration tasks. Thus, they do not allow rapid iteration and testing of methods and results.
To address the challenge of creating clinically relevant models with ML from heterogeneous clinical data stored in several different locations, we have developed an open-source cloud-based machine learning system (CLOBNET). This computational infrastructure integrates ETL processes, data warehousing, variable aggregation, ML implementation, and a graphical user interface (GUI) in a single, lean system. Using CLOBNET, clinical research questions can be answered with combined data and ML in a streamlined and agile fashion. Regarding the information flow from patients to new models and extracted information, CLOBNET is positioned downstream of systems storing EHR data or other structural databases containing patient-related data, which cannot readily be analyzed using ML or are stored in distinct locations or networks.
To demonstrate the utility of CLOBNET, we used it to predict the therapy response of patients with high-grade serous ovarian cancer (HGSOC). HGSOC is the largest and most lethal epithelial ovarian cancer subtype, with a 43% five-year survival rate.12 The primary standard of care therapy consists of primary or interval debulking surgery (PDS or IDS) combined with adjuvant or neoadjuvant platinum-based chemotherapy. However, up to 20% of patients do not respond to primary therapy, and have primary progressive disease (PD) associated with an extremely poor prognosis. Currently, the clinically used prognostic markers for HGSOC are residual tumor after debulking surgery,13 age at diagnosis, levels of the cancer antigen 125 (CA-125), and the International Federation of Gynecologists and Obstetricians 2014 (FIGO 2014) stage, which classifies disease spread.14 However, the current markers are poor predictors of the lack of response to treatment. We hypothesized that detailed clinical data, including a dissemination score introduced herein that quantifies the disease
burden in a patient, combined with EHR data using ML, would be superior to current markers in terms of the identification of patients with PD, thereby opening a window to offer additional therapies to eventually improve the prognosis and quality of life of patients with aggressive HGSOC.15 Our results show that machine learning classification based on clinical data alone allows identifying poor and good responding HGSOC patients.
METHODS CLOBNET
CLOBNET is a scalable machine learning environment designed to process clinical data and to generate predictive models for disease prognostics. It contains all the required processes in a single package, thus providing a convenient setup and fast development of the automatic integration of data from multiple sources, such as research databases and EHR systems. As the data in CLOBNET are first gathered in a structured query language (SQL) database, transformation scripts can be developed in a uniform way using solely SQL, and the preprocessed data can be loaded to tables storing the data and fed to ML algorithms. Once possible error sources, such as textual information stored in laboratory data time series, are identified, these scripts can be updated, making the development of preprocessing straightforward and simple. By storing the untransformed data in the same database, the data can be visualized or analyzed for other purposes, such as patient history browsing using CLOBNET’s graphical user interface (GUI), which is illustrated in Supplementary Figure 2.
Technical Implementation
CLOBNET was built on the Ubuntu 16.04 Long Term Support (LTS) operating system and other openly available software. The data was stored in the PostgreSQL 9.5.12 database, and the ML
algorithms were run by Python 2.7.12 using Pandas 0.17.1, Scipy 1.0.0 and Scikit-learn 0.1916 libraries. The GUI was built as a web page using PHP 7.0.30 with Bootstrap 4.0 and Chart.js libraries at the front end and hosted via Apache 2.4.18. Inside CLOBNET, data were analyzed using Python 2.7.12. Python environment was connected to PostgreSQL database using psycopg library and Web GUI using PHP’s pgsql extension. The main functionalities of CLOBNET are depicted in Figure 1. EHR data synchronization to CLOBNET was built upon a standard SQL connection. A user account for the data provider was created with privileges to read a table with cohort patients’ personal IDs and to write data into tables storing the EHR data. Making the data connections directly to the SQL database enabled various middleware implementations, which may vary between hospitals. The data synchronization from live EHR was done by Turku University Hospital’s internal data service, the technical implementation of which is outside and out of scope of the CLOBNET system.
The data gathered from EHR and research database was stored in the SQL database in source-specific tables, containing the pseudonym as the main identificator per row. Tables containing clinical data, such as laboratory data, diagnosis codes, operation codes and medication data were merged into single table that was used in the treatment prediction analyses. The database structure and the schema of CLOBNET is provided in supplementary material. The source code is published in GitHub (https://github.com/isoviita/CLOBNET) under BSD 2-Clause License.
Dissemination Score
The patient disease burden was systematically assessed by the operating team using a standardized 16-part questionnaire, where each part was scored as shown in Table 1. Every major abdominal anatomical site and possible metastasis were included to obtain a complete picture of dissemination, as the level of dissemination is a prognostic factor.14 The dissemination score ranges from zero to 21. Scores close to zero mean limited disease, whereas high scores denote
metastasized disease and an extensive disease burden. The dissemination score was assessed by the operating gynecologic oncologist or operating team during diagnostic laparoscopy, primary debulking surgery (PDS) or interval debulking surgery (IDS), resulting in a high-resolution view of the disease burden.
Cohort
This study was based on a prospective cohort of ovarian cancer patients who were treated in Turku University Hospital, Turku, Finland between October 2009 and January 2019. At the time of the study in January 2019, the cohort had 208 HGSOC patients. The demographics and clinical characteristics of the cohort are shown in Table 2. Experienced gynecologic oncologists were responsible for clinical data collection and systematic disease dissemination assessments during the treatment. All the patients participating in the study provided informed consent, and the research was approved by the ethics committee of Turku University Hospital. A research database for patient information storage was created using FileMaker Server 13 and maintained by study nurses and participating researchers. Outcome predictions were evaluated using defined outcomes of the Response Evaluation Criteria in Solid Tumors (RECIST) version 1.1 as endpoints,17 as these are clearly defined and outlined by the Gynecological Cancer Intergroup (GCIG) and widely used by clinicians and the research community. For the machine learning analyses, progressive disease (PD) and complete response (CR) outcomes were selected for classification of two clinically clearly distinct prognostic groups.
Statistical Analysis
The statistical analysis was done using SPSS Statistics 24.0.0.2 (IBM Corp., Armonk, NY). For categorical dependent variables, the statistical significance of between-group differences was
assessed using the c2-test or Fisher’s exact test when the expected cell count was less than five. For
continuous dependent variables, statistical significance was determined using the Kruskal–Wallis or Mann–Whitney U test, p values under 0.05 regarded as statistically significant. We used area under receiver operating characteristic curve (AUROC) as the evaluation metric as the ROC figure shows directly sensitivity and specificity.
In machine learning analyses, effect of class imbalance was tested by weighting the classes inversely proportional to class frequencies in the input data. Patients with incomplete clinical data were excluded, as the ML models required full set of input variables. ML model cross-validation was done using leave-one-out cross-validation (LOOCV).
RESULTS
CLOBNET enables testing a number of ML models, automates the data flow, analysis, and visualization, without the need for manual data import or file handling. An overview of CLOBNET is provided in Figure 1, and a more detailed schematic is given in Supplementary Figure 1. The automated processes in CLOBNET facilitate iterative model training and re-analysis of constantly accumulating and updating data. CLOBNET provides an infrastructure capable of answering clinical questions by fusing structured but not necessarily cleaned EHR data from different sources and creating information from the combined data with ML models.
We first tested the predictive value of all clinical variables (n=16, Table 3) with six ML methods in classifying HGSOC patients with progressive disease (n=19) or complete response (n=78). Best overall performance was achieved with the logistic regression 20 (AUROC=0.86, sensitivity=89%, specificity=73%) as shown in Figure 2 followed by Bernoulli Naïve Bayes (AUROC=0.84,
sensitivity=68%, specificity=75%). While Random Forest 21 achieved AUROC of 0.88, it did not achieve acceptable sensitivity (sensitivity=26%, specificity=98%). AUROC for C-support vector machine, Gaussian Naïve Bayes and linear support vector machine varied between 0.62 and 0.78 (Supplementary Table 1 and Supplementary Figure 3). As our dataset had 1:4 ratio of PD and CR patients, which could affect the performance of some classifiers, we tested whether class weighting changed the results. The effect of class imbalance did not have an effect to the best-performing logistic regression model (AUROC=0.86; Supplementary Figure 4).
Next, we analyzed the predictive power of the individual variables in classifying 1) PD and CR patients and 2) PD and merged CR and partial response (PR) patients. The most predictive and significant independent variables for the comparison between PD and CR after PDS were the dissemination score (AUROC = 0.70, p=0.03, 95% CI=0.527-0.872) and blood platelet count at diagnosis (AUROC=0.71, p=0.03, 95% CI=0.515-0.894). The predictive power of the other variables ranged from 0.51 (Serum CA-125 levels) to 0.67 (blood sodium level at diagnosis; Supplementary material). When the CR and PR patients were merged and compared against PD patients, the predictive power of the variables declined. Again, the most predictive variables were dissemination score (AUROC=0.67, p=0.07, 95% CI=0.484-0.847) and platelet count (AUROC=0.67, p=0.06, 95% CI=0.482-0.855) (Supplementary material).
The herein introduced dissemination score is one of the most predictive variables for treatment resistance and thus we used Cox regression model to test whether dissemination score can predict the time elapsed from diagnosis to disease progression (Table 3). The dissemination score showed prognostic value in a univariate Cox model (HR=1.097, 95% CI=1.039-1.157, p=0.001). The prognostic value of the dissemination score remained statistically significant when tested with a
multivariable Cox model that included the FIGO 2014 stage, age at diagnosis and CA-125 level at diagnosis (HR=1.100, 95%, CI=1.038-1.166, p=0.001). When the residual tumor size, which is currently the one of the strongest prognostic variables 13,18, was included to the model, the dissemination score became marginally significant (HR=1.062, 95% CI=1.000-1.128, p=0.051).
DISCUSSION
We demonstrated that CLOBNET, an agile and open-source computational infrastructure, enables the translation of structured EHR data into useful clinical knowledge. Lean and full stack systems development permit high-frequency iterations when the research setting requires new features or different configurations. CLOBNET allows for straightforward training of ML models when new data become available, as the preprocessing functions can be linked automatically to live data sources. Using clinical data without the need for natural language processing or manual extraction of clinical annotations greatly reduces the workload needed to convert EHR data to meaningful information, which is one of the main benefits of using CLOBNET. The development of CLOBNET can be enhanced by the continued utilization of widely used open-source libraries and related community resources.
In our case study, we predicted primary therapy outcomes in HGSOC using six different supervised machine learning methods using CLOBNET. The best predictor was logistic regression, which achieved AUROC of 86% for separating PD and CR HGSOC patients. Our results demonstrate the benefit of combining information from multiple sources as well as the utility of CLOBNET by predicting primary therapy outcomes of HGSOC patients based on EHR data. While CLOBNET’s high predictive power for therapy outcome is very encouraging and suggests that CLOBNET could be used as a part of clinical routine to predict in real-time whether an HGSOC patient will respond to primary
therapy, our results are based on limited data set and warrant further validation in larger cohorts as well as careful consideration in the clinical setting.
The best predictions of a PR or CR in HGSOC patients were achieved using a combination of clinical markers and laboratory test results from EHR systems. The AUC of 0.86 achieved with logistic regression indicates that CLOBNET enables the establishment of predictive models to analyze combined perioperative dissemination data and preoperative clinical data. Taken together, the results demonstrate the benefit of combining information from multiple sources. They show that the data analysis workflow implemented in CLOBNET can accurately predict primary outcomes in HGSOC.
The herein introduced dissemination score alone demonstrated high preoperative prognostic value (AUROC=71%) and suggests that it provides a more accurate assessment of the disease burden than the FIGO 2014 stage. The decline in the significance when the disease dissemination score was combined with the cytoreduction results in Cox model is expected as several studies indicate the prognostic value of leaving as little tumor mass as possible after PDS.14,18,19 .
Most importantly, predictions done with CLOBNET allow for early identification of patients who are resistant to therapy and who have an extremely poor prognosis. As CLOBNET is designed to real-time use, it can provide unprecedented power to support clinical decisions and offer additional therapies to patients with primary progressive HGSOC. While the setup described herein is configured for distinct data sources and HGSOC, CLOBNET is open source and can be easily modified
for other datasets and clinical settings or deployed in a multicenter setting, thereby mitigating the security risks and legal burdens of health data exchange.
ACKNOWLEDGMENTS
The authors would like to thank the Centre for Clinical Informatics in Turku University Hospital for extracting and harmonizing part of the clinical data used in the study.
REFERENCES
1. Schaeffer C, Booton L, Halleck J, et al: Big Data Management in US – Hospitals Benefits and Barriers. The Health Care Manager. 36(1):87–95, 2017.
2. Meystre SM, Lovis C, Bürkle T, et al. Clinical Data Reuse or Secondary Use - Current Status and Potential Future Progress. Yearb Med Inform. Aug;26(1):38-52, 2017.
3. Halamka J. Early Experiences with Big Data at an Academic Medical Center. Health Aff (Millwood). 33(7):1132-1138. 2014.
4. World Health Organization. ICD-10: International Statistical Classification of Diseases and Related Health Problems. Geneva: WHO. 2009.
5. Nordic Medico-Statistical Committee (NOMESCO) NOMESCO Classification of Surgical Procedures. Copenhagen: NOMESCO. 2010
6. Klann J, Abend A, Raghavan V, et al. Data interchange using i2b2. J Am Med Inform Assoc. Sep;23(5):909-15, 2016
7. Haarbrandt B, Tute E, Marschollek M. Automated population of an i2b2 clinical data warehouse from an openEHR-based data repository. J Biomed Inform. Oct;63:277-294, 2016.
8. Pecoraro F, Luzi D, Ricci FL. Designing ETL Tools to Feed a Data Warehouse Based on Electronic Healthcare Record Infrastructure. Stud Health Technol Inform. 210:929-33, 2015.
9. de Souza Inacio A, Savaris A, Alves JM, et al. GISTelemed: an online-based GIS approach to epidemiological analysis in telemedicine systems. Conf Proc IEEE Eng Med Biol Soc.
Aug;2016:5376-5379, 2016.
10.Sudharsan B, Peeples M, Shomali M. Hypoglycemia Prediction Using Machine Learning Models for Patients with Type 2 Diabetes. J Diabetes Sci Technol. Jan;9(1):86-90, 2015. 11.Huang C, Mezencev R, McDonald F. Open source machine-learning algorithms for the
prediction of optimal cancer drug therapies. PLoS One. 12(10):e0186906, 2017. 12.Noone AM, Howlader N, Krapcho M, et al. SEER Cancer Statistics Review, 1975-2015,
National Cancer Institute. Bethesda, MD, https://seer.cancer.gov/csr/1975_2015/, based on November 2017 SEER data submission, posted to the SEER web site, April 2018.
13.Elattar A, Bryant A, Winter-Roach BA, et al. Optimal primary surgical treatment for advanced epithelial ovarian cancer. Cochrane Database Syst Rev. Aug 10;(8):CD007565, 2011.
14.Suidan R, Ramirez P, Sarasohn D, et al. Multicenter prospective trial evaluating the ability of preoperative computed tomography scan and serum CA-125 to predict suboptimal cytoreduction at primary debulking surgery for advanced ovarian, fallopian tube, and peritoneal cancer. Gynecol Oncol. 134:455–461, 2014.
15.Clarke T, Galaal K, Bryant A, et al. Evaluation of follow-up strategies for patients with epithelial ovarian cancer following completion of primary treatment (Review). Cochrane Database of Systematic Reviews, Issue 9. Art. No.: CD006119, 2014.
16.Pedregosa F, Varoquaux G, Gramfort A, et al. Scikit-learn: Machine Learning in Python. JMLR 12, pp. 2825-2830, 2011.
17.Rustin G, Vergose I, Eisenhauer E, et al. Definitions for Response and Progression in Ovarian Cancer Clinical Trials Incorporating RECIST 1.1 and CA 125 Agreed by the Gynecological Cancer Intergroup (GCIG). Int J Gynecol Cancer. Feb;21(2):419-23, 2011. 18.Bowtell D, Böhm S, Ahmed A, et al. Rethinking ovarian cancer II: reducing mortality from
high-grade serous ovarian cancer. Nat Rev Cancer. Nov 15 (11):668-679, 2015. (20) 19.Dennis S, Zivanovic O, Palayekar M, et al. A contemporary analysis of the ability of
preoperative serum CA-125 to predict primary cytoreductive outcome in patients with advanced ovarian, tubal and peritoneal carcinoma. Gynecologic Oncology Jan 1 (112):6-10, 2009. (21)
20.Cox DR. The Regression Analysis of Binary Sequences. Journal of the Royal Statistical Society. Series B (Methodological), Vol. 20, No. 2:215-242, 1958.
TABLES AND FIGURES
Anatomic location Points 0 1 2 3
Pelvic carcinomatosis No Yes
Subdiaphragmatic surface carcinomatosis No Yes Carcinomatosis around the peritoneal cavity No Yes Small bowel mesentery carcinomatosis No Yes Small bowel mesentery retraction No Yes Large bowel mesentery carcinomatosis No Yes Small bowel serosae carcinomatosis No Yes Large bowel serosae carcinomatosis No Yes
Invasion to bowel mucosae No Yes
Largest omental nodule - < 2 cm 2–5 cm > 5 cm Largest right ovary nodule - < 10 cm ≥ 10 cm
Largest left ovary nodule - < 10 cm ≥ 10 cm Pelvic lymph node metastasis suspected No Yes
Para-aortic lymph node metastasis suspected No Yes
Spleen metastasis No Yes
Invasion to abdominal wall No Yes
Invasion to liver surface No Yes
Outcome Sig.
CR PR PD ND Other Total p
No. of subjects (%) 101 (48.6) 50 (24) 29 (13.9) 18 (8.7) 10 (4.8) 208 (100)
Age at diagnosis, years, mean ± SD 67 ± 9 69 ± 7 68 ± 10 68 ± 10 75 ± 5 68 ± 9 0.043 (1
Previous cancer diagnosis, no. (% of
outcome)
Yes 12 (11.9) 6 (12.0) 3 (10.3) 3 (16.7) 3 (30.0) 27 (13.0) 0.104 (2
No 88 (87.1) 42 (84.0) 24 (82.8) 13 (72.2) 6 (60.0) 173 (83.2) ND 1 (1.0) 2 (4.0) 2 (6.9) 2 (11.1) 1 (10.0) 8 (3.8)
Chronic illnesses, no. (% of outcome) 0.868 (2
Yes 68 (67.3) 35 (70.0) 21 (72.4) 14 (77.8) 8 (80.0) 146 (70.2) No 31 (30.7) 13 (26.0) 7 (24.1) 3 (16.7) 2 (20.0) 56 (26.9) ND 2 (2.0) 2 (4.0) 1 (3.4) 1 (5.6) 0 6 (2.9)
Cancer in the family, no. (% of outcome) 0.491 (2
Yes 41 (40.6) 18 (36.0) 11 (37.9) 10 (55.6) 2 (20.0) 82 (39.4) No 13 (12.9) 3 (6.0) 3 (10.3) 0 1 (10.0 20 (9.6) ND 47 (46.5) 29 (58.0) 15 (51.7) 8 (44.4) 7 (70.0) 106 (51.0) CA-125 level at diagnosis, U/ml ± SD 1346 ± 2297 2151 ±
3084 1766 ± 3006 961 ± 1349 598 ± 492 1527 ± 2524 0.037
(1
Hemoglobin level at diagnosis, g/l ± SD 123 ± 16 119 ± 13 118 ± 15 125 ± 15 120 ± 9 121 ± 15 0.242 (1
Leukocyte level at diagnosis, E9/l ± SD 13 ± 19 18 ± 41 10 ± 14 9.7 ± 2.3 9.5 ± 2.7 13 ± 24 0.242 (1
Creatinine level at diagnosis, µmol/l ±
SD 69 ± 13 73 ± 21 71 ± 20 - 95 ± 40 72 ± 19 0.315
(1
Platelet count at diagnosis, E9/l ± SD 340 ± 104 397 ± 141 460 ± 162 416 ± 134 335 ± 95 376 ± 131 0.001 (1
FIGO 2014 stage, no. (% of outcome) 0.06 (2
IC1 1 (1.0) 0 0 0 0 1 (0.5) IC2 2 (2.0) 0 0 0 0 2 (1.0) IIA 1 (1.0) 0 0 0 0 1 (0.5) IIB 4 (4.0) 0 0 0 0 4 (1.9) IIIA 0 0 0 1 (5.6) 0 1 (1.0) IIIA1 1 (1.0) 0 0 1 (5.6) 0 2 (0.5) IIIB 5 (5.0) 1 (2.0) 0 2 (11.1) 1 (10.0) 9 (4.3) IIIC 64 (63.4) 22 (44.0) 16 (55.2) 7 (38.9) 7 (70.0) 116 (55.8) IVA 9 (8.9) 8 (16.0) 6 (20.7) 3 (16.7) 1 (10.0) 27 (13.0) IVB 14 (13.9) 19 (38.0) 7 (24.1) 3 (16.7) 1 (10.0) 44 (21.2) ND 1 0 0 1 (5.6) 0 1 (0.5)
Treatment strategy, no. (% of outcome) 1.5 x 10⁻⁴
(2
PDS 59 (58.4) 22 (44.0) 1 (3.4) 9 (50.0) 5 (50.0) 96 (46.2) NACT 42 (41.6) 28 (56.0) 28 (96.6) 8 (44.4) 4 (40.0) 110 (52.9)
Other 0 0 0 0 1 (10.0) 1 (0.5)
ND 0 0 0 1 (5.6) 0 1 (0.5)
PDS residual tumor size, no. (% of
outcome) 3.0 x 10 -4 (2 0 mm 33 (55.9) 2 (9.1) 0 4 (44.4) 1 (20.0) 40 (41.7) 1–10 mm 17 (28.8) 11 (50.0) 0 3 (33.3) 1 (20.0) 32 (33.3) > 10 mm 9 (15.3) 9 (40.9) 1 (100.0) 1 (11.1) 3 (60.0) 23 (24.0) ND 0 0 0 1 (11.1) 0 1 (1.0)
Dissemination score, mean ± SD 9 ± 4 12 ± 3 12 ± 4 10 ± 4 9 ± 4 11 ± 3 6.5 x 10⁻⁶ (1
Time to progression, months, mean ±
SD 18 ± 8 15 ± 7 4 ± 2 - 8 ± 7 14 ± 9 7.8 x 10
-15 (1
Platinum-free interval, days, mean ± SD 387 ± 246 268 ± 220 5 ± 58 - -29 ± 134 256 ± 260 1.1 x 10⁻¹³ (1
Time to death, months, mean ± SD 41 ± 21 31 ± 18 14 ± 11 - 13 ± 18 27 ± 21 6.5 x 10⁻⁸ (1
Dissemination score (DS)
PDS IDS Difference in the DS for PDS and IDS PD, mean ± SD 12.1 ± 4.1 12.1 ± 4.8 -1.5 ± 4.5 Not PD, mean ± SD 9.9 ± 4.0 6.5 ± 3.5 -5.2 ± 4.2 AUC 0.68 0.85 0.73 Significance 0.046 7.5 x 10⁻⁵ 0.009 CR, mean ± SD 8.8 ± 3.8 5.7 ± 3.3 -5.4 ± 4.5 Not CR, mean ± SD 11.5 ± 3.9 9.2 ± 4.6 -3.5 ± 4.3 AUC 0.65 0.75 0.62 Significance 0.030 3.4 x 10⁻⁴ 0.089 PD vs. CR AUC 0.71 0.88 0.74 Significance 0.028 5.7 x 10⁻⁵ 0.020
Cox regression model, time to progression HR 95% CI Significance DS at diagnosis 1.097 1.039–1.157 0.001 DS with FIGO 2014 stage 1.106 1.045–1.171 0.001 DS with FIGO 2014, age at
diagnosis, and CA-125 1.100 1.038–1.166 0.001 DS with cytoreduction
results 1.062 1.000–1.128 0.051 Table 3.
Table 4.
Variable Data Source Data type
FIGO2014 stage Research database Ordinal
Disease Dissemination Research database Nominal
Dissemination index Research database Scale
Treatment strategy Research database Nominal
Age at diagnosis Research database Scale
Peripheral blood at diagnosis
CA-125 level EHR / Laboratory system Scale
Hemoglobin level EHR / Laboratory system Scale
Leukocyte count EHR / Laboratory system Scale
Platelet count EHR / Laboratory system Scale
Sodium level EHR / Laboratory system Scale
TABLE AND FIGURE LEGENDS
Table 1. Dissemination scores. During surgery, the disease dissemination was evaluated by the gynecologic oncologist or the operating team, and points were given based on the following features. The dissemination score values ranged from 0 to 21.
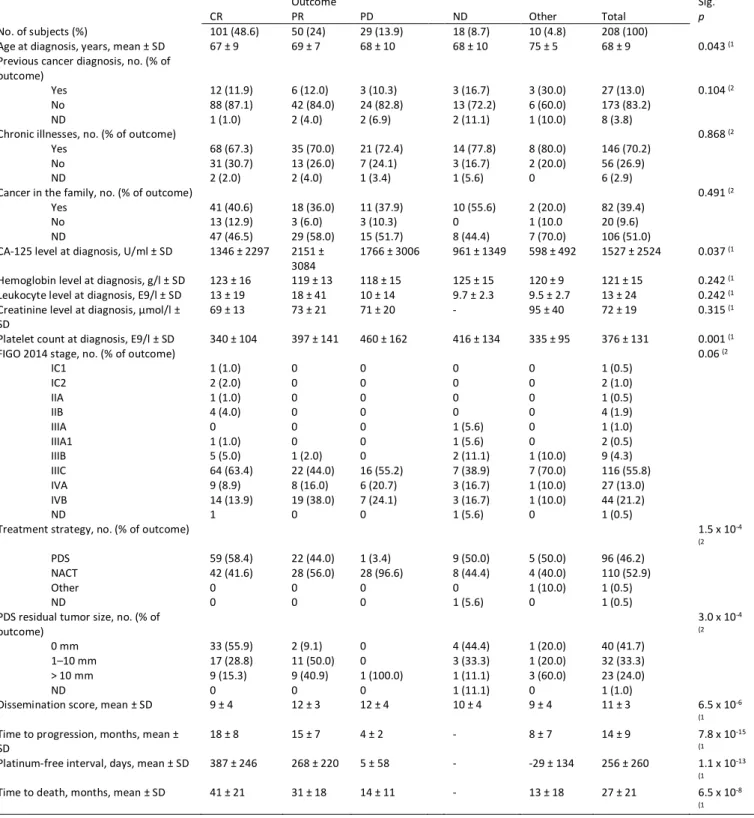
Table 2. Patient cohort demographics and clinical characteristics. CR = complete response, PD = progressive disease, PR = partial response, ND = not defined, PDS = primary debulking surgery, NACT = neoadjuvant chemotherapy, CA-125 = cancer antigen 125. SD = standard deviation. Statistical tests: 1) Independent samples Kruskal–Wallis 2) Fisher’s exact test.
Table 3. Dissemination scores, the difference in the dissemination scores for PDS and IDS according to patient outcomes, and the results of the Cox regression model for time to progression. The reported significance is for the difference between the groups calculated using the Mann–Whitney U test. PDS = primary debulking surgery, IDS = interval debulking surgery, PD = progressive disease, CR = complete response, AUC = area under the curve, SD = standard deviation, DS = dissemination score, FIGO 2014 = International Federation of Gynecologists and Obstetricians 2014 (FIGO 2014) stage, CA-125 = cancer antigen 12-5, HR = hazard ratio, CI = confidence interval.
Table 4. Input variables and their sources used in machine learning analyses. FIGO2014 = International Federation of Gynecologists and Obstetricians 2014, CA-125 = cancer antigen 125, EHR = electronic health record system, ICD-10 = International Classification of Diseases.
Figure 1. The main functionality of the cloud-based machine learning system (CLOBNET). The figure shows the data flow from the patient to various repositories and into CLOBNET and the feedback loop to the clinic providing prognostic models and decision support. DB = database, CLOBNET = cloud-based machine learning system, ML = machine learning, EHR = electronic health record.
Figure 2. Area under the receiver operating characteristics curve (AUROC) curve of a Logistic regression model classifying patients between progressive disease (PD, n=19) or complete response (CR, n=19) as primary therapy outcome, using clinical and laboratory data as input. Specificity = 73%, sensitivity= 89%. AUROC = area under the receiver operating characteristics curve.
SUPPLEMENTARY MATERIAL
Documentation
CLOBNET (Cloud-based machine learning network) v0.8 consists of front-end GUI for information visualisation and viewing, postgreSQL database and Python scripts performing the machine learning analysis. At the development setting, it has been running inside Ubuntu 16.04 LTS and it does not require any proprietary software. Main incentive to create the system has been to create an ability to integrate various data sources inside a single database to be used in clinical data analysis such as machine learning. We aim to do this in as light and as straightforward way as possible. As CLOBNET is intended to be operated only in a secured internal network, no user adminsitration functionality is integrated at the moment.
CLOBNET is part of HERCULES project and it is maintained by Systems Biology in Cancer Group, Faculty of Medicine, University of Helsinki.
Used software
• PostgreSQL 9.5.13 as a database
• Python 2.7 for machine learning analyses • Apache 2.4.18 for hosting the web GUI • PHP7.0.30 for web GUI back-end
• npm for hanlding various packages for web front end, such as:
o Grunt o React o Bootstrap 4 o SCSS
o …
o These package dependencies are maintained at web/packages.json
Folder structure
.
├── export # Folder for files to be exported from CLOBNET
├── import # Folder for files to be imported to CLOBNET
├── machine_learning # Machine learning scripts
│ ├── decision_trees # Trained decision trees as dot files
│ │ └ png # Decision trees as png files
│ ├── auc_curves # AUC curves as png files
│ └─- pickles # ML models stored as pickles
├── sql # SQL scripts
└── web # Web GUI files
├── dist # Grunt output location, folder to be hosted by Apache ├── src # GUI dev folder
│ ├ js # Custom JS
│ ├ includes # PHP scripts such as functions, database connections │ ├ pieces # Website parts such as HTML head, topbar
│ └ scss # GUI design └── node_modules # npm modules
SQL
CLOBNET database runs with PostgreSQL. All patient information is identified using a pseudonym, which is found from every table under pseudonym column, datatype being varchar. Patient data is divided into distinct tables by different iformation categories such as diagnoses, laboratory test
results, operations and so on. Tables are named with _data ending and naming of tables and variables uses underscore and lowercase, as postgres naming is case-insensitive.
As the data to be inputted into CLOBNET can require lots of cleansing and parsing, this
transformation part has to be configured on a source by source basis. Idea in CLOBNET is to first load the files into import folder and then handle data transformation and loading using SQL scripts, which can be included into create_and_parse_all_tables.sql. In this manner, no further scripting is needed if the data source format and file naming are kept unchanged.
Tables
SQL script to create the tables are found in separate files under clobnet/sql/ folder. Scripts are divided to table creation and table parsing files, one for each table. A script file running all the scripts is also provided. This initiation can be done from postgres with the following command, including path to sql file:
# \i /<clobnet-path>/sql/create_and_parse_all_tables.sql
Population of the said data tables are created with data-source spesific scripts. Separation of table creation and paring allows the initialisation of database in an uniform way regardless of the data sources and thus using same analytics and downstream pipelines for different sources.
classificators
This table contains information about the machine learning models created with Python. When a model is trained, its performance information is stored to this table and the model itself is stored as a pickel to machine_learning/pickles, from where it can be accessed later. Pefrormance
information is inserted by Python as the models are created and this information is visualised with GUI.
• id [serial] Model identifier, primary key
• name [varchar(255)] Name of the model eg. Support Vector Machine, Decision tree minLeaf = 5 and so on.
• sql_query [text] SQL query used by Python to get the input data for the model. • auc [float] AUC of the model
• sensitivity [float] Sensitivity of the model • specificity [float] Specificity of the model • timestamp [date] Time of model creation • dataset_size [integer] Size of the dataset used • trainingset_size [integer] Size of used training set
• testingset_size [integer] Size of used testing set, in LOOCV 1 • scaling [varchar(144)] What kind of scaling was used
• crossvalidation [varchar(144)] What kind of cross-validation was used • auc_data [json] Data for AUC curve, classes and their predictions per case • prediction [varchar(255)] What prediction was done
• pickle [varchar(255)] Pickle filename
datasets
The raw dumps of the datasets used in model training are stored here for possible future
validation. CLOBNET stores the dataset as JSON and calculates SHA224 hash for the dataset. If new dataset has identical information and identical hash, no new copy is stored, but current id of the same dataset is used.
• id [serial] Model identifier, primary key
• hash [varchar(512)] Hash of the dataset information • dataset [json] Dataset stored as a json
chemotherapy_data
Information on chemotherapy cycles.
• id [serial] Row identifier, primary key • pseudonym [varchar(20)] Patient idetifier
• patient_medication_id [varchar(40)] Patient-specific id of the medication administered • patient_cycle_id [varchar(40)] Patient-specific id of the chemotherapy cycle
• startday [smallint] Wether drug is administered on cycle starting day • calculation_date [date] Date of drug calculations
• calculated_bsa [float] Calculated Body Surface Area (BSA) • used_bsa [float] BSA used in drug calculations
• serial_number [smallint] Running number of cycles • cycle_id [varchar(40)] General id of the chemotherapy • cycle_name [varchar(255)] Cycle name
• cycle [smallint] Number of days in cycle • cycle_start_date [date] Start date of cycle • cycle_end_date [date] End date of cycle
• generic_name [varchar(255)] Generic name of cycle • dose [varchar(255)] Dose of cycle
• administration_serial_number [smallint] Administration running number • administration_definition [varchar(70)] Definition on administration • cycle_basic_dose [float] Basic dose in the cycle
• cycle_dose_definition [varchar(70)] Definition of cycle dosing • used_dose [float] Used dose
• adminisitration_id [varchar(18)] Id of the single administration
• administration_start_date [date] Start date of the drug administration • administration_end_date [date] End date of the drug administration • height [float] Height used in BSA calculation
• weight [float] Weight used in BSA calculation
clinical_data
The main table containing clinical information. As the research settings vary from disease to disease and from research to research, this table is the hardest to generalize. In the initial setting,
the clinical data table provides besides required identifier some more generic columns such as clinical end points but also some HERCULES program and ovarian cancer (OC) specific columns. General columns:
• id [serial] Row identifier, primary key • pseudonym [varchar(20)] Patient identifier
• status [varchar(20)] Status of the patient wether she is alive, deceased etc. • patient_id [integer] Another patient identifer used in HERCULES
• age_at_diagnosis [float] Age at the time of OC diagnosis • height_at_diagnosis [float] Height at the time of OC diagnosis • weight_at_diagnosis [float] Weight at the time of OC diagnosis • figo_2014_stage [varchar(10)] FIGO 2014 stage of OC at diagnosis
• primary_therapy_outcome [varchar(255)] Outcome of primary therapy: complete response, progressive disease and so on.
• treatment_strategy ** [varchar(255)] Primary debulking surgery (PDS), neoadjuvant chemotherapy (NACT) or no chemo.
diagnoses_data
Diagnoses by date as International Classification of Diseases 10th Revision (ICD-10) codes. • id [serial] Row identifier, primary key
• pseudonym [varchar(20)] Patient identifier • code [varchar(20)] Diagnosis as ICD-10 code • date [date] Date of diagnosis
height_weight_data
As the name says, stores height and weight data. No column for units, so possible unit conversion should be done before inserting data to this table.
• id [serial] Row identifier, primary key • pseudonym [varchar(20)] Patient identifier • height [float] Height
• weight [float] Weight
• date [date] Date of measurement
laboratory_data
Laboratory test results are stored in rows per patient and date, every different laboratory test on their own columns. This is suitable setup for research where no bigger temporal resolution than daily values are needed and the amount of different laboratory tests are moderate. Floating point data type does not allow additional information sometimes embedded to lab time series data such as textual notes about failed test etc. Following table structure is somewhat research-specific.
Like in height and weight column, no units are specified in laboratory_data table and possible conversions should be done before data input.
• id [serial] Row identifier, primary key • pseudonym [varchar(20)] Patient identifier • date [date] Date of measurement
• ca125 [float] Cancer antigen 12-5 (CA12-5), OC tumor marker • he4 [float] HE-4, another tumor marker
• hb [float] Haemoglobin
• tromb [float] Trombocyte count • neut [float] Neutrophile count • na [float] Sodium level
• krea [float] Creatinine • leuk [float] Leukocyte level
• alat [float] ALAT, alanine aminotransferase
• fmdate [string] Column for external research db purposes
medication_data
Information about medications, both at home or in hospital. • id [serial] Row identifier, primary key
• pseudonym [varchar(20)] Patient identifier • start_date [date] Start date of medication • end_date [date] Possible end date of medication • brand_name [varchar(512)] Brand name
• substance [varchar(512)] Generic name or the substance in the medication • atc_code [varchar(512)] ATC code
• home_medication [smallint] 1, if prescibed to home
• administration_unit [varchar(512)] Units in adminisitration • dose [varchar(128)] Dose
• administration_code [varchar(512)] code e.g. IV, po
• administration_definition [varchar(512)] textual definition of adminisitration • administration_dose [float] dose in administration
• regular_daily_dose [int] regular daily dose
• ondemanddose [varchar(512)] dose if taken only on demand
operations_data
This table stores data about the surgical operations and anesthesiology. NOMESCO Classification of Surgical Procedures (NSCP) is used as operation classification and ICD-10 as the diagnosis, if this is provided.
• id [serial] Row identifier, primary key • pseudonym [varchar(20)] Patient identifier
• decision_date [date] Date when the decision to operate was made • operation_date [date] Date when the opeartion was performed
• emergency [smallint] 1 if emergency or not planned operation, 0 if an elective surgery • main_operation [smallint] 1 if the code is for main operation, 0 if it is a secodary operation • asa_class [integer] ASA class for the operation, integer from 1 to 4
• ncsp_code [varchar(20)] Classification code for the surgery • diagnosis_code [varchar(20)] Disease diagnosis
pathology_data
Pathology table provides structure for basic information about pathology analysis. As some of the results or clinical background information can be extremely long texts, these are stored as text datatype.
• id [serial] Row identifier, primary key • pseudonym [varchar(20)] Patient identifier
• question [text] The main clinical question and background information about the sample • answer [text] Textual result of the analysis
• answer_id [text] Identifier for analysis
• assay_type [varchar(512)] Analysis type code
• date_of_sampling [date] Date of taking the sample to be analyzed • sender [varchar(512)] The name of the sending organization / clinicial
Algorithm True
positives negatives True positives False negatives False Accuracy Precision F1-Score
Logistic regression, C=0.1 17 57 21 2 0.76 0.45 0.60
Logistic regression, C=0.02 17 57 21 2 0.76 0.45 0.60
Logistic regression, C=0.02,
Balanced class weights 18 47 31 1 0.67 0.37 0.53
Bernoulli Naive Bayes 13 59 19 6 0.74 0.41 0.51
Gaussian Naive Bayes 15 45 33 4 0.62 0.31 0.45
Linear Support Vector Machine,
Balanced class weights 11 57 21 8 0.70 0.34 0.43
Random Forests, 50 estimators 5 77 1 14 0.85 0.83 0.40
Random Forests, 100 estimators 5 75 3 14 0.82 0.63 0.37
C-Support Vector Machine,
Balanced class weights 11 63 15 8 0.76 0.42 0.49
5 nearest neighbors 3 76 2 16 0.81 0.6 0.24
Decision tree 8 57 21 11 0.67 0.28 0.33
SUPPLEMENTARY FIGURE LEGENDS
Supplementary Figure 1. Cloud-based machine learning system (CLOBNET) schema. Information was gathered from multiple sources and melded into a single database and Structured Query Language (SQL) database. The data were then used to train machine learning (ML) algorithms, and the information was visualized using a web-based graphical user interface (GUI). CLOBNET = cloud-based machine learning system, EHR = electronic health record, CSV = comma separated values, SSH = secure shell, SQL = Structured Query Language, PHP = Hypertext preprocessor, AJAX = asynchronous JavaScript and XML, GUI = graphical user interface.
Supplementary Figure 2. Screenshot of CLOBNET graphical user interface combining different data sources to a single view for a clinician to get a complete picture of patient’s health. Age at
diagnosis, x-axis of laboratory data plot containing dates and pseudonyms are omitted to prevent identification.
Supplementary Figure 3. AUC curves of different machine learning models performing binary classification between progressive disease (n=19) and complete response (n=78) patients. AUC = area under the curve, SVM = Support Vector Machine. C = inverse of regularization strength.
Supplementary Figure 4. AUC curves of three different machine learning models performing binary classification between progressive disease (n=19) and complete response (n=78) patients using different input variable sets. In the left column: Figo2014 score, disease dissemination, age at diagnosis, treatment strategy, CA-125 level at diagnosis. In the center column: same as left plus platelet count, hemoglobin level, leukocyte count and sodium level at diagnosis. In the right
column: same as center plus previous C, E, F, I, K, N or O diagnosis from International Classification of Diagnoses 10 (ICD-10). AUC = area under the curve, C = inverse of regularization strength.
Supplementary Table 1. Binary classification performance of different machine learning algorithms in classifying between progressive disease (n=19) and complete response (n=78) patients, whose AUC curves are depicted in Supplementary Figure 2. C = inverse of regularization strength.