!"#"$%&&'()$*+%(,-."/0%1,-*(2- ---!"#"&*+$,-3*4%1*/%15- 6.789:;7!<-=9>37-;!6=7-=7- >9.?8@- .*+%(*#-7(/"1A6()B"1,)/5-C%(,%1+'&- D%1-!"#"$%&&'()$*+%(,-- !"#"$%&&'()$*+%(,-."/0%1,-*(2- ---!"#"&*+$,-3*4%1*/%15- 6.789:;7!<-=9>37-;!6=7-=7- >9.?8@- .*+%(*#-7(/"1A6()B"1,)/5-C%(,%1+'&- D%1-!"#"$%&&'()$*+%(,-- !"#"$%&&'()$*+%(,-."/0%1,-*(2- ---!"#"&*+$,-3*4%1*/%15- 6.789:;7!<-=9>37-;!6=7-=7- >9.?8@- .*+%(*#-7(/"1A6()B"1,)/5-C%(,%1+'&-
D%1-!"#"$%&&'()$*+%(,--Sustainable ICT in
corporate organizations
Printed in Switzerland Geneva, 2012 Photo credits: Shutterstock®About ITU-T and Climate Change:
itu.int/ITU-T/climatechange/
E-mail:
greenstandard@itu.int
September 2012
Acknowledgements
This document is part of the ITU Toolkit on Environmental Sustainability for the ICT sector which was edited by Jyoti Banerjee (Fronesys) and Cristina Bueti (ITU).
This document was researched and written by Jyoti Banerjee and Chris Tuppen (Fronesys), Flavio
Cucchietti (Telecom Italia), Ahmed Zeddam (France Telecom/Orange), Shailendra Mudgal (BIOIS), John Pflueger (Dell), Ray Pinto (Microsoft), Peter Thomond (Imperial College), Lutz-Guenther Scheidt and Constantin Herrmann (PE International AG), Harkeeret Singh and Julia Fuller (Thomson Reuters), Daniela Torres (Telefónica), Jean-Manuel Canet (France Telecom), Elena Barthe Garcia de Castro, Elvira Moya and Amjad Rihan (Ernst & Young), Sébastien Ziegler (Mandat International), Maria Morse (HP) and William Kosik (HP), Dave Faulkner and Keith Dickerson (Climate Associates), Peter Thomond (Imperial College), Giacomo Mazzone and David Wood (EBU), Richard Smith, Jigna Chandaria, Simon Tuff and Mariam Ali (BBC), Mamle Asare (Vodafone), Barbara Martini (Scuola Superiore Sant'Anna - Pisa) and Tom Baumann (GHG Management Institute/ClimateCHECK).
Special thanks are due to the contributory organizations of the Toolkit on Environmental Sustainability for the ICT Sector for their helpful review of a prior draft.
Additional information including the full list of contributory organizations can be found at: www.itu.int/ITUT/climatechange/ess/index.html
If you would like to provide any additional information, please contact Cristina Bueti at tsbsg5@itu.int.
Legal Notice This publication may be updated from time to time.
Third-party sources are quoted as appropriate. The International Telecommunication Union (ITU) and the contributory organizations are not responsible for the content of external sources including external websites referenced in this publication.
Disclaimer
The views expressed in this publication are those of the authors and do not necessarily reflect the views of the International Telecommunication Union (ITU), its membership or contributory organizations. Mention of and references to specific countries, companies, products, initiatives or guidelines do not in any way imply that they are endorsed or recommended by ITU, the authors, or any other organization that the authors are affiliated with, in preference to others of a similar nature that are not mentioned.
Requests to reproduce extracts of this publication may be submitted to: jur@itu.int
© ITU 2012
All rights reserved. No part of this publication may be reproduced, by any means whatsoever, without the prior written permission of ITU.
Sustainable ICT in corporate
organizations
Sustainable ICT in corporate organizations iii
Table of contents
Page Executive summary ... 1 Data centers ... 1 Desktop infrastructure ... 1Telecoms infrastructure and networks ... 2
Broadcasting services ... 2
The toolkit ... 2
1 Introduction ... 4
1.1 Objective and target audience ...4
1.2 A note on digital convergence ...5
2 Data centers ... 5
2.1 The main components of a data center ...6
2.2 Drivers impacting energy efficiency of a data center ...6
2.3 PUE is the key sustainability metric ...7
2.4 Managing other sustainability metrics ...9
2.5 Guidelines on sustainability in data centers ... 11
2.6 Best practices in data centers ... 12
2.7 KPIs for data centers ... 16
3 Desktop infrastructure ... 17
3.1 The elements of desktop infrastructure ... 17
3.2 Sustainability drivers in desktop infrastructure ... 17
3.3 Regulations and guidelines ... 20
3.4 Best practices on desktop infrastructure ... 20
3.5 Evaluation of the shift from one technology to another ... 24
3.6 Key performance indicators ... 26
4 Telecoms infrastructure and networks ... 26
4.1 The building blocks of a network ... 26
4.2 Sustainability impacts of a network... 28
4.3 Guidelines ... 29
4.4 Best practice energy efficiency in networks ... 30
4.5 Evaluating the shift from one technology to another ... 33
iv Sustainable ICT in corporate organizations
5 Broadcast services ... 34
5.1 The main activities of broadcasting ... 35
5.2 The building blocks of broadcasting ... 35
5.3 Measuring sustainability impacts in broadcasting ... 36
5.4 Guidelines and best practices ... 37
5.5 Broadcasting case studies ... 38
5.6 Key performance indicators ... 41
6 Checklists ... 41
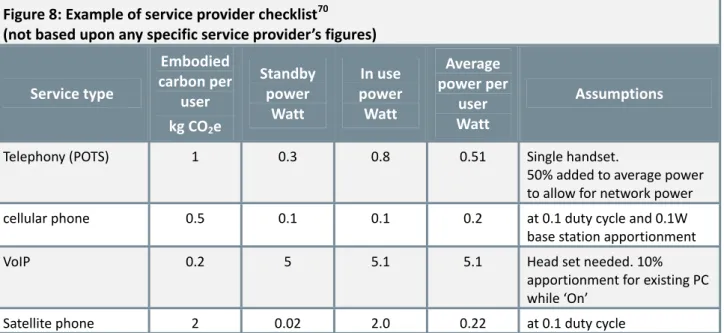
6.1 Service provider checklist ... 42
6.2 End user checklist ... 43
6.3 Data center energy checklist ... 44
6.4 Telecoms and networks energy checklist ... 45
6.5 Desktop energy checklist ... 45
6.6 Broadcasting checklist ... 46
7 Conclusions ... 46
7.1 Suggestions for ITU-T SG 5 ... 47
8 Glossary ... 49
Sustainable ICT in corporate organizations 1
Sustainable ICT in corporate organizations
Executive summary
The ICT sector has transformed the way organizations work, increasing productivity and driving increased economic output and trade across the globe. But there is a price to pay, and that is in the area of energy use. The Smart 2020 report confirmed that the full life cycle carbon footprint of the ICT industry represents around 2% of worldwide emissions, and is growing at 6% compound annual growth. To balance this, ICT has an enabling effect where by other sectors benefit from increased energy efficiencies and energy use reductions. The scale of this ICT-enabled opportunity was found to be equivalent to 15% of all global emissions by 2020.
This document, part of the Toolkit on environmental sustainability for the ICT sector from ITU-T, focuses on
the main sustainability issues that companies face in using ICT products and services in their own
organizations across four main ICT areas: data centers, desktop infrastructure, telecommunications networks and broadcasting services.
Overall, the level of sophistication with sustainability metrics and management is highest in the area of data centers, with much more work needing to be done with desktop infrastructure, broadcasting and telecoms networks.
Data centers
Historically, the main objective of data center managers has been to maximize their computing performance and expand the availability of IT resources. The costs associated with delivering these capabilities, such as electric power and cooling, were generally accepted as a given cost of doing business. However, data center costs have risen extremely quickly as the rate of increase of data processing has outpaced the center’s ability to support such systems. As a result, environmental factors such as energy and water have become the main limiting factor in the data center environment.
The key sustainability metric for data centers is PUE, or power usage effectiveness. This metric has been agreed upon by major industry bodies, as well as governments. It is a very useful relative metric and its greatest benefit comes from widespread sharing of such data. However, PUE takes account of the facility side only, not taking business use into consideration. As a result, this document outlines a number of other IT efficiency and utilization metrics that data center managers can use to enhance their sustainability performance.
A key benefit of using industry-wide definitions and standards of energy efficiency is the adoption of an agreed set of best practices. This document captures some of the best practice measures that data center managers can use. In line with the data center maturity model, these best practices are linked to suitable metrics to measure and manage performance.
Desktop infrastructure
Much of the energy consumed by IT equipment is wasted, mostly because computers are on with no one using them, such as during nights and weekends.
2 Sustainable ICT in corporate organizations
Power draw of PCs is a well-known factor impacting their energy consumption, but there are culprits beyond the PC, with energy consumed by the Ethernet link and the workgroup switch, which usually have no means of power management.
A 2004 study on office equipment power management found that an average office computer is active for 6.9 hours in a day, of which it is idle for 3.9 hours. The challenge is ensuring the computers are in low-power mode during idle periods, and off when not active. Apart from their direct power draw, PCs also have an indirect impact on their surroundings by heating them, causing a greater load on air-conditioning systems, for example.
This document outlines best practices on desktop infrastructure, covering the use of energy-efficient PCs, management of their power requirements, use of alternative data management techniques such as virtualization, and the use of software to measure and manage the environmental performance of desktop infrastructure.
Telecoms infrastructure and networks
Telecoms network infrastructure and devices are responsible for over a third of the ICT industry GHG emissions, according to the Smart 2020 report. Thanks to new technologies and energy-efficient products, the energy usage per device is improving. Further, the introduction of packet switching (a key feature of the Internet) is simplifying network topologies and lowering their energy requirements by 30-40%.
There are a number of metrics that can be used to measure power utilization in a network. ETSI recommends measuring the power consumption of DSLAM per subscriber line as well as the power needed to transport 1 Mbit/s of data over a kilometre. Recommendation ITU-Y.3021 takes the inverse approach to the ETSI measures by defining its metric as the throughput of networks divided by the power consumed. Similar metrics have been defined by GSMA for mobile infrastructure.
The adoption of the codes of conduct established for data centers and broadband networks could result in significant savings in energy consumption. A number of best practice issues emerge. These include server consolidation, virtualization, “switch-off” policies for redundant equipment, DC electricity and the use of software to understand and manage energy use.
Broadcasting services
Energy is a key consideration in an industry which uses bright lights, huge audio and video files, and widespread networks. Yet, it is estimated that around 80% of the industry’s carbon emissions relate to the in-use emissions of their customers in accessing the output of the broadcasting industry.
The industry has started exploring and using sustainability metrics relatively recently – so these metrics are not as sophisticated as their counterparts in, say, data centers. However, delivering a broadcasting service usually requires the use of desktop infrastructure, networking, data centers, and telecommunications. So, environmental improvements in any of those areas are potentially beneficial to the sustainability performance of a broadcasting service.
The toolkit
This document on Sustainable ICT in organizations is part of a set of documents that together form the Toolkit on environmental sustainability for the ICT sector. The toolkit is the result of an ITU-T initiative, carried out together with over fifty partners, which provides detailed support on how ICT companies can
Sustainable ICT in corporate organizations 3 build sustainability into the operations and management of their organizations. The documents in the toolkit cover the following:
• Introduction to the toolkit.
• Sustainable ICT in corporate organizations, focusing on the main sustainability issues that companies
face in using ICT products and services in their own organizations across four main ICT areas: data centers, desktop infrastructure, broadcasting services and telecommunications networks.
• Sustainable products, where the aim is to build sustainable products through the use of
environmentally-conscious design principles and practices, covering development and manufacture, through to end-of-life treatment.
• Sustainable buildings, which focuses on the application of sustainability management to buildings
through the stages of construction, lifetime use and de-commissioning, as ICT companies build and operate facilities that can demand large amounts of energy and material use in all phases of the life cycle.
• End-of-life management, covering the various EOL stages (and their accompanying legislation) and
provides support in creating a framework for environmentally-sound management of EOL ICT equipment.
• General specifications and key performance indicators, with a focus on the matching environmental
KPIs to an organization’s specific business strategy targets, and the construction of standardized processes to make sure the KPI data is as useful as possible to management.
• Assessment framework for environmental impacts, explores how the various standards and guidelines
can be mapped so that an organization can create a sustainability framework that is relevant to their own business objectives and desired sustainability performance.
Each document features a discussion of the topic, including standards, guidelines and methodologies that are available, and a check list that assists the sustainability practitioner make sure they are not missing out anything important.
4 Sustainable ICT in corporate organizations
1
Introduction
The ICT sector has transformed the way organizations work. Whether it is mobile phones, cloud computing or the Internet, the use of ICT has changed the processes, methods, products and services of business around the world. As a result of the use of ICT products and services, business has seen its productivity increase and the world has benefited from increased economic output and trade across both developed and developing countries.
But what impact do pervasive information and communication technologies have on the planet’s environment? Does ICT help deal with sustainability problems or does it cause greater problems? The
biggest price to pay is in the area of energy use. The Smart 2020 report1 proved a seminal point in
understanding the relationship between ICT and energy use. Since its publication in 2008 there have been country level versions in China, Germany, Portugal and USA. Smart 2020 confirmed that the full life cycle carbon footprint of the ICT industry represents around 2% of worldwide emissions and that the ICT footprint is projected to grow under business-as-usual (BAU) conditions at a 6% compound annual growth
rate to 1.4 GTonnes of CO2 by 2020.
Although its own emissions are rising, ICT’s largest influence is expected to be through enabling increased energy efficiencies and energy use reductions in other sectors. In this context, Smart 2020 also provided the
first ever comprehensive analysis of the capacity of ICT to reduce CO2 emissions across the rest of the
economy. The scale of this ICT-enabled opportunity was found to massive at 7.8 GTonnes of CO2 by 2020
equivalent to 15% of all global emissions under the BAU projection. Corporate organizations can benefit from these efficiencies, but also have to learn to control the energy use of ICT products.
This document focuses on the main sustainability issues that companies face in using ICT products and services in their own organizations across four main ICT areas:
• data centers;
• desktop infrastructure;
• telecoms and networks;
• broadcasting services.
In each case there will be a number of sustainability impacts to consider. These include the raw materials (including hazardous substances, trace elements, etc.) and energy used in the manufacture of the components of the network, and end-of-life issues relating to the disposal or recyclability of equipment that is no longer used. These issues are treated elsewhere in Sustainability Toolkit, and therefore the focus of this section is on the single biggest sustainability impact of a network: the power consumed to operate it, and the consequent impacts relating to greenhouse gas emissions.
1.1
Objective and target audience
This document aims to help ICT professionals and business leaders understand the sustainability impacts of the digital products, services and technologies they use, so that they can measure those impacts, and manage them.
In each area, there is a focus on the key drivers impacting energy efficiency, and how they can be used as levers for changing energy efficiency in a business. Practical metrics are discussed, which can help in the process of measurement and management.
1
Sustainable ICT in corporate organizations 5 The discussion, where possible, is grounded in the context of guidelines, regulations and best practices that already exist, or are in the process of being developed. One of the great advantages of using a standardized set of guidelines is that it makes comparability with other companies much easier, added to the experience gained from others.
Of the three areas covered, data centers demonstrate by far the greatest level of sophistication in terms of metrics, guidance and standards for managing energy consumption.
1.2
A note on digital convergence
One of the main challenges in putting together a document which ranges across all ICTs is the great deal of convergence that is occurring. Convergence means it is no longer easy to place ICTs into discrete categories and, in practice, businesses rarely, if ever, use just one category.
For example, IT is not separate to the telecommunications infrastructure, but is a component of it, and vice versa. A company with desktop infrastructure might also have one or more data centers, and use private and public networks for moving content around.
One of the consequences of this is that a technology such as virtualization, which could play out in the context of either desktop infrastructure or data centers, can (and does) feature in both sets of discussions. There is some redundancy in this, but the main goal is to make sure that each individual section is reasonably complete in itself, even if this does cause some duplication of discussion across the sections of this document.
2 Data
centers
Historically, the main objective of data center managers has been to maximize their computing performance, and expand the availability of IT resources. The costs associated with delivering these capabilities, such as electric power and cooling, were generally accepted as a given cost of doing business. However, more recently, the rate of increase of data being processed and advancement of server technology has outpaced the data center’s ability to support such systems.
As a result, energy is the main limiting factor in the data center environment, not only in terms of financial budgets, but also with respect to availability of grid connection capacity, and in terms of its environmental impact. The significant upswing in cloud computing is accelerating the growth of the data center, but is also creating sustainability challenges for the owners and operators of such facilities. This growth is particularly significant for those companies providing services such as Software as a Service, Platform as a Service or Infrastructure as a Service. From the perspective of corporate organizations that hire such cloud computing services, they benefit from a decrease in their own data center infrastructure.
There are a number of estimates of total global data center energy consumption and related carbon dioxide
emissions. It is generally accepted that data centers are responsible for at least 0.25% of all CO2 emissions;
just over 10% of all ICT-related emissions. However, they are one of the fastest growing parts of the ICT sector. Even with new technologies allowing servers to do more with less power, the compound growth rate
of data center energy consumption is racing ahead at around 10% per annum.2
2
Tuppen, C.G., and Raub, C., “Are ICT emissions running ahead of expectations?,”
www.btplc.com/Responsiblebusiness/Ourstory/Literatureandezines/Publicationsandreports/PDF/Are_ICT_Emissions_Running_ Ahead_of_Expectations.pdf.
6 Sustainable ICT in corporate organizations
As a result, the energy efficiency of data centers is receiving a lot of attention within the industry, and from
environmental campaign groups such as Greenpeace3.
2.1
The main components of a data center
A data center is a resilient facility the primary purpose of which is to securely house computing equipment. This network typically includes: IT equipment such as computing devices (e.g. servers, storage and networking equipment), cooling equipment such as air-conditioning units, power systems such as diesel generators (for backup purposes), uninterruptible power supplies, and supporting infrastructure. A data center may be wholly owned and occupied by one organization, or typically delivered ‘As a Service’ to many organizations.
A data center can occupy a single room in a building, or it can cover an entire building. Some data centers cover a campus of buildings. Most of the equipment is in the form of rack-mounted servers, with further infrastructure in the form of backup power, lighting, and environmental controls, dealing with temperature and humidity. Some of the infrastructure is designed to help manage the performance of both the IT and facility elements of a data center.
2.2 Drivers
impacting
energy
efficiency of a data center
IT equipment energy consumption and cooling are related sustainability issues because they both require energy, which is increasingly expensive, and, when derived from fossil fuels, contributes to climate change. Yet, it is only fairly recently that those IT managers have started to consider energy performance, or even thermal characteristics of their server equipment. Due to increases in power costs, energy has become one of the largest costs in the Total Cost of Ownership (TCO) of a data center. The rise in energy costs, future trends on energy, the additional regulatory costs of carbon now applied in certain countries such as Australia and across the EU, and the development of carbon policy mechanisms are all making data center managers and owners take this more seriously, from a business perspective.
As data center managers seek to improve their resource performance, here are some of the key issues they face:
• Improved monitoring – Many IT managers are not aware of the energy metrics relating to their IT
equipment.
• Power-handling efficiency – When a server consumes electric power, it generates heat, which needs to
be dealt with by the cooling infrastructure, which in turn needs energy to operate. Hence, improving the energy efficiency of a server has the potential of creating significant knock-on reductions in energy usage, but only if the facility power/cooling scales with IT power consumption.
• Cooling is a limiting factor – A data center may be able to add electric power instantaneously, if it is
prepared to pay the price for more electricity, but providing more cooling infrastructure is much more difficult and takes more time.
• Power is also a constraining factor: is there power available in the grid, and even if there is, that power
needs to be conditioned, typically using Uninterruptible Power Supplies (UPS). In effect, UPS resilient capacity ends up being a constraining factor, and requires investment even if it were possible to buy additional power from the grid.
3
For an example of a Greenpeace report on data centers, see
www.greenpeace.org/international/Global/international/publications/climate/2011/Cool%20IT/dirty-data-report-greenpeace.pdf.
Sustainable ICT in corporate organizations 7 • Availability of low carbon electricity. As they strive to reduce their carbon footprint, data center
operators are increasingly being located near renewable sources of electricity. However, this only benefits those who can choose their location site when building a new data center. Many organizations are constrained, due to existing facilities or other requirements, such as proximity to the customer or the business, etc.
2.3
PUE is the key sustainability metric
Although energy efficiency metrics are gaining common usage among data center owners and managers, it has proved difficult to apply the metrics clearly or consistently. However, there is now an agreement between major data center industry bodies and the US, EU and Japanese governments on the composition
and measurement of Power Usage Effectiveness, usually referred to as PUE.4
Over the past few years, the key metric that has been gaining ground is PUE, which is the measurement of the total annual energy of the data center divided by the annual IT energy consumption. If the entire energy consumption of the IT resources in the data center also happens to be the energy consumption of the data center as a whole, then the PUE would be 1.0.
Figure 1: PUE metrics, sourced from the Green Grid5
PUE Level of efficiency
3.0 Very inefficient
2.5 Inefficient
2.0 Average
1.5 Efficient
1.0 Very efficient
In practice, a data center consumes more energy than what it uses for its IT resources, in order to feed cooling systems, lighting, and power delivery components. If a data center has a PUE of 2.0, this indicates that for every 100 watts of power needed by the IT infrastructure, the data center needs to draw 200 W from the utility grid.
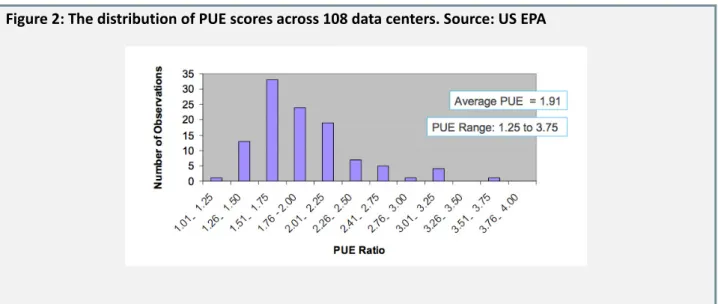
Unfortunately, there is no comprehensive, transparent, publicly available data set publishing accurate PUE statistics for data centers, though the move towards global harmonization should help improve matters. In
2010, the US EPA studied the PUE of 108 US data centers and published the following PUE distribution:6
4
“Recommendations for Measuring and Reporting Overall Data center Efficiency,” Data center Metrics Task Force, May 2011. 5
www.thegreengrid.org/~/media/White_Paper_6_-_PUE_and_DCiE_Eff_Metrics_30_December_2008.ashx?lang=en. 6
8 Sustainable ICT in corporate organizations
Figure 2: The distribution of PUE scores across 108 data centers. Source: US EPA
An HP study covering 97 sites (measured between 2008 to 2011, with 65 in the Americas, 21 in Europe, Middle East and Africa, and 11 in Asia Pacific and Japan) concluded that the PUE average for global data centers is higher than the average for US-based data centers.
Figure 3: HP data on the distribution of PUE scores across 97 sites
Although PUE is the standard measure, it is only part of the picture – it is a good relative metric but it takes
account of the facility side only.7 PUE does not take into consideration consumption; therefore, it does not
at all account for actual business use.
When viewed in isolation, PUE can also cause unexpected results. For example, data centers which use virtualization techniques (where a number of physical servers are consolidated onto a single computing device) can end up with PUE scores that, perversely, are higher than those without virtualization, even
7
For a full picture of data center efficiency, metrics relating to the IT side of the center need to be added to PUE, which is a metric relating to the facility side of a data center. See the discussion later in the document relating to the data center maturity model. <1.25 1 .26 - 1. 5 1 .51 - 1. 75 1 .76 - 2. 0 2 .01 - 2. 25 2 .26 - 2. 5 2 .51 - 2. 75 2 .76 - 3. 0 3 .01 - 3. 25 3 .26 - 3. 5 3 .51 - 3. 75 >3.75
PUE ratio
Number of observations Average PUE: 2.21 PUE range: 1.46 to 4.96Sustainable ICT in corporate organizations 9 though the latter are less efficient. This example demonstrates that cooling and UPS equipment become less efficient at lower loads. As servers are turned off, power demand decreases and this result in more energy being used across the site. This is an example of the importance of an integrated approach to IT and facilities planning. Finally, increasingly, some of the latest cooling techniques, such as pumps and heat exchangers, or battery backup are built into the IT equipment itself, blurring the lines between facility equipment and IT equipment.
So is it worth pursuing such a metric?
The consensus in the industry is that it is not only worth measuring data center efficiency using such metrics, it is also worth sharing the results of the measurements, as it improves our understanding of what contributes to energy efficiency of IT resources.
Of course, PUE is not a static metric. It is undergoing developments led by The Green Grid, which enables
greater granularity by breaking it down into the following components8:
PUE = Cooling Load Factor (CLF) + Power Load Factor (PLF) + 1.0 All the above factors are ratios:
• 1.0 represents the normalized IT load
• CLF is the total power consumed by chillers, cooling towers, computer rooms air conditioning, pumps,
etc., divided by the IT load
• PLF is the total power dissipated by switch gear, UPSs, power distribution units, etc., divided by the IT
load.
The PUE can also vary during a year due to changing weather conditions and so it is best to measure and publish 12 monthly average figures. This requirement is also emphasized by the global harmonization agreement on data center metrics.9 As cooling is heavily linked with the external environmental conditions (outside ambient temperature), data centers located in geographic areas that have higher average outside ambient air temperatures generally have higher cooling requirements and thus increased consumption of power. One choice is that the data center can be located in a cooler geographic area, and thus be able to utilize free cooling; however, the choice of the location is at times limited by business/operational constraints.
This is an important concept to embrace knowing that combinations of different cooling systems and locations will result in PUE values that can range from 1.30 to over 1.70.
2.4
Managing other sustainability metrics
Although there is wide industry support for PUE, using only one metric may not be an adequate measurement strategy, and may not lead to either cost savings, or resource efficiencies.
According to Rhonda Ascierto, senior analyst at Ovum, “PUE only measures the efficiency of a facility’s infrastructure, such as air conditioning and lighting. Judging a data center on PUE alone is akin to judging a company’s performance solely on earnings per share. The ways in which data centers consume resources
are complex and multi-dimensional, and multiple metrics are needed to properly gauge their efficiency.”10
8
PUE and DCiE Efficiency metrics. 9
“Harmonizing Global Metrics for Data Center Energy Efficiency,” Energy Star, 2010,
www.energystar.gov/index.cfm?c=prod_development.server_efficiency. 10
10 Sustainable ICT in corporate organizations
The Green Grid itself points to metrics11 that connect well with sustainability management needs:
• water usage effectiveness (WUE) – annual water usage divided by IT equipment energy, and expressed
in litres/kilowatt-hour;
• carbon usage effectiveness (CUE);
• proxies for data productivity;
• data center maturity model.
Note that water and carbon/power metrics are related as water treatment itself can be an energy-intensive process. For example, desalination of sea-water uses far more energy than extracting water from a
snowmelt-sourced reservoir. Also note that there are two variations to the WUE metric: WUEsite, which
relates to site consumption, and WUEsource which accounts for source consumption.
The data center maturity model is worth pointing to separately as it adds in a number of IT efficiency and utilization metrics, such as average monthly CPU (processor) utilization, IT power supply efficiencies, network utilization, and e-waste.
All of these metrics together help data center operators to quickly assess important sustainability aspects in their data centers, compare results, and determine opportunities to increase energy efficiency or reduce power consumption.
A metric that is more commonly used in networking relates to watts per user, or watts per gigabyte. Such a metric circumvents the problem where data centers end up with worsened PUE scores when they turn off unused compute capacity, even though such a practice is better in business terms. More work needs to be done to establish whether or not measure such as watts per user would have utility in the data center context.
Another metric worth considering aims at those facilities that have combined heat and power (CHP) plants – or the related combined cooling heat and power plants (CCHP). On-site power generation is better because power loss occurs over the transmission distance (anywhere from 7% to 30%). However, while a local power unit does not suffer from such losses, it could have lower efficiency than the big power plants. Provided the heat generated can be effectively used (e.g. co-tri-generation systems), this process can work for data centers as energy can be converted to cold air using efficient heat pumps.
For PUE calculations to be equitable, when data centers operate on-site electricity generation, IT managers need to take account of the IT source energy conversion factor (so they can benefit from the efficiencies of generating chilled water, for example) and the cogeneration input fuel assumption (the shares of input fuel
from primary and secondary sources).12
Finally, there are other metrics that can be considered:
• ITEU (IT equipment utilization)
• ITEE (IT equipment energy efficiency)
• GEC (green energy coefficient), and
• DPPE (data center performance per energy).
11
The Green Grid, “Water Usage Effectiveness: A Green Grid Data center Sustainability Metric,” 2011. 12
“Recommendations for Measuring and Reporting Overall Data center Efficiency,” Data center Metrics Coordination Task Force report representing 7×24 Exchange, ASHRAE, The Green Grid, Silicon Valley Leadership Group, US Dept of Energy Save Energy Now program, US EPA ENERGY STAR Program, US Green Building Council and Uptime Institute, May 2011.
Sustainable ICT in corporate organizations 11 Figure 4 shows how these different metrics compare with each other:
Figure 4: Comparing different data center metrics
Parameters used in the metrics Type of
information PUE ITEU ITEE GEC DPPE Total energy consumption of data center Dynamic
Energy consumption of ICT equipment Dynamic
Green energy produced and used in data center
Dynamic
Rated power of ICT equipment Static
Server capacity Static
NW equipment capacity Static
Storage capacity Static
Currently, ITU-T is studying metrics for data centers. A new ITU-T Recommendation on metrics is expected to be approved by the end of 2012.
2.5
Guidelines on sustainability in data centers
Often the most common reason driving behavioural change in a business context is a change in regulation. However, there are no significant regulations that directly apply when it comes to driving sustainability performance in data centers. However, in a number of countries there will be general legislation addressing climate change and energy efficiency that affect data center operations. In addition, the motivation for managing sustainability performance will include other external forces, such as pressure from NGOs, investors, and customers. At the end of the day though, it just makes great business sense to curb the greatest cost inputs for some of the biggest financial investments a technology business can make.
EU Code of conduct
In 2010, the European Commission announced an EU Code of Conduct for Data centers, following on from codes of conduct that have been developed for external power supply units, uninterruptable power supplies, broadband and digital TV services.
A code of conduct is a voluntary commitment of individual companies, which own and operate data centers – including collocated centers – which aim to reduce their energy consumption, against a Business as Usual scenario, through the adoption of best practices in a defined timescale.
Companies that want to participate in the EU Code of Conduct need to submit an application, which covers an initial energy measurement, and an energy audit that identifies major energy saving opportunities. Once an action plan is accepted, participants need to deliver progress accordingly.
A McKinsey report found that a typical enterprise data center cost USD 150 m to build in 2003 and the costs
had risen to many times that number over a five-year period.13 By 2008, Google appeared to be spending
nearly USD 3 000 per square foot on its data center in North Carolina, which is approximately three times
13
12 Sustainable ICT in corporate organizations
the expenditure of the average industry. Microsoft’s Northlake, Illinois data center cost the company around
USD 500 m in the same time period.14
Analyst Gartner points out that those high-density data centers, which usually require more cooling and
power, need to modernize their operations, or risk doubling their energy costs every five years.15
When investments reach this scale, visibility is raised and approval is required from senior company executives and even Boards of Directors so that operational performance takes on greater importance. This is because legacy data centers are notorious for server utilization rarely exceeding an annual average of 6%. So the best case for introducing sustainability metrics into the management process of a data center is that they offer an immediate understanding of some of the biggest drivers of cost and performance for key IT resources, while dealing with the negative developments associated with data center management. One example of such an interaction between business imperatives and energy savings comes from the move to high density computing, where racks which would have been rated at 4-8 kW of electricity in the past are now rated at 32 kW. The result of this kind of approach is that much more heat is generated, but some organizations are employing thermal monitoring, in products such as CA ecoMeter software, in order to re-provision virtual instances of infrastructure to a different physical location in the data center, when hotspots are created.
The US Environmental Protection Agency (EPA) has an Energy Star rating for stand-alone or large data
centers.16 Data centers can benchmark their energy performance against their peers, and the top quartile
performers can earn the Energy Star award. The US Green Building Council’s LEED program and BREEAM’s data center programme are both good examples of an industry’s response to the need to reduce energy use in data centers.
Further, a global taskforce of representatives from the US, European Union and Japan have been developing a harmonized set of global metrics which capture an agreed set of definitions for data center energy efficiency. An EU code of conduct for data centers exists, following on from codes of conduct developed for
other ICT equipment.17
Finally, higher reliability systems generally have higher overall electrical system losses as compared to a lower reliability system. As a result, when calculating annual energy consumption of a data center, it is advisable to include a schedule on the IT load that more closely resembles the actual operational schedule of the IT equipment, thus providing a more accurate estimate of energy consumption. Such a schedule needs to contain the predicted daily or weekly operations of the computers on a network (based on historical workload data), but more importantly, it also needs the long-term ramp-up expected, of computers and their power requirements. This type of information makes the planning and analysis of overall annual energy consumption more accurate.
2.6
Best practices in data centers
One of the main advantages of using an industry-wide definition of energy efficiency is the adoption of an agreed set of best practices. Data center operators benefit from:
• A common and agreed vocabulary and terminology
• A shared understanding of the technology options available, and their relative merits
14
Miller, R., “Google Data centers: $3,000 A Square Foot,” Data center Knowledge, Nov. 2007. 15 See www.infoworld.com/d/mobilize/gartner-modernize-datacenters-or-risk-doubling-energy-costs-562. 16 www.energystar.gov/index.cfm?c=prod_development.server_efficiency. 17 http://re.jrc.ec.europa.eu/energyefficiency/html/standby_initiative_data_centers.htm
Sustainable ICT in corporate organizations 13
• The processes they need to establish in their own facilities, and with the administrators of the code of
conduct
• The communication that is necessary across all participants
• Guidance on how to improve energy efficiency.
A detailed set of best practices for data centers, aimed at reducing their environmental impact, has been
published by the ITU. Recommendation ITU-T L.130018 helps data center operators and owners build future
facilities as well as improve existing ones.
The best practices identified cover the following areas of data center operation:
Table 1: Data center best practices
Issue Notes
Data center utilization and management Effective communications between different departments; resilience level and provisioning
ICT equipment Selection, deployment and management of new and existing IT and telecom equipment
Cooling Airflow design, cooling, free and economized cooling, cooling plant, CRAC units, reuse of waste heat
Data center power Selection, deployment and management of data center power equipment
Other data center equipment General practices
Data center building Building physical layout and geographic location
Monitoring Energy use and environmental measurement, data logging, reporting
Design of network Requirements to connect equipment in the data center as well between data centers
The biggest challenge with green data centers is that the technical challenges and business challenges are interlaced together, with different lines of authority, responsibility and budget. Best practices have to stretch beyond just technical considerations. The Uptime Institute’s white paper, Four metrics define data
center greenness,19 provides an excellent way of breaking up the formidable task of data center efficiency
into manageable chunks.
The four metrics, which reflect the data center maturity model metrics, are:
1) IT strategy
CIOs/CTOs should ask themselves, How can we achieve our business objectives with less energy by
considering different IT design, architecture, and hardware options to achieve computing and network availability, reliability and performance?
2) IT hardware asset utilization, or average monthly CPU utilization
CIOs/CTOs and senior data center executives should ask themselves, How can I maximize the fraction
of my IT hardware assets which are deployed productively and fully utilized?
18
Recommendation ITU-T L.1300 – Best Practices for Green Data centers, International Telecommunication Union, Nov. 2011. 19
14 Sustainable ICT in corporate organizations
3) IT energy and power efficient hardware deployment, including measures such as power supply efficiencies, and fan power improvements, for example
IT architecture and capacity planning executives and purchasing managers should ask themselves, How
can I select and justify buying IT hardware that delivers the most effective computing performance per Watt of power consumption at the plug?
4) Site physical structure overhead, based on PUE metrics
Facilities and real estate decision makers should ask themselves, How can I maximize the amount of
useful power/energy delivered to the power plugs of IT hardware for each unit of power/energy consumed at the data center utility meter and thereby reduce site infrastructure “overhead?”
So what specific strategies can data center managers use to further improve their sustainability
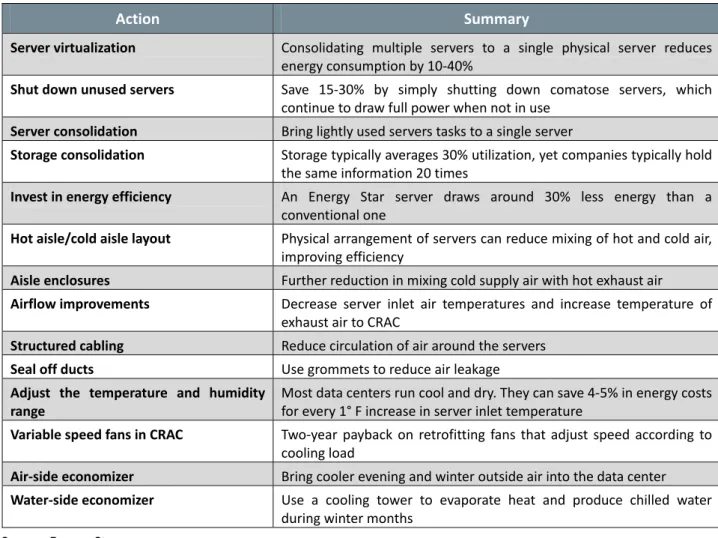
performance? Energy Star proposes20 the top twelve actions that data center managers can implement in
order to benefit from energy efficiency. A summary is provided in Table 2 below:
Table 2: Top energy efficiency actions for data center managers
Action Summary
Server virtualization Consolidating multiple servers to a single physical server reduces energy consumption by 10-40%
Shut down unused servers Save 15-30% by simply shutting down comatose servers, which continue to draw full power when not in use
Server consolidation Bring lightly used servers tasks to a single server
Storage consolidation Storage typically averages 30% utilization, yet companies typically hold the same information 20 times
Invest in energy efficiency An Energy Star server draws around 30% less energy than a conventional one
Hot aisle/cold aisle layout Physical arrangement of servers can reduce mixing of hot and cold air, improving efficiency
Aisle enclosures Further reduction in mixing cold supply air with hot exhaust air
Airflow improvements Decrease server inlet air temperatures and increase temperature of exhaust air to CRAC
Structured cabling Reduce circulation of air around the servers
Seal off ducts Use grommets to reduce air leakage
Adjust the temperature and humidity range
Most data centers run cool and dry. They can save 4-5% in energy costs for every 1° F increase in server inlet temperature
Variable speed fans in CRAC Two-year payback on retrofitting fans that adjust speed according to cooling load
Air-side economizer Bring cooler evening and winter outside air into the data center
Water-side economizer Use a cooling tower to evaporate heat and produce chilled water during winter months
Source: Energy Star
Some improvements, such as aisle containment, can be retrofitted to existing data centers, whereas others, such as DC distribution, are more easily introduced when starting from scratch.
20
Sustainable ICT in corporate organizations 15
Aisle containment
Most data centers have standardized on a hot aisle/cold aisle layout as a strategy for more efficient cooling. A cold aisle has server racks aligned so that equipment air inlets are facing each other on opposite sides, while in the next aisle, both banks of server racks exhaust hot air. In theory, such a layout increases energy efficiency by allowing for higher temperature set points. By concentrating cooling air where it is needed most, computer room air conditioners (CRAC) and computer room air handlers (CRAH) can run a few degrees higher than what would otherwise be the case.
However, such techniques bring their own challenges to data center operators. The key problems occur when the cool air fails to enter the IT equipment (known as “bypass air”), or when heated exhaust air flows back into the cold aisle through over the tops of the racks, or through open rack space.
As a result of these challenges, hot aisle/cold aisle techniques have been refined to cover aisle containment strategies, where the goal is to capture the hot exhaust from IT equipment and direct it to CRAC or CRAH units as quickly as possible, using barriers such as curtains, cabinet-mounted chimneys and metal enclosures to separate the hot aisle. Aisle containment systems are economically viable if elevated air temperatures are supplied. High inlet temperatures can affect ICT equipment, a fact that is seeing greater attention from ICT equipment manufacturers and from ASHRAE (the American Society of Heating, Refrigerating and Air-conditioning Engineers).
DC distribution
In a typical data center, power arrives at the server room as AC, where it gets converted to DC in the uninterruptible power supplies. It is then converted back to AC to be transported to other parts of the facility and then back to DC again by the power supply inside each server, router, load balancer or other piece of network equipment.
Each time power is converted, energy is lost as heat with an associated cost. As a result, there is a lot of interest of getting data centers to run on DC power, just like telecom equipment has done for years. Of course, the biggest challenge with implementing DC power is converting equipment right across the data center to run on DC. What would also help are vendor standards for plugs, power cords, rectifier units and other DC gear.
As a result, standard specifications are now being developed by ITU and IEC working groups, covering the
interface21 of a DC power feeding system, and its architecture.22 ETSI released EN 300 132-3-1 standard
covering the use of 400 V DC as a power feed for a data center.
Fresh air cooling
Mechanical cooling devices are estimated to consume between 33-40% of a facility’s energy consumption. So the idea that fresh ambient air can be introduced to supplement or circumvent cooling processes is an attractive one.
The basic concept of fresh air cooling is that outside air is brought into the data center facility and distributed via a series of dampers and fans. The servers take in the cool air, transfer heat and expel hot air to the room. Instead of being recirculated and cooled again, the hot air is simply directed back outside the
21
Recommendation ITU-T L.1200 – Specification of DC power feeding system interface, International Telecommunication Union, May 2012.
22
Draft of architecture of DC power feeding systems (L.architecture), Study Group 5, TD 946 (GEN/5), International Telecommunication Union, September 2011.
16 Sustainable ICT in corporate organizations
building. If outside air is particularly cold, then the air economizer can mix inlet air and exhaust air in order to ensure that the resulting air temperature is suitable for use with the equipment.
How effective is such a process? For example, a Weatherite white paper23 claims that, if a UK data center
has cold aisle containment, the cooling system can be controlled to keep the containment to 27°C resulting in the data center being cooled 24/7 for the whole year using just outside fresh air based on UK average temperatures. This solution could be adopted in areas of higher ambient air temperatures if the IT equipment itself was designed to operate at higher temperatures. Work is being undertaken in standards organizations such as ETSI and ASHRAE as well as in other areas (e.g. EC Code of Conduct) to push for a wider and, in particular, a higher operating temperature range.
In addition to the direct air economizer systems described above, indirect air economizer systems are very efficient and offer an alternative approach, particularly where the use of outdoor air is not possible. These systems use wet and/or dry heat surfaces to exchange heat between outdoor air and indoor air without mixing the two airstreams.
Case study: Logicalis
Logicalis, part of the Datatec Group, is an international IT solution and managed services provider, based in the UK. As part of its services to its customers, Logicalis provides a number of data center hosting solutions: the customer runs their environment as one slice of a shared platform, or on a separate infrastructure. Logicalis sees its work in sustainability as delivering against its own environmental goals as well as in improving business performance. As a result, the company maintains a hard business focus on its sustainability work.
Logicalis is constantly seeking new ways of measuring and improving its sustainability performance. Metrics such as PUE are seen to have delivered gains in data center efficiency, but much of the potential savings have already been achieved. Simon Daykin, chief technology officer at Logicalis, explains it this way: “If our focus is too high on PUE, we could simply turn on more computing capability but not use it. This does not make business sense. It is better to have a higher PUE with a lower capacity, when we don’t need computing resources. The PUE score is not as good because there are fixed loads we cannot turn off.”
Currently, Logicalis measures all sorts of performance metrics, including PUE: Watts per active server, server utilization, numbers of users, and measurements that meter the applications and infrastructure layers. The company uses software products from CA Technologies to monitor and capture sustainability data across the data center.
“The biggest challenge is pulling together a holistic view of the business from these many different siloed metrics,” says Daykin. Logicalis’ preference is to use measures such as Watts per gigabyte, or Watts per user, which it feels correlate better with business strategy. However, there is not a common set of standards based on such wider measures. And that is where the company feels there should be more attention from the standards-setting organizations, so that there is a common language for such business-aligned metrics so that benchmarks can be created, on the lines of the work done with PUE.
2.7
KPIs for data centers
The following key performance indicators (KPIs) have been listed in this document relating to data centers:
• PUE, which is the measurement of the total energy of the data center, divided by the IT energy
consumption, sometimes expressed as PUE = Cooling Load Factor (CLF) + Power Load Factor (PLF) + 1.0;
23
Sustainable ICT in corporate organizations 17
• water usage effectiveness (WUE) – annual water usage divided by IT equipment energy, and expressed
in litres/kilowatt-hour;
• carbon usage effectiveness, a measure which will differ from PUE to the extent that power is obtained
from non-fossil fuel sources;
• data center maturity model metrics;
• other measures, such as ITEU (IT equipment utilization), ITEE (IT equipment energy efficiency), GEC
(green energy coefficient), and DPPE (data center performance per energy).
3 Desktop
infrastructure
Much of the energy consumed by IT equipment, especially desktop infrastructure, is wasted. For a start, somewhere around 50-60% of all desktop PCs in commercial buildings remain fully powered-on during nights and weekends, with existing power management almost always disabled. Since most office workers operate at their desks between 8 a.m. and 6 p.m., the rest of the working week, plus weekends together
account for 75% of the total time that computers are on with no one using them.24
Energy Star estimates that organizations can save between USD 25 to USD 75 per PC per year, using desktop
power management.25 That is how organizations like GE and Dell are reporting annual savings of USD 2.5 m
and USD 1.8 m, respectively.
But the PC that is left on overnight is not the only culprit. Even when a user is there, it is rarely working at full capacity. And beyond the PC, energy is consumed by the Ethernet link and the workgroup switch, which usually have no means of power management.
3.1
The elements of desktop infrastructure
The key piece of desktop infrastructure is the personal computer. In 2010 alone, a Gartner study found that 350 million PCs had been shipped worldwide. Till recently, most corporate IT infrastructure has focused on the PC, and peripherals, such as printers and networking components.
Over the past three years, the hegemony of the PC is being challenged by mobile equipment, particularly tablets and smartphones. This is creating new challenges for companies in terms of the infrastructure they need to provide support to such devices. Typically, they look for solutions that include virtualization and cloud computing as a way to enable them to integrate information and applications across PCs and mobile devices.
3.2 Sustainability
drivers
in desktop infrastructure
Power draw is a well-known factor impacting total energy consumption of desktops. The usage pattern of a
computer can, however, be a far more significant factor,26 as an energy-efficient computer that is always on
consumes more energy than a less energy-efficiency computer that is regularly turned off.
A report by Forrester pointed to a number of factors as why companies are not implementing PC power
management:27
24
Bray, M., “Review of Computer Energy Consumption and Possible Savings,” Dragon Systems white paper, December 2006. 25
Samson, T., “No good excuses not to power down PCs,” InfoWorld, April 2009. 26
Bray, 2006. 27
18 Sustainable ICT in corporate organizations
1) The power used in turning on a PC negates any benefits from turning it off
The average desktop draws 89 W, according to Forrester. If left on for 16 hours, it consumes 1.42 kW hrs of energy. For a 10-second power surge from turning a PC on to match that figure, the computer would have to draw in an excess of 2 000 amps, well over 150 times of what a typical mains outlet can provide.
2) Screensavers save energy
A screensaver displaying moving images consumes just as much electricity as an active PC, while certain graphics-intensive screen savers can cause a computer to burn twice as much.
3) Turning a PC on and off reduces its performance and useful life
While this may have been true some time ago, Forrester pointed to findings from the Rocky Mountain Institute showing that modern computers can handle 40 000 on/off cycles before failure.
4) IT managers cannot run updates and patches on PCs that are asleep or off
There are a number of technologies that are now in use, such as wake-on LAN and Intel vPRo that enables PCs that are asleep to be switched on by a remote administrator.
5) PC users do not tolerate downtime due to power management
The Forrester report acknowledges that users have very little patience for downtime, and have dealt with this problem by keeping their PCs permanently on. Companies like Microsoft and Apple have been addressing this problem by focusing on reducing the time it takes for a PC to start, plus there are dual benefits of low start-up time and lower energy costs from migrating to solid-state drives (SSDs) in our PCs.
Overall, the problems of perception about power management seem to be cultural and changing these factors will require more than just the imposition of new policies by the IT department. However, the benefits of changing the mind set of users are considerable, given that Gartner estimates that nearly a third
of enterprise power is consumed by PCs and peripherals.28
Measuring power consumption of desktop infrastructure
Computers have a number of different power states, and their power draw can vary according to the power state they are in. For the purposes of this document, it is worth setting out three main power states:
• Active, refers to a computer that is turned on and ready for use
• Low power, covers a number of states commonly referred to as sleep or hibernation – usually, when a device has multiple low power settings, the low power term refers to the setting with the lowest power draw
• Off, refers to a computer that is turned off but still connected to a power outlet.
The key metric of energy is power draw, measured in watts (W), which is an indication of how much energy a device requires at any given moment. While it may be possible to obtain a figure for power draw from the manufacturer’s specifications, it is likely to be more accurate to measure a computer’s power draw in its in-use scenario.
The average power draw of a desktop computer has fallen over the last ten years, mainly due to the replacement of cathode ray tube (CRT) monitors with liquid crystal display (LCD) monitors, which have significantly greater energy efficiency. However, advances in energy efficiency are now being balanced out by upward trends in screen sizes.
28
Sustainable ICT in corporate organizations 19
A seminal 2004 study on office equipment power management29 found that in an average office a computer
is active for 6.9 hours, of which it is idle for 3.9 hours. Ensuring computers are in low power mode during those idle periods further reduce their energy consumption. However, it is unrealistic to assume that a PC moves into low power mode as soon as it becomes idle. There is usually a specified delay before a computer enters low power mode. The length of the delay affects how much of the idle time is spent in active mode, and how much in low power mode.
Table 3: Effect of idle time delay on power state, assuming total idle time of 3.9 hours per day
Idle time delay (min) Idle time in active mode (hours)
Idle time in low power mode (hours)
Time in lower power mode (%)
5 0.9 3 76
15 1.9 2 51
30 2.6 1.3 34
60 3.1 0.8 20
Source: Bray, 2006 referencing Kawamoto et al 2004
Another factor impacting power draw of the total desktop is the ongoing migration to mobile devices, mainly laptops but increasingly including tablets, which consume far less energy, and are more likely to be switched off on a regular basis.
Apart from the considerable direct contribution IT equipment makes to energy consumption, they also have an indirect contribution. A study quoted in Bray (2006) found that “office equipment increases the load on air conditioning by 0.2-0.5kW per kilowatt of office equipment power draw.” In effect, pretty much all the energy used by IT equipment ends up heating its surroundings, which in turn causes a greater load on air conditioning systems.
Also, the power draw of desktop infrastructure is impacted by the networking needed to connect the desktops together, in terms of the number of Ethernet links running through network switches. A study in
the International Journal of Network Management found that network links cause switches to consume
more power when operating at the 1 Gbit/s data rate by approximately 1.8 W per link. The study also found that if Gigabit Ethernet links ran at 10 Mbit/s or 100 Mbit/s, the energy consumption levels fell by around
4 W per link (2.7 W at the PC and 1.5 W at the switch).30
Although Gigabit Ethernet is increasingly common, most users do not require that level of speed for the network-based work they do, such as browsing, or require it for only very short periods of time. The mean bit rate on typical link is 1-3% of the available speed and most switches have no power management built into them.
As another example of over-capacity, analyses of local area network (LAN) link utilization demonstrates that not only users are only connected 1% to 5% of the time they’re powered up, a typical office is over-provisioned with connection points with the results that many connection points are powered but not used. As a result, the IEEE 802.3az Task Force has created an Energy Efficient Ethernet (EEE) Standard which defines mechanisms and protocols aimed at reducing power draw of network links during periods of low
utilization, by transitioning network interfaces into a low-power state.31
29
Kawamoto, K., Shimoda, Y., and Mizuno, M., “Energy Saving Potential of Office Equipment Power Management,” Energy and Buildings, pp. 915-923.
30
Gunaratne, C., Christensen, K., and Nordman, B., “Managing energy consumption costs in desktop PCs and LAN switches with proxying, slipt TCP connections, and scaling of link speed,” International Journal of Network Management, John Wiley 2005. 31
20 Sustainable ICT in corporate organizations
The IEEE estimates that when IEEE 802.3az-compliant products have been fully deployed in new and existing Ethernet networks, energy savings could yield as much as USD 470 m per year, not including indirect savings in cooling or other equipment.
An additional IEEE specification defines the use of power over Ethernet (POE) technology where a single cable runs both power and data. POE provides low power to network components and peripherals so that they do not need to be plugged into the main grid. While POE, by reducing the overall requirement for AC wiring, brings defined benefits on infrastructure investments and operational expense, it is a point of debate whether it delivers energy efficiency benefits. POE has been encapsulated in the IEEE 802.3af
standard.32 It is typically used as the power source for voice-over-IP telephones, WiFi access points and
other communications devices.
3.3
Regulations and guidelines
There are a number of guidelines and initiatives that have been put in place to enable computer users to benefit from energy efficient IT equipment. A quick summary of relevant guidelines are listed here:
• Energy Star is a joint program of the US EPA and the US Department of Energy – it offers
energy-efficiency product labelling and advice
• EU Energy Star follows an agreement between the USA government and the EU on the co-ordination of
voluntary energy labelling of office equipment – the activities of this programme are now part of the Intelligent Energy – Europe (IEE) programme
• Possible extension of the 92/75 directive covering mandatory labelling of home appliances
• The EUP Directive concerning ecodesign of Energy Using Products
• The framework directive on Performance of Buildings (approved 2002)
• The Energy Services directive.
3.4
Best practices on desktop infrastructure
Over the past five years, companies have moved from seeing energy efficiency as an optional feature in their IT equipment to it being a standard, must-have feature. In the past, companies were prepared to pay extra to gain energy efficiency benefits. Instead, “IT buyers are now expecting energy efficiency improvements, for example, in the same way that they expect improving price/performance ratios with each succeeding generation of technology they buy,” according to the Forrester report on enterprise green
IT adoption.33
IT buyers can also seek to incorporate EPEAT (Electronic Product Environmental Assessment Tool) guidelines
on environmental assessment to their purchasing methods.34
Beyond hardware, the main focus in greening desktop infrastructure is in using software tools to manage eco-oriented goals at a granular level, in the data center but also across networking and desktop elements. A powerful thread in this context is the application of virtualization techniques to the desktop. Virtual desktop infrastructure deploys a virtualized desktop on a remote central server, including all of the programs, applications processes and data. This enables users to run an operating system and execute
32
Details about the IEEE 802.3af standard is available on the IEEE website: www.ieee802.org/3/. 33
Mines, C., “Market overview: The state of enterprise green IT adoption, Q4 2009,” Forrester Research, Dec. 2009. 34
EPEAT registration of electronic products covers environmental criteria, and is based on the IEEE 1680 family of Environmental Assessment Standards. www.epeat.net/.