Identification and mapping of resistance genes
against soil-borne viruses in
barley (Hordeum vulgare L.) and wheat (Triticum aestivum L.)
Inaugural Dissertation for the Achievement of the Degree ‘Doktor der Agrarwissenschaften’
at the Faculty of Agricultural and Nutritional Sciences, Home Economics and Environmental Management Justus-Liebig-University Gießen Submitted by Katrin Humbroich from Nidda Gießen, July 2007
Board of Examiners
Chairman of the Committee Prof. Dr. Steffen Hoy
1. Referee Prof. Dr. Dr. h.c. Wolfgang Friedt 2. Referee Prof. Dr. Wolfgang Köhler
Examiner Prof. Dr. Sylvia Schnell Examiner Prof. Dr. Richard Marquard
Table of Contents
Table of Contents ... I List of Figures... IV List of Tables ... VI List of Abbreviations ... VII
1 Introduction... 1
2 Literature survey ... 2
2.1 Soil-borne viruses of cereals... 2
2.1.1 The Barley yellow mosaic virus complex... 2
2.1.2 Soil-borne cereal mosaic virus disease ... 5
2.1.3 Wheat spindle streak mosaic virus disease... 6
2.2 Genetics of resistance... 7
2.2.1 Barley Yellow Mosaic Virus Complex ... 7
2.2.2 Soil-borne cereal mosaic virus ... 10
2.3 Molecular markers ... 12
2.3.1 DNA-based markers... 12
2.3.1.1 Restriction Fragment Length Polymorphisms (RFLPs) ... 12
2.3.1.2 Random Amplified Polymorphic DNAs (RAPDs)... 13
2.3.1.3 Amplified Fragment Length Polymorphisms (AFLPs) ... 13
2.3.1.4 Simple Sequence Repeats (SSRs) ... 14
2.3.1.5 Single Nucleotide Polymorphisms (SNPs) ... 15
2.4 Application of molecular markers in plant breeding... 17
2.4.1 Genetic linkage maps... 17
2.4.2 Genetic diversity... 20
3 Material and Methods ... 23
3.1 Plant Material ... 23
3.1.1 Identification of new resistance resources of barley against the barley yellow mosaic virus complex ... 23
3.1.2 Mapping populations used for the development of new PCR-based DNA markers for resistance genes against BaMMV, BaYMV-1 and BaYMV-2... 25
3.1.2.1 Mapping population 1 (MAP 1)... 25
3.1.2.2 Mapping population 2 (MAP 2)... 25
3.1.2.4 Mapping population 4 (MAP 4)... 25
3.1.2.5 Mapping population 5 (MAP 5)... 25
3.1.2.6. Mapping population 6 (MAP 6)... 26
3.1.2.7. Mapping population 7 (MAP 7)... 26
3.1.3 Wheat cultivars used for fingerprinting and studies on genetic diversity .... 26
3.2 Evaluation of virus resistance ... 27
3.3 Molecular analysis ... 28
3.3.1 DNA extraction and measurement of DNA concentrations... 28
3.3.2 RAPD-analysis ... 30
3.3.3 Microsatellite-analysis ... 32
3.3.4 AFLP-analysis ... 35
3.4 Bulked segregant analysis (BSA)... 38
3.5 Data analysis ... 39
3.5.1 Genetic mapping of BaMMV/BaYMV resistance loci... 39
3.5.2 Estimation of genetic diversity and genetic relatedness ... 39
4 Results... 41
4.1 Screening of germplasms for the presence of rym4/rym5... 41
4.2 Identification and mapping of BaMMV resistance genes in different DH- populations... 43
4.2.1 Mapping the resistance gene of ‘Cebada’ (MAP 1) ... 43
4.2.2 Mapping the resistance gene of ‘Shimane Omugi’ (MAP 2) ... 43
4.2.3 Mapping the resistance gene of ‘CI 3517’ (MAP 3) ... 45
4.2.4 Mapping the resistance gene of ‘Belts 1823’ (MAP 4)... 47
4.2.5 Mapping the resistance gene of ‘Chikurin Ibaraki 1’ (MAP 5)... 47
4.2.6 Mapping the resistance gene of ‘Taihoku A’ (MAP 6)... 49
4.2.7 Mapping the resistance gene of ‘Muju covered 2’ (MAP 7) ... 51
4.3 Estimation of genetic relatedness of wheat cultivars and breeding lines... 51
5 Discussion ... 57
5.1 Identification of new resistance donors against barley yellow mosaic virus disease ... 57
5.2 Mapping of new resistance genes against Barley yellow mosaic virus ... 58
5.2.1 Mapping resistance genes on chromosome 4H ... 59
5.2.2 Mapping resistance genes on chromosome 6H ... 63
5.4 Wheat genetic diversity ... 68
6 Summary ... 72
7 Zusammenfassung ... 74
8 References ... 79
List of Figures
Figure 1: Results of screening 120 exotic barley accessions for the presence of
rym4/rym5 by the SSR marker Bmac0029 (banding pattern of selected
varieties)...41 Figure 2: Results of screening ‘Cebada’ for the presence of rym4/rym5 by the SSR
marker Bmac0029. ...43 Figure 3: Partial map of chromosome 6H including the BaMMV-resistance of
‘Shimane Omugi’ ... 44 Figure 4: Partial map of barley chromosome 4H including the BaMMV resistance of
´CI 3517´ ... 46 Figure 5: Partial map of chromosome 6H including the resistance locus rym15 of
‘Chikurin Ibaraki 1’ ... 48 Figure 6: Partial map of chromosome 4H including rym13 of ‘Taihoku A’ ... 50
Figure 7: Partial map of barley chromosome 4H including the BaMMV resistance of ‘Muju covered 2’ ... 52 Figure 8: Dendrogram of 64 wheat cultivars and breeding lines based on UPGMA
cluster analysis of genetic diversity estimated on SSRs... 55 Figure 9: Dendrogram of 64 wheat cultivars and breeding lines based on UPGMA
cluster analysis of genetic diversity estimated on AFLPs ... 56 Figure 10: Genetic map of chromosome 4H including the BaMMV resistance of ‘CI
3517’ based on the analysis of 65 DH lines of the cross ‘CI 3517’ x ‘Reni’ (A) in comparison to the partial chromosome map of ‘IPK1’ and ‘IPK2’ with the resistance gene rym11 (B, C, NISSAN-AZZOUZ et al. 2005) and the
barley consensus map (D, VARSHNEY et al. 2007) ... 60 Figure 11: Genetic map of chromosome 4HL with the resistance gene rym9 of
‘Bulgarian 347’ (A, WERNER et al. 2000b) in comparison with the genetic map of chromosome 4HL with the resistance gene rym13 of ‘Taihoku A’
(B), the resistance gene rym8 of ‘10247’ (C, BAUER et al. 1997) and the
resistance gene rym12 of ‘Muju covered 2’ (D). ... 62
Figure 12: Genetic map of barley chromosome 6H including the BaMMV resistance gene rym15 of ‘Chikurin Ibaraki 1’ based on the analysis of 163 DH lines
the ‘Lina’ x ‘Hordeum spontaneum Canada Park’ map (C, RAMSAY et al.
2000), the barley consensus map of VARSHNEY et al. (2007, D) and to the partial map of ‘Shimane Omugi’ (E)... 65
List of Tables
Table 1: Mapped resistance genes against barley yellow mosaic virus disease, their source, resistance of donor and virus used for mapping (from Ordon et al.
2005, mod.). ... 9
Table 2: New resistance resources of barley against the BaYMV-complex... 23
Table 3: Selected wheat genotypes for fingerprinting... 27
Table 4: Composition of buffers used for DNA extraction... 29
Table 5: Solution for the determination of DNA concentrations. ... 30
Table 6: Reaction components of a 25 µl-PCR reaction for RAPD amplification... 31
Table 7: Amplification cycles of the RAPD reaction... 31
Table 8: Composition of chemical products used for the RAPD analysis. ... 31
Table 9: Compounds of the solutions and buffers used for gel electrophoresis... 33
Table 10: Chromosomal localisation, PCR program and PCR recipe of all polymorphic SSRs used for mapping in barley... 34
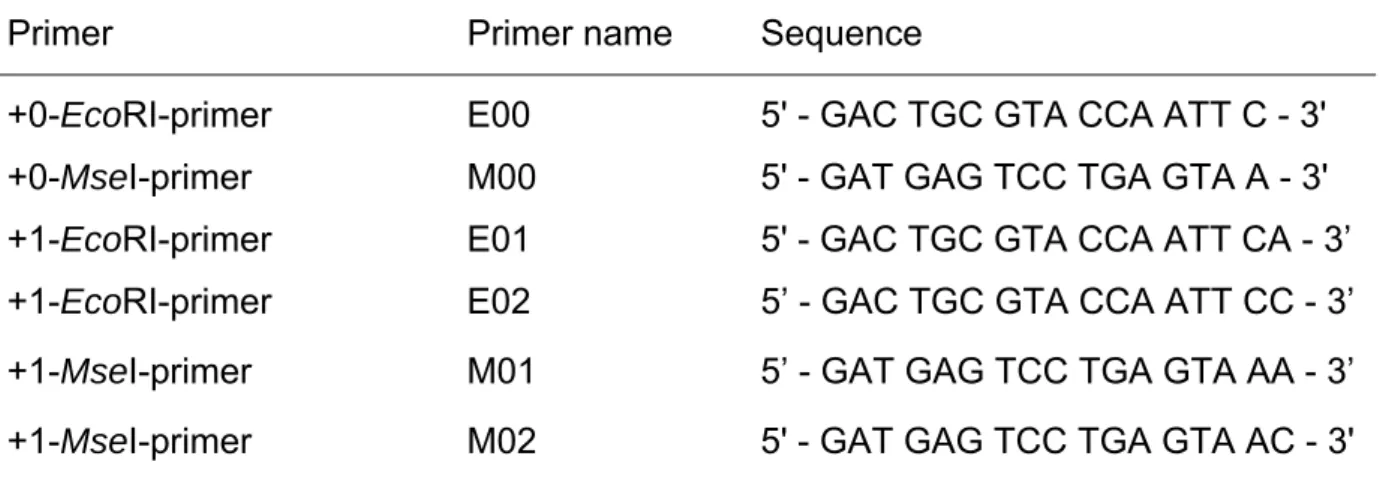
Table 11: AFLP sequences for the +0/+1 pre-amplification... 35
Table 12: Composition of the +0/+1 pre-amplification reaction mix. ... 36
Table 13: Amplification cycles of the +0/+1 analyses. ... 36
Table 14: AFLP-sequences for the +3 amplification. ... 37
Table 15: Composition of the +3 pre-amplification reaction mixes. ... 37
Table 16: Amplification cycles of the +3 amplification... 38
Table 17: Screening of 120 gene bank accessions with the SSR marker Bmac0029. ... 42
Table 18: Chromosomal location, number of alleles and the PIC-values per locus for 40 wheat microsatellites. ... 54
List of Abbreviations
A adenine
ACGM amplified consensus genetic markers AFLP amplified fragment length polymorphism BaMMV Barley mild mosaic virus
BaMMV-Sil Barley mild mosaic virus strain found in Sillery, France BaYMV Barley yellow mosaic virus
BaYMV-2 Barley yellow mosaic virus-2
BMELV Bundesministerium für Ernährung, Landwirtschaft und Verbraucherschutz
BSA bulked segregant analysis
bp base pairs
C cytosine
CAPS cleaved amplified polymorphic sequences cDNA complementary DNA
CIA Chloroform-Isoamylalcohol
cM centiMorgan
CTAB cetyltrimethylammonium bromide DArT Diversity Arrays Technology
DAS-Elisa double antibody sandwich enzyme-linked immunosorbent assay
DGGE heteroduplex analysis by density gradient gel electrophoresis
DHPLC denaturing high-performance liquid chromatography
DI diversity index
DNA deoxyribonucleic acid dNTP deoxyribonucleotide EDTA ethylene diamine tetra-acetate e.g. for example
ERAP Exon-Retrotransposon amplification polymorphism EST expressed sequence tags
et al. et alii
G guanine
GS genetic similarity GST gene specific tags H’ Shannon-Weaver-Index
ha hectare
HCL hydrochloric acid
i.e. id est
ISSR Inter-simple sequence repeats LD linkage disequilibrium
LOD logarithm of the odds value
M molar
MALDITOF Matrix Assisted Laser Desorption/Ionisation Time-of-Flight MAS marker-assisted selection
min minute
mio million
mg milligram
ml millilitre
MgCl2 magnesium chloride
NaOAc sodium acetate NH4OAc ammonium acetate
Nlb nuclear inclusion protein b
nm nanometre
ORF open reading frame PAA polyacrylamide
PCR polymerase chain reaction PIC polymorphic information content QTL quantitative trait loci
RAPD random amplified polymorphic DNA RIL recombinant inbred lines
RFLP restriction fragment length polymorphisms RGA Resistance gene analogues
RNA ribonucleic acid
rpm revolutions per minute s second
SBCMV Soil-borne cereal mosaic virus
SBRMV Soil-borne rye mosaic virus
SBWMV Soil-borne wheat mosaic virus
SCAR sequence characterised amplified region SFP single feature polymorphisms
SMC simple matching coefficient SNP single nucleotide polymorphism SSR simple sequence repeats
ssRNA single stranded ribonucleic acid STS sequence tag sites
T thymine
TBE Tris/Borat/EDTA-Puffer
TE Tris-(hydroxylmethyl-)aminomethan TEMED tetremethylethylenediamide
t-RNA transfer ribonucleic acid
U unit
USA United States of America
USDA United States Department of Agriculture
V volt
VPg viral genome linked protein
vs versus
v/v volume /volume
WSSMV Wheat spindle streak mosaic virus
WYMV Wheat yellow mosaic virus
µg microgram
1 Introduction
Barley (Hordeum vulgare L.) and wheat (Triticum aestivum L.) are two of the most
important crop species. The worldwide acreage of wheat is first before rice maize and barley: In 2006 the global production was estimated at about 622 million (mio) tonnes of wheat and 138 mio tonnes of barley (USDA 2007). In Germany 3.12 mio hectares (ha) of wheat were harvested and the area under barley cultivation accrued to 2.03 mio ha (BMELV 2007).
Due to the predicted growth of the world’s human population and the corresponding increased global food demand, it is a continuing challenge to improve varieties of crop plants, i.e. for disease resistance, to guarantee a stable harvest and yield production parallel to the decreasing acreage under cultivation worldwide, i.e. for barley in the last decades (USDA 2007). In spite of a permanent improvement of resistance in barley and wheat they are still confronted with many viral, bacterial and fungal pathogens, which cause significant damages and reduction in yield and quality due to a co-evolutional adaptation of respective pathogens. In the last decades several soil-borne virus diseases transmitted by the fungus Polymyxa graminis
became increasingly important in Europe as pathogens of cereals, particularly of barley and wheat (HUTH 2002). These viruses are Barley yellow mosaic virus
(BaYMV), Barley mild mosaic virus, Soil-borne cereal mosaic virus (SBCMV) and Wheat spindle streak mosaic virus (WSSMV), which cause high yield losses up to
80%. Therefore, because chemical treatments against Polymyxa graminis to prevent
high yield losses are neither efficient nor economic, it is of prime interest to produce resistant varieties against these viral pathogens. The main objectives of the present study were on one hand to screen exotic genetic resources of barley for resistance and on the other hand to identify molecular markers for new resistance genes against
Barley yellow mosaic virus (BaYMV) by screening seven different DH populations.
With regard to wheat, the project aimed at the identification of sources of tolerance or resistance to Soil-borne cereal mosaic virus (SBCMV) by field tests carried out in
France followed by genotyping of respective cultivars using EcoRI+3/MseI+3 AFLP
primer combinations and microsatellite markers in order to achieve information on the genetic relatedness of resistant and susceptible cultivars and to identify SSR markers suitable for mapping respective genes or quantitative trait loci (QTL).
2 Literature survey
2.1 Soil-borne viruses of cereals
Several soil-borne viruses of cereals are known belonging to the plant virus family
Potyviridae. This family consists of six genera designated as Potyvirus, Ipomovirus, Macluravirus, Rymovirus, Tritimovirus and Bymovirus (REVERS & CANDRESSE
2004, ADAMS et al. 2005). Besides this, there are the Furoviruses, a genus which is
not assigned to any specific family. Some of the most important viruses causing serious diseases of cereals like the Barley yellow mosaic virus, Barley mild mosaic virus, Wheat spindle streak mosaic virus, Oat mosaic virus, Wheat yellow mosaic virus and Rice necrotic mosaic virus belong to the bymovirus group, that are all
transmitted by the fungus Polymyxa graminis (KANYUKA et al. 2003). Alike the furoviruses, i.e. Soil-borne cereal mosaic virus, Soil-borne wheat mosaic virus and Oat golden stripe virus, infect cerealsvia Polymyxa graminis (KANYUKA et al. 2003).
Besides Polymyxa graminis, a related fungal vector Polymyxa betae transmits the
furovirus beet necrotic yellow vein virus in sugar beets (RUSH 2003). All these Polymyxa-transmitted viruses have in common that high yield losses and important
diseases are caused mainly in cereals (KANYUKA et al. 2003, ADAMS et al. 2004).
2.1.1 The Barley yellow mosaic virus complex
In Japan the Barley yellow mosaic virus disease is already known since the 1940’s and it is epidemic since the 1970’s (IKATA & KAWAI 1940, cited in INOUYE & SAITO 1975). After the first report in Germany in 1978 (HUTH & LESEMANN 1978) the disease also occurred in several other European countries and in Eastern China (HILL & EVANS 1980, LAPIERRE 1980, MAROQUIN et al. 1982, YILI & DENGDI 1983, LANGENBERG & VAN DER WAL 1986, FANTAKHUN et al. 1987, SIGNORET & HUTH 1993, KATIS et al. 1997, ACHON et al. 2005). The typical yellow patches appear in winter or early spring in the field as a result of the infection of roots in autumn by the different strains of the Barley yellow mosaic virus disease. The symptoms are mosaic pale green or yellow discolorations mostly on the youngest leaves. Sometimes infected plants show complete yellowing with necrotic patches and a stunted growth. Affected plants show fewer tillers, less reduction in grain yield
and grain size may be inhomogeneous. The severity of symptoms depends on the barley cultivar and the environmental conditions in autumn during the infection and in winter during the reproduction and spread of the virus within the plants. In general symptoms become less obvious with increasing temperatures and plant growth. Upper leaves are often free of symptoms. Typically, the symptoms appear in the newly emerging leaves when plants begin to grow again after a cold period in winter. This seems to be related to a temporary reversal of the major direction of phloem transport (SCHENK et al. 1995). Until now, the manner of virus movement has not been determined but virus RNA and the coat protein can be detected in root cells before symptoms appear in the leaves (PEERENBOOM et al. 1996). Barley yellow mosaic virus survives within resting spores that remain within root debris after crop
harvest and can persist in soil for many years (HUTH 1991) even in the absence of a suitable host (USUGI 1988). The inoculum mostly becomes distributed as resting spores within soil or crop debris through soil cultivation and on machinery. Therefore, existing infected patches in the field enlarge and new ones may easily emerge. Resting spores may also spread by wind-blown soil particles and zoospores may travel short distances in soil water (HILL & WALPOLE 1989). Spring-sown barley normally does not develop symptoms of the disease in the field due to adverse environmental conditions for virus reproduction and spread and the viruses do not cause yield losses in spring barley. However, many spring barley cultivars turned out to be susceptible in laboratory resistance tests.
In Europe, the Barley yellow mosaic virus disease is caused by a complex of at least four viruses or virus strains, i.e. Barley mild mosaic virus (BaMMV), BaMMV-SIL
(named according to the village Sillery in France, where the strain was first detected),
Barley yellow mosaic virus (BaYMV-1), and BaYMV-2 (HUTH 1989, HARIRI et al.
2003), infecting barley individually or in combinations. BaYMV-2 was detected in Germany (HUTH 1989), in the United Kingdom (BEATON 1989), Belgium and France (HARIRI et al. 1990). A new strain similar to BaMMV-SIL and BaMMV has just recently been detected in Germany (HUTH et al. 2005, HABEKUSS et al. 2006). An even more complex situation is present in Japan where seven strains of BaYMV and two strains of BaMMV have been described (NOMURA et al. 1996). In Korea a strain biologically and serologically different from BaMMV strains known in Germany and Japan has been detected and several different strains have also been discovered in China (CHEN et al. 1996, LEE et al. 1996, LEE et al. 2006). Due to transmission by
the widespread soil-borne fungus P. graminis growing of resistant barley cultivars
has to be considered as the only effective means to avoid high yield losses caused by BaMMV, BaMMV-SIL, BaYMV and BaYMV-2.
The viruses of this complex have a quite narrow natural host range limited to the
Poaceae. The natural host is barley (Hordeum ssp.) but successful transmission by
mechanical inoculation to Aegilops (PROESELER 1988), Eremopyrum, Lagurus
(ADAMS 2004), Triticosecale (KEGLER et al. 1985), Secale (ORDON et al. 1992)
and Triticum durum L. (PROESELER 1993) has been carried out.
The whole genus Bymovirus, family Potyviridae, is a well-defined group of viruses
that resemble the aphid-transmitted potyviruses and other members of the family in having flexuous filamentous particles (12-13 diameters) with modal lengths of 270 and 568 nm causing pin wheel inclusions in infected cells (KANYUKA et al. 2003). The members have bipartite single stranded (ss) RNA genomes with a genome linked protein (VPg) at the 5’terminus. Each segment carries a single open reading frame (ORF) which encodes a polyprotein that is cleaved into functional proteins by virus-encoded proteases. The coding sequence of the coat protein is located in the C-terminus of the larger RNA1 polyprotein (KANYUKA et al. 2004a). Both RNA species are needed for infection (KASHIWASAKI 1996). BaMMV causes similar symptoms like BaYMV but the two viruses are serologically unrelated and their polyproteins share only about 36% identical amino acids (SCHLICHTER et al. 1993). Regarding these differences, serological methods or sequence tests are used to discern both viruses. BaYMV-2, a strain which is able to infect cultivars carrying the resistance gene rym4 (see below chapter 2.2.1), is very closely related to BaYMV.
The strains do not differ in the coding sequence of the coat protein and no diagnostic serological methods have been reported to distinguish them (HUTH & ADAMS 1990). The French BaMMV-SIL isolate is the only European BaMMV isolate able to infect barley cultivars with the rym5 gene (see chapter 2.2.1, HARIRI et al. 2003). It is very
similar to the BaMMV strain with only five amino acid exchanges consistently different between BaMMV and BaMMV-SIL. Two of these exchanges are in the viral genome linked protein (VPg) cistron and in the nuclear inclusion protein b (NIb) cistron region, respectively and seem to be functionally important (KANYUKA et al. 2004a).
2.1.2 Soil-borne cereal mosaic virus disease
Soil-borne wheat mosaic virus (SBWMV) is a member of the genus Furovirus which
is also transmitted by the fungus Polymyxa graminis. Due to its high persistence the
virus causes yield losses in winter wheat in many areas of the world, especially in the central and eastern part of the United States of America. SBWMV was first detected in 1919 in the USA (MCKINNNEY 1925) and furoviruses causing similar diseases in wheat and rye were later also found in Japan, China (DIAO et al. 1999), Italy (RUBIES-AUTONELL & VALLEGA 1990), France (LAPIERRE et al. 1985), UK (CLOVER et al. 1999a, CLOVER et al. 2001, BUDGE & HENRY 2002), several African countries (KAPOORIA et al. 2000), Belgium (VAIANOPOULOS et al. 2005) and in Germany (KOENIG et al. 1999). These isolates were thought to belong to the same SBWMV species, but it turned out that the global population of furoviruses on wheat consists of genetically divergent strains with a relatively high degree of polymorphisms at the nucleotide and amino acid level. The American, Chinese, European and Japanese isolates are now separately reclassified (KOENIG & HUTH 2000, SHIRAKO et al. 2000). The European virus isolate shares only 70% genome identity with SBWMV from the USA and Japan (DIAO et al. 1999) and due to the mainly infection of rye the name soil-borne rye mosaic virus was proposed in Germany (KOENIG et al. 1999). The natural hosts of this virus are bread wheat, durum wheat, rye, and triticale. In Germany, Poland and Denmark, the virus mainly infects rye, whereas in the United Kingdom, Italy and France wheat is the predominant host (HUTH 2002). Therefore, it was renamed as Soil-borne cereal mosaic virus (SBCMV, KOENIG & HUTH 2000, YANG et al. 2001) in Germany and
Europe, respectively, which has recently been approved by the International Committee on Taxonomy of Viruses. In 2002, severe damage in wheat due to a furovirus infection was observed in a field near Heddesheim, Baden-Wuerttemberg, Germany. As a result of sequencing the disease causing virus it turned out to be closely related to the American strain of SBWMV. This was the first report of a type strain of Soil-borne wheat mosaic virus in Europe (KOENIG & HUTH 2003).
Symptoms caused by SBCMV on susceptible cultivars in the field are a pale green-yellow mosaic or streaks on the leaves and moderate to severe stunting. Young leaves appear mottled and develop pale discolorations that cover both the leaf lamina and the sheath (CLOVER et al. 2001, KASTIRR et al. 2004). The appearance and severity of soil-borne mosaic virus symptoms on wheat may vary considerably
depending on the plant genotype, the concentration and aggressiveness of the virus strain as well as the environmental conditions (BUDGE & HENRY 2002). Generally, late planting in autumn is recommended to reduce the number of infected plants and to minimise yield losses (HUTH 2002). All tolerant varieties are known to contain high virus levels in the root system and no or low to moderate levels in the leaf tissue (DRISKEL et al. 2002). Infected plants often occur in the field in circular patches of varying size. In field samples SBCMV frequently occurs in mixed infections with the bymovirus Wheat spindle streak mosaic virus (WSSMV) due to transmission of both
viruses via Polymyxa graminis (see chapter 2.1.3, HUTH 2002). The primary
zoospores of the vector penetrate root hairs or epidermal cells in autumn when there is sufficient moisture and soil temperature and the SBCMV is subsequently introduced into the host cytoplasm (KANYUKA et al. 2003). SBCMV consists of virus particles with a bipartite genome. All particles are rod-shaped with modal length of 120 to 130 and 200 to 230 nm. The genome consists of two positive-sense ssRNAs, with three open reading frames (ORFs, KOENIG et al. 1999) each. RNA1 and RNA2 have a cap structure at the 5’terminus and a tRNA-like structure at the 3’terminus. Three different strains (-G, -O, -C) of SBCMV which only differ in their aggressiveness (HUTH 2002) have been distinguished and showed after sequencing more than 90% sequence identity (KOENIG et al. 1999). SBCMV can be mechanically transmitted to several Poaceae like Bromus secalinus L., Chenopodium quinoa Willd., Hordeum vulgare L., Secale cereale, Triticum aestivum, T. durum, T. turgidum and Triticale (KASTIRR et al. 2004). Since virus-containing resting spores
of Polymyxa graminis persists in soil and crop debris for several decades, cultural
practises for virus control such as crop rotations or delayed planting are not effective, whilst chemical control measures are unacceptable for ecological reasons.
2.1.3 Wheat spindle streak mosaic virus disease
The appearance of Wheat spindle streak mosaic virus was reported for Africa,
Canada, the USA and several European countries (RUBIES-AUTONELL & VALLEGA 1990, HAUFLER 1996, KAPOORIA & NDUNGURU 1998, CLOVER et al. 1999b, HUTH 2002, VAIANOPOULOS et al. 2006). The virus belongs to the Bymoviruses such as Barley yellow mosaic virus, Barley mild mosaic virus, Oat mosaic virus or Wheat yellow mosaic virus and is therefore also transmitted by the
plants show yellow-to-light green streaks which occur in parallel to the leaf veins. Besides the streaky symptoms fewer tillers are generated and the plants are dwarfed resulting in yield reductions (HUTH 2002). Infection of the roots and symptom expression are generally at temperatures between 5-17°C. Mixed infection with SBCMV and WSSMV in fields is widespread (see chapter 2.1.2.1). Reportedly,
Wheat spindle streak mosaic virus reduces the level of field resistance to Soil-borne cereal mosaic virus (CLOVER et al. 1999a). The natural host is winter wheat, durum
wheat, rye and triticale whereas some gramineous plants like Hordeum vulgare and Avena sativa can not be infected by WSSMV. Like BaMMV/BaYMV, WSSMV has a
bipartite, positive ssRNA genome with two RNAs both encoding single polyproteins. The function of the polyprotein of RNA1 is unknown whereas RNA2 encodes one polyprotein, which is divided into two single proteins, i.e. P1 and P2. P2 is known to be involved in fungal transmission (SOHN et al. 2004). Until now, no different WSSMV strains have been detected.
2.2 Genetics of resistance
2.2.1 Barley Yellow Mosaic Virus Complex
On the basis of intensive screening programmes, mainly with barley germplasms derived from East Asia, resistance sources against the barley yellow mosaic virus disease have been identified (ORDON et al. 1993) and different reactions to the different strains of the BaYMV-complex have been observed (GÖTZ & FRIEDT 1993, ORDON & FRIEDT 1993). Up to now 16 resistance genes are known of which 14 derived from the primary barley gene pool are recessive, while Rym14Hb and Rym16Hb derived from Hordeum bulbosum are dominant (RUGE et al. 2003,
RUGE-WEHLING et al. 2006). The resistance genes are distributed over the whole barley genome (GRANER et al. 2000, Ordon et al. 2005). An overview on all mapped resistance genes against barley yellow mosaic virus disease is given in table 1. In Europe barley yellow mosaic virus disease resistance is mainly based on two resistance genes, rym4 and rym5, which are located on the long arm of chromosome
3H. Rym4 and rym5 represent two alleles of the same gene, the eukaryotic
translation initiation factor 4E (Hv-eIF4E, STEIN et al. 2005, KANYUKA et al. 2005).
The recessive resistance-encoding allele rym4, derived from the Dalmatian landrace
effective against BaYMV-2. In contrast rym5, which is derived from the Chinese
six-rowed land race ‘Mokusekko 3’ (KONISHI et al. 1997, GRANER et. al. 1999a), confers resistance against BaMMV, BaYMV-1 and BaYMV-2. However, rym5 has
been recently overcome by the new German BaMMV strain and BaMMV-SIL (HARIRI et al. 2003, HABEKUSS et al. 2006). On chromosome 4H KONISHI et al. (1997) identified another recessive resistance gene, rym1, which also derived from
‘Mokusekko 3’ and confers resistance against all BaMMV and BaYMV strains. The resistance of ‘Mokusekko 3’ to all strains of the barley yellow mosaic virus complex in Japan and Europe, including BaMMV-SIL and the new German BaMMV strain, is the result of the combination of at least two genes, i.e. rym1 and rym5 (OKADA et al.
2003, OKADA et al. 2004, HABEKUSS et al. 2006). Another gene that confers resistance against the European and Japanese BaYMV but not against BaMMV is
rym3, which was detected in ‘Haganemugi’ and ‘Ea 52’, which is a mutant of the
Japanese cultivar ‘Chikurin Ibaraki 1’ (UKAI 1984, KAWADA 1991, ORDON et al.1993). Rym3 was mapped by RFLP analysis on the short arm of chromosome 5H
(SAEKI et al. 1999). By using a Japanese strain of BaYMV, the resistance gene
rym2, derived from the variety ‘Mihori Hadaka 3’, was mapped on chromosome 7HL
and rym6 of ‘Amagi Nijo’ on chromosome 3HL (TAKAHASHI et al. 1973, IIDA et al.
1999). Whereas rym2 confers resistance against BaMMV, BaYMV-1 and BaYMV-2, rym6 donors are completely susceptible against European strains of the barley
yellow mosaic virus complex (KONISHI et al. 2002). The resistance gene rym7,
which confers partial resistance to BaMMV, has been mapped to the centromeric region of chromosome 1HS (GRANER et al. 1999b). At the telomeric region of chromosome 4HL four resistance genes, rym8, rym9, rym12 and rym13 are mapped,
whereas rym8, rym9 and rym13 forming a gene cluster. Thereof, resistance gene rym8 derived from the cultivar ‘10247’ shows partial resistance against BaMMV and
BaYMV (BAUER et al. 1997, GRANER et al. 1999b). Rym9 confers resistance
exclusively against BaMMV, whereas rym12, derived from the Korean cultivar ‘Muju
covered 2’, shows a complete resistance against all strains of the Barley yellow mosaic virus complex in Europe (ORDON et al. 1993, GRANER et al. 1996, BAUER et al. 1997, SCHIEMANN et al. 1998). Furthermore, rym13, derived from the
Taiwanese cultivar ‘Taihoku A’, shows a complete resistance to the Barley yellow mosaic virus complex (WERNER et al. 2003b, HABEKUSS et al. 2006). Further on,
rym10, found in ‘Hiberna’, was assigned to chromosome 3HL (GRANER et al. 1995,
GRANER et al. 1999a) and confers resistance against BaYMV-1 and BaYMV-2. Resistance gene rym11 from the resistance donor ‘Russia 57’ has been mapped to
the telomeric region of chromosome 4HL and confers resistance to all strains of the BaYMV complex (BAUER et al. 1997, NISSAN-AZZOUZ et al. 2005). The BaYMV/BaYMV-2 resistance of ´Chikurin Ibaraki 1´ has been located on chromosome 5HS (WERNER et al. 2003a) and the BaMMV resistance gene of this variety, called rym15, on chromosome 6H (LE GOUIS et al. 2004). In addition to
these genes, two dominant resistance genes from Hordeum bulbosum, member of
the secondary barley gene pool, are mapped on chromosome 6HS (Rym14HB) and Rym16HB on chromosome 2HL (RUGE et al. 2004, RUGE-WEHLING et al. 2006).
Regarding the new German BaMMV strain and BaMMV-Sil it turned out that rym4, rym7, rym9, rym11, rym12, rym13, rym15, Rym14HB and Rym16HB, are effective
against these strains (HABEKUSS et al. 2006).
2.2.2 Soil-borne cereal mosaic virus
Regarding the genetic base of resistance of bread wheat and durum wheat against
Soil-borne cereal mosaic virus (SBCMV) several resistance tests were carried out
and SBCMV resistant cultivars were identified (BUDGE & HENRY 2002, KANYUKA et al. 2003). These resistant varieties are reported to carry a translocation resistance, because all varieties show high virus levels in the roots (DRISKEL et al. 2002) but normally virus transmission to stems and leaves is restricted but may appear under certain environmental conditions (DRISKEL et al. 2002, HUTH & GOETZ 2007). The inheritance of Soil-borne wheat mosaic virus (SBWMV) resistance, which is closely
related to SBCMV, was investigated in several studies. The determinism of genetic resistance against this virus was described to be controlled by one dominant gene (MODAWI et al. 1982), two (BARBOSA et al. 2001) or even three genes (NAKAGAWA et al. 1959). In the United Kingdom SBCMV resistant cultivars were developed including genetic material of the resistant cultivars ‘Cadenza’, ‘Charger’ and ‘Claire’. Due to a recently established glasshouse-based resistance test, the monogenic inheritance of ‘Cadenza’ was identified (KANYUKA et al. 2004b). A study based on a doubled haploid (DH)-population of the cross ‘Avalon’ x ‘Cadenza’ reveals a 1:1 segregation ratio, giving hint to a monogenic mode of inheritance of the
mapped to the distal end of chromosome 5DL and closely linked microsatellite markers to the Sbm1 locus were identified (BASS et al. 2006). Until now, it is still
unknown whether the resistance of ‘Cadenza’ is related to a dominant, semi-dominant or a recessive inheritance due to the totally homozygous character of the used DH population (BASS et al. 2006). Regarding the pedigrees of ‘Charger’ and ‘Claire’ a genetic relation of these varieties to ‘Cadenza’ can be excluded. In this case, the Argentinean wheat cultivar ‘Klein Rendidor’, which shows also resistance against SBWMV, was identified as the resistance donor (MODAWI et al. 1982, BASS et al. 2006). Within the European wheat germplasm, two resistance sources against SBCMV are known, but further studies are necessary to confirm these presumptions (BASS et al. 2006).
With respect to WSSMV (see chapter 2.1.3) resistance sources have been found in some wheat species (COX et al. 1994, CADLE-DAVIDSON et al. 2006). In WSSMV resistance screenings a qualitative resistance was observed and therefore a high heritability controlled by a few dominant genes was assumed (KOEVERING et al. 1987). Due to difficulties in screening and mechanical inoculation of WSSMV, the identification of molecular markers is of high interest for the development of resistant cultivars. Hence, KHAN et al. (2000) identified one major gene resistance gene against WSSMV in a RIL population from a cross between the resistant variety ‘Geneva’ and the susceptible cultivar ‘Augusta’. This resistance locus was mapped by RFLP markers on chromosome 2DL but due to the population type, the mode of inheritance could not be identified. Furthermore, a Triticum aestivum-Haynaldia villosa translocation line T4VS·4DL was developed, which shows resistance against
WSSMV. The resistance locus was designated as Wss1 and is located on 4VS
(ZHANG et al. 2005). In several studies it has been demonstrated that the virus is detectable by DAS-ELISA in resistant varieties after mechanical inoculation in the greenhouse and even under natural conditions in the field (CARROLL et al. 2002, KANYUKA et al. 2003). Therefore, the WSSMV resistance has to be assigned as a tolerance, because distribution of the virus in the root system and virus transport from the roots into the leaves is limited (KANYUKA et al. 2003). These findings are in contrast to HUTH et al. (2002), who reported on immune wheat plants against WSSMV.
2.3 Molecular markers
Molecular markers or more generally speaking genetic markers detect genetic differences, i.e. polymorphisms, at the DNA level between individuals and species, respectively, whereas the variations are not visible in the phenotype except for morphological markers (JONES et al. 1997). Regarding a target gene or trait of interest, molecular markers act as flags because of their close localization to the gene of interest. Molecular markers, which are tightly linked to an agronomical important gene, can be used by breeders for marker-assisted selection (MAS), a tool for an early selection of difficult traits in plants (VARSHNEY et al. 2006). Random markers of unknown localisation and function can be used in pedigree studies and germplasm investigations to discover genetic relations based on the comparison of fingerprints. There are three different marker classes, mainly the morphological, the biochemical and the DNA-based markers (COLLARD et al. 2005). Morphological markers are visual traits, biochemical markers come up to differences in detected enzymes and are influenced by environmental factors. Therefore, DNA, respectively Polymerase chain reaction (PCR)-based molecular markers have been preferred in the last decades, because of their numerous occurrences in the genome and their neutral behaviour to environmental conditions (JOSHI et al. 1999).
2.3.1 DNA-based markers
2.3.1.1 Restriction Fragment Length Polymorphisms (RFLPs)
RFLPs have primarily been used in human genome mapping (BOTSTEIN et al. 1980), the first organism for which polymorphisms were detected in coding sequences. The procedure of this molecular marker method is divided into two steps. The first step is based on the restriction endonuclease digestion of DNA, where the restriction enzyme recognizes and cleaves specific nucleotide sequences and therefore variations in the restriction site arise as a result of restriction fragments of different sizes (JONES et al. 1997). The whole range of different DNA fragments are separated by gel electrophoresis and transferred to a membrane by Southern blotting (SOUTHERN 1975). In a second step hybridisation to a labelled probe visualises DNA fragments of different size (polymorphisms). RFLPs were mainly used in the 1990s for creating linkage maps (GRANER et al. 1995, SAGHAI-MAROOF et al.
1996) or the assessment of genetic diversity in different crop plants like oilseed rape (for review cf. SNOWDON & FRIEDT 2004) or barley (RUSSELL et al. 1997). The major advantage of this method is its reliability and transferability to other populations although RFLPs are very time-consuming.
2.3.1.2 Random Amplified Polymorphic DNAs (RAPDs)
In 1983 the Polymerase chain reaction (PCR) was developed (MULLIS & FALOONA 1987), which facilitated the efficient development of molecular markers. The PCR is based on the amplification of a specific single nucleic acid sequence. To achieve this, three steps are needed. First of all double-stranded DNA is denaturated followed by an annealing step, where the primers attach to the single-stranded DNA template. The third step is the elongation of the DNA template. During the last step the Taq DNA polymerase isolated from a bacterium called Thermus aquaticus (CHIEN et al.
1976), synthesises a complementary DNA strand defined by the primers, and thus copies the DNA sequence between the primer annealing sites. RAPDs are based on using only a single primer of about 8-10 nucleotides for DNA amplification (WILLIAMS et al. 1990). This decamer-primer acts as forward and reverse primer. RAPDs are able to generate a large number of fragments of different size. Polymorphisms are detected by gel electrophoresis and thus RARD markers are identified due to the sequence differences in the primer binding sites. Therefore, RAPDs are dominant markers. Furthermore, the method is relatively cheap and easy to handle. The main disadvantages of these PCR-based markers are their lack of reproducibility and their non-transferability to other plants (SCHLÖTTERER 2004). Further on, RAPDs are used as specific markers in diversity studies (RUSSELL et al. 1997, SIMIONIUC et al. 2002) as well as in genetic mapping for identification and localisation of e.g. resistance genes (ORDON et al. 1995, SCHIEMANN et al. 1997, PELLIO et al. 2004).
2.3.1.3 Amplified Fragment Length Polymorphisms (AFLPs)
AFLPs are based on the selective PCR amplification of restricted fragments (ZABEAU & VOS 1993). This technique is divided into three different steps. In the first one, genomic DNA is digested by two different restriction enzymes, a frequently cutting enzyme (e.g. MseI, 4bp recognition sequence) and another one cutting less
frequently (e.g. EcoRI, 6bp recognition sequence). The resulting fragments are
ligated to restriction enzyme site specific adapters. The selective amplification of sets of restriction fragments follows in a second step. In the PCR reaction primers are used, which are complementary to the adapter sequences except for the presence of one to three additional bases at the 3’ end arbitrarily chosen by the user. These selective amplifications lead to a reduction in the number of amplified fragments to 1/16 and 1/256, respectively. The third step complies with a gel analysis where the PCR products are visualised on a polyacrylamide (PAA) gel (VOS et al. 1995). The polymorphisms, which are observed, are the results of insertions, deletions and point mutations at the restriction sites, respectively. With AFLPs it is possible to detect more than 100 DNA fragments in just one PCR. The disadvantage of the AFLPs is their dominant inheritance and therefore the difficulty to identify homologous alleles. In this case their reduced informativeness leads to problems in mapping e.g. F2
generations with heterozygous individuals (MUELLER & WOLFENBARGER 1999, SAAL et al. 2002). Nevertheless, the AFLP method has a lot of advantages like its high reproducibility, the quality of information, the ease of handling and the high grade of polymorphisms detected. Therefore, AFLP markers are often used for DNA fingerprinting, fine mapping of genes, genetic diversity analyses and for the construction of genetic linkage maps (SCHIEMANN et al. 1999, UPTMOOR et al. 2003, ABU-ASSAR et al. 2005, NISSAN-AZZOUZ et al. 2005, STODART et al. 2005, BRATTELER et al. 2006).
2.3.1.4 Simple Sequence Repeats (SSRs)
SSRs or microsatellites are tandemly arranged repeats of several nucleotides, which are present in the vast majority of eukaryotic genomes (DÁVILLA et al. 1999, RAKOCZY-TROJANOWSKA et al. 2004). The frequencies of SSRs vary significantly among different organisms. The most common SSRs in plants are dinucleotide repeats including (AT)n, (GT)n and (GA)n (GUPTA & VARSHNEY 2000), whereas
(AC)n is one of the most frequent SSRs in mammals (TOTH et al. 2000). SSRs are,
due to their variation in the number of repeat units, highly polymorphic and flanked by highly conserved genomic regions. SSR markers are in general inherited codominantly, have a moderate abundance and good genome coverage. The main advantages of SSRs are their multi-allelic nature, the reproducibility, their
MACAULY et al. 2001, PARIDA et al. 2006). These properties have made SSRs a powerful tool for genetic mapping, genome analysis and population genetics (SCHLÖTTERER 2004). SSRs based linkage maps have been developed in all major cereals such as barley (RAMSAY et al. 2000, LI et al. 2003), wheat (ROEDER et al. 1998, SOMERS et al. 2004), maize (SHAROPOVA et al. 2002), and rice (MCCOUCH et al. 1997, 2002). In wheat and barley significant progress has been made by sequencing expressed sequence tags (ESTs) derived from SSRs for high density mapping (THIEL et al. 2003, STEIN 2007, VARSHNEY et al. 2007). Furthermore, SSRs have been used for genetic diversity studies in many plant species e.g. sorghum (UPTMOOR et al. 2003, ABU-ASSAR et al. 2005), oat (LI et al. 2000), wheat (HAMMER et al. 2000), and barley (ROUSSEL et al. 2004, PANDEY et al. 2006).
2.3.1.5 Single Nucleotide Polymorphisms (SNPs)
SNPs represent the marker of choice during the last years and are based on a single-base change in the DNA sequence (point-mutation), usually with an alternative of two possible nucleotides at a specific position (VIGNAL et al. 2002). In the human genome a total of ten million SNPs were detected, whereas over five million SNPs possess a minor allele frequency of more than 10% (BOTSTEIN & RISCH 2003). Furthermore, SNPs are distributed over the whole human genome at an estimated frequency of one SNP every 506 bp (CARLSON et al. 2003). SNPs are bi-allelic, codominant markers and regarding the modification or expression of a gene in non-coding regions they are mostly silent. Moreover, SNPs have great potential for automation and therefore for high-throughput screening (GUPTA et al. 2001). In general, SNPs are used for association studies due to their high frequency in the genome and their stability. Regarding the fully sequenced human genome the location of the allelic variations is known. In linkage analysis studies of different plants it could be confirmed that SNPs are very common in plant genomes. CHING et al. (2002) found one SNP per 60 bp in outbreeding maize, in wheat one SNP every 212 bp (RAVEL et al. 2006) was reported, one SNP per 300 bp was detected in rice and Arabidopsis thaliana (SCHMID et al. 2003, YU et al. 2005), and in barley SNPs
were found every 200 bp (ROSTOKS et al. 2005), whereas there was one SNP every 50 bp (RUSSELL et al. 2004) and 58 bp (NEUHAUS et al. 2004), respectively, in samples including varieties of Hordeum spontaneum and Hordeum vulgare.
To identify SNPs various strategies have been developed (LANDEGREN et al. 1998). One method is the heteroduplex analysis of DNA molecules by density gradient gel electrophoresis (DGGE). Electronic dot blot assays and denaturing high-performance liquid chromatography (DHPLC) are further well-suited methods (KOTA et al. 2001, SHIRASAWA et al. 2006). Furthermore, mass-spectroscopy using MALDI-TOF (Matrix Assisted Laser Desorption/Ionisation Time-of-Flight), microarray technology, EcoTilling and single strand conformation polymorphism (SSCP) are used to score SNPs (STOERKER et al. 2000, ANDERSEN et al. 2003, COMAI et al. 2004, WANG et al. 2005).
There are still a lot of other molecular markers, mostly variations of the mentioned procedures above, which are based on point mutations in the DNA sequence and are used for genetic diversity studies or linkage mapping. A few recently developed methods with high potential are listed. One of these techniques are the single feature polymorphisms (SFPs), which are identified in transcript profiling data by visualizing differences in hybridisation to individual oligonucleotide probes (VARSHNEY et al. 2005, WEST et al. 2006). The polymorphisms present in the DNA are transcribed into the messenger RNA and may affect hybridization to the microarray probes if located in a region complementary to the probe. SFPs detected using high density oligonucleotides microarrayssuch as the Barley1 Affymetrix GeneChip (CLOSE et al. 2004) can serve as function-associated markers for genetic analyses including quantitative trait loci (QTL) and linkage disequilibrium (LD) mapping. Further on, Diversity Arrays Technology (DArT) enables the profiling of the whole genome without any DNA sequence information. This method is based on the microarray hybridisation which detects the presence or absence of a specific DNA fragment from the whole genomic DNA of an individual or a whole population (JACCOUD et al. 2001, WENZL et al. 2004). Therefore, this technology generates a large number of high-quality markers in several crop species like barley (WENZL et al. 2004),
Arabidopsis thaliana (WITTENBERG et al. 2005), cassava (XIA et al. 2005), wheat
(AKBARI et al. 2006), and pigeonpea (YANG et al. 2006).
Besides the already described marker techniques, several methods are described to convert already existing unspecific PCR-markers to more robust ones, which are easier and less laborious to use. To specify point mutations-based AFLPs or RAPDs it is necessary to convert them into more stable single locus PCR markers like
Cleaved Amplified Polymorphic Sequences (CAPS), Sequence Characterised Amplified Region (SCAR) or Sequence Tag Sites (STS). These techniques are based on sequencing and design of specific primer pairs. Expressed Sequence Tags (ESTs), which are useful tools in gene discovery, comply with STS markers. Their sequence and location in the genome are known but ESTs derive from cDNA clones (JOSHI et al. 1999). In addition, there are several functional and gene targeted markers described like ACGMs (Amplified consensus genetic markers), GSTs (Gene specific tags), RGAs (Resistance gene analogues) or ERAP (Exon-Retrotransposon amplification polymorphism), which are ideal tools for marker-assisted selection (GUPTA & VARSHNEY 2000, ANDERSEN & LÜBBERSTEDT 2003, GUPTA & RUSTGI 2004, BAGGE et al. 2007).
2.4 Application of molecular markers in plant breeding
The development of molecular markers was an important step for plant breeding and opened a new area of molecular plant breeding. Molecular markers and especially PCR-based marker systems facilitate genotyping and the assessment of genetic diversity, the construction of linkage maps and the application in marker-assisted breeding. Further on, molecular markers ease pyramiding of genes, e.g. resistance genes, the detection of Quantitative trait loci (QTL) as well as the acceleration of back crossing procedures (ORDON et al. 2004b, WERNER et al. 2005).
2.4.1 Genetic linkage maps
To construct a genetic linkage map the grouping of linked markers into linkage groups and the arrangement of the known markers to each other within this group is necessary. This involves coding data for each marker on each individual of a segregating population, e.g. a DH population, and later on linkage analysis using software programmes like MapMaker (LANDER et al. 1987) or JoinMap (STAM & VAN OOIJEN 1995) to detect linkage groups and construct genetic maps. The linkage between two markers is usually measured by likelihood of odds ratio, which calculates the ratio of linkage versus no linkage (COLLARD et al. 2005). This ratio is worded as the logarithm of the ratio and is called a logarithm of the odds value (LOD) or LOD score (RISCH 1992). Usually, LOD values over 3.0 are taken for the construction of linkage maps, viz this value between two markers indicates that the
linkage is 1,000 times more likely than no linkage. The arrangement of markers is based on the frequencies of recombination between them. By means of mapping functions, recombination fractions are converted into genetic distances assessed in centiMorgan (cM), because of the non-linearity of recombination frequency, i.e. the frequency of crossing-over (COLLARD et al. 2005). The Kosambi mapping function (KOSAMBI 1944) and the Haldane mapping function (HALDANE 1919) are the most commonly used ones. Whereas Haldane expects no interference between crossing over, Kosambi assumes that a recombination event gains influence on the occurrence of a neighbouring recombination event (HARTL & JONES 2001). Genetic linkage maps are necessary for the identification of chromosomal regions, which possess ‘genes of interest’ or traits controlled by one or more genes, the identification of genetic markers closely linked to these important traits, for synteny studies (comparing genomes of different species) or for genome sequencing (MOHAN et al. 1997). The first barley linkage map was constructed by KLEINHOFS et al. (1988) with RFLP markers for chromosome 6H. A few years later more detailed maps of the whole genome were created based on different types of populations (GRANER et al. 1991, HEUN et al. 1991, KLEINHOFS et al. 1993). Other markers like AFLPs (WAUGH et al. 1997) or SSRs (BECKER & HEUN 1995, LIU et al. 1996, LI et al. 2003) were integrated in already existing maps to enhance the marker density. RAMSAY et al. (2000) established the first linkage map using only microsatellites. Further on, EST-derived SSRs were integrated into molecular maps (PILLEN et al. 2000, THIEL et al. 2003). Herefrom, a strong clustering of microsatellites markers around the centromeres of all chromosomes was observed (RAMSAY et al. 2000, LI et al. 2003), which results from suppressed recombination events in the centromeric regions (KÜNZEL et al. 2000) and leads further on to an incomplete genome coverage. Among others, WENZL et al. (2006) constructed a barley consensus map, which combines different maps with DArT markers to improve the genome coverage. Corresponding dense molecular linkage maps of other crops of worldwide importance like rice (MCCOUCH et al. 2002), maize (SHAROPOVA et al. 2002), sorghum (MENZ et al. 2002), wheat (SOMERS et al. 2004, SONG et al. 2005), rape seed (KIM et al. 2006) and grapevine (DOLIGEZ et al. 2006) are available.
The knowledge of the position of molecular markers on these linkage maps is very useful for the identification of closely linked markers to genes encoding important
traits, and allows e.g. the precise localization of resistance genes. Several recessive resistance genes are mapped in barley using Bulked Segregant Analysis (BSA, see chapter 3.5, MICHELMORE et al. 1991). One of the first successful reports on the application of BSA in barley was the mapping of resistance genes against powdery mildew by GIESE et al. (1993), where the RFLP marker ris16 was closely mapped to
the resistance gene MlLa on chromosome 2H within a distance of 1 cM. Furthermore,
GARVIN et al. (2000) mapped the scald resistance gene Rrs14 by using BSA on
chromosome 1H closely linked to the STS marker Hor2 with a distance of 1.8 cM to
the resistance locus (for an overview of all resistance genes already mapped by close association with DNA markers see CHELKOWSKI et al. (2003), WILLIAMS (2003) and ORDON et al. (2004b)). A high number of studies have demonstrated the identification of Quantitative Trait Loci (QTL) in many crop species based on existing genetic linkage maps. The principle of QTL analysis is to separate the mapping population into different groups with respect to the presence or absence of a genotype at a marker locus and to determine the differences, which exist between these groups on the phenotypic level with respect to a quantitative trait. If the phenotypes between groups differ significantly, the marker locus, which partitions the groups, is linked to a QTL. There are three different methods to detect a QTL: (1) single-marker analysis, (2) simple interval mapping (SIM) and (3) composite interval mapping (CIM, COLLARD et al. 2005), whereas CIM is the most common one (JANSEN & STAM 1994). In cereals, many QTL for major agronomic traits have been described. In barley, several markers for QTL of agronomic traits have been identified so far. These works include QTL for yield (VON KORFF et al. 2006), disease resistances like barley yellow dwarf virus (SCHEURER et al. 2000) or scald (ZHAN et al. 2007), and leaf rust (MARCEL et al. 2007). Further on, e.g. SOMERS et al. (1998) identified RAPD markers linked with linoleic acid desaturation in Brassica rapa, and AFLP and SSR markers could be detected for Fusarium head blight
resistance in wheat (BUERSTMAYR et al. 2002, LIU & ANDERSON 2003). In other crop species NARASIMHAMOORTHY et al. (2007) recently found markers for QTL associated with the aluminium tolerance in alfalfa.
These molecular markers, which are closely linked to a gene of interest or to a QTL, can be used for marker-assisted selection (MAS). The specific DNA marker alleles can be applied for an indirect selection of DH populations, which are used for fixation of the traits, to identify genes of interest in the seedling stage and furthermore to
screen for the genetic background (VARSHNEY et al. 2006, TUVESSON et al. 2007). This method simplifies the work of plant breeders due to the great efficiency of marker assisted selection (MAS). One example of the sufficient use of MAS in barley breeding is the incorporation of resistances into the existent barley breeding materials against the barley yellow mosaic virus complex. Until now, several markers for the selection of resistance gene loci have been developed (ORDON et al. 2003, 2004b). The most common one is the SSR marker Bmac0029, which is used by many barley breeders for the selection of the rym4 and rym5 resistance genes (RAE
et al. 2007). Furthermore, MAS offers the opportunity for the accomplishment of gene pyramiding. This has been shown in many crops like wheat (LIU et al. 2000), cotton (GUO et al. 2005), rice (ZHANG et al. 2006) and barley (WERNER et al. 2005, 2007). The use of tightly linked markers to a gene of interest is also the basis for map-based cloning, in which the marker is used as a probe for the screening of a genomic library (COLLARD et al. 2005), e.g. in barley based on a high resolution mapping (PELLIO et al. 2005). The resistance locus rym4/rym5 was isolated (STEIN et al. 2005)
facilitating the production of ideal diagnostic marker, i.e. allele specific markers. The map based cloning strategy has been applied in several crop species (for overview STEIN & GRANER 2004).
2.4.2 Genetic diversity
Genetic diversity represents the multifariousness within and between groups of individuals or populations. The knowledge of this pool of genetic variation for these individuals or within a population is necessary for breeding purposes (RAO & HODGKIN 2002). Genetic diversity is estimated based on differences in DNA sequences and these DNA-based marker data facilitate the reliable differentiation of genotypes. Molecular marker-based genetic diversity can be expressed and presented by different estimators and approaches like genetic diversity, genetic similarity respectively distance, population structure and cluster analysis (LABATE 2000).
Frequently used methods for the estimation of genetic similarity and distance, respectively, are the NEI and LI coefficient (1979), JACCARDs coefficient (1908), modified ROGERs’ distance (WRIGHT 1978) and the simple matching coefficient
between these four methods are due to their emphasis of monomorphic or polymorphic alleles. Whereas JACCARD just considers fragments, which are present in all individuals, and ignores fragments, which are absent in both individuals. NEI & LI measures the proportion of alleles, which are present and shared in each individual. Modified ROGERs distance includes every locus scored as an orthogonal dimension and SMC considers the fragments, which are present and absent (MOHAMMADI et al. 2003). Due to this different emphasis on present and absent alleles, JACCARD is commonly used for dominant markers and NEI & LI for codominant markers (SCHÖN et al. 1997). Based on the matrix of genetic distances/similarities cluster analyses can be carried out. Cluster analysis is a statistical procedure, which groups individuals or populations into subsets or clusters based on their common traits. The clustering methods can be differentiated into two groups, herein after referred to as (1) the distance-based method and (2) the Bayesian model-based method. The main principle of the first one is the calculation with a pair-wise distance matrix as an input, whereas the model-based method assumes that the observations from each cluster are random draws from some parametric model (PRITCHARD et al. 2000). Distance-based methods are divided into two groups: (1) hierarchical procedure, where single individuals are treated separately before grouping into bigger clusters, and (2) non-hierarchical procedures, which is rarely used for the estimation of genetic diversity (MOHAMMADI et al. 2003). Among different hierarchical procedures known, the Unweighted Paired Group Method using Arithmetic averages (UPGMA) is due to the high level of accuracy the
most frequently used one (MOHAMMADI et al. 2003).
The genetic diversity (H) is based on the number of alleles per locus and the frequency of alleles per locus. The most frequently used index is the gene diversity index by NEI (1973), which is a measure of the probability that two genotypes chosen randomly out of the population possess different alleles (KREMER et al. 1998). Another diversity measure is the Shannon-Weaver Index (H’, SHANNON & WEAVER 1949). In contrast to the gene diversity index by NEI (1973) the Shannon-Weaver Index doesn’t prerequisite the Hardy-Weinberg equilibrium (FRITSCH & RIESEBERG 1996). Genetic diversity is of prime interest for plant breeding. Due to the variation in allele frequency within species a selection is possible to change populations and to introduce new varieties into breeding populations. Furthermore, the breeding system of the species is significant for the evaluation of differences between populations
from different geographical regions (RAO & HODGKIN 2002). For the estimation of genetic diversity DNA-based markers are an efficient tool. Attention should be paid to the differences in genetic diversity resulting from different markers and their amount of genome coverage (STAUB et al. 1997). In cereals and other crop species, many studies about genetic diversity have been described, e.g. in barley (AHLEMEYER et al. 2006, PANDEY et al. 2006), wheat (REIF et al. 2005, HAI et al. 2007) or rapeseed (HASAN et al. 2006).
3 Material and Methods
3.1 Plant Material
3.1.1 Identification of new resistance resources of barley against the barley yellow mosaic virus complex
120 exotic barley germplasms, resistant against BaYMV in Japan, have been screened with the microsatellite marker Bmac0029 closely linked to the rym4/rym5
locus (GRANER et al. 1999a) in order to identify new resistance donors carrying resistance genes different from rym4 and rym5 which are at present widely used in
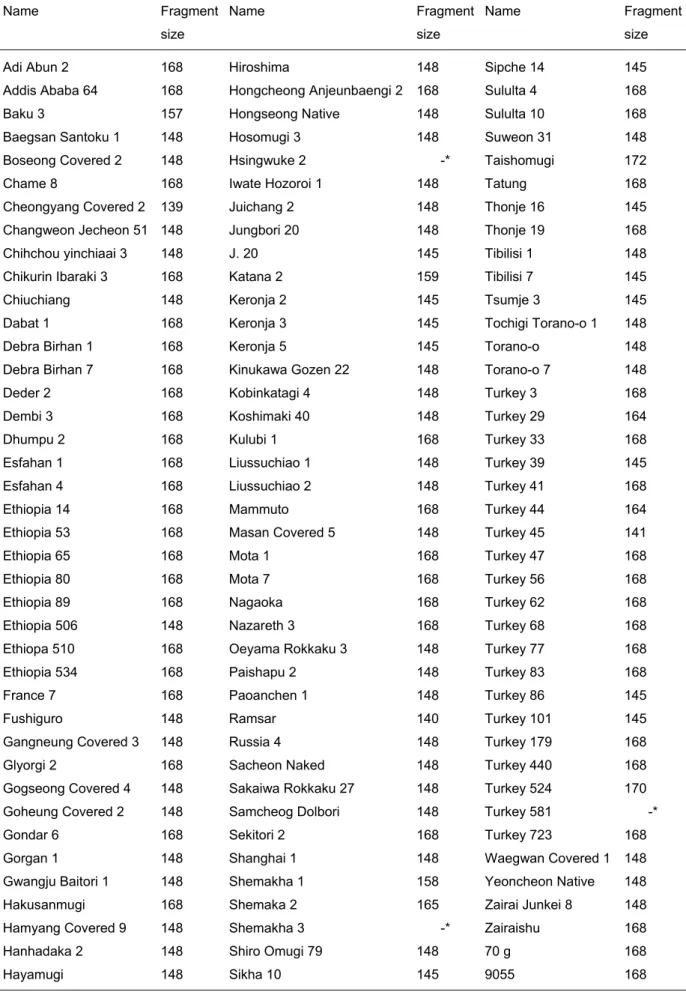
European barley breeding programmes. Most of the 120 barley accessions mainly originated from China, Nepal, Japan, Russia, Ethiopia and Turkey (Table 2) were provided by the Barley Germplasm Centre, Research Institute for Bioresources, Okayama University, Japan.
Table 2: New resistance resources of barley against the BaYMV-complex.
Name Origin Name Origin
J. 20 Afghanistan Debra Birhan 1 Ethiopia
9055 Austria Debra Birhan 7 Ethiopia
Baku 3 Azerbaijan Deder 2 Ethiopia
Shemakha 1 Azerbaijan Dembi 3 Ethiopia
Shemaka 2 Azerbaijan Ethiopia 14 Ethiopia
Shemakha 3 Azerbaijan Ethiopia 53 Ethiopia
Chiuchiang China Ethiopia 65 Ethiopia
Chihchou Yinchiaai 3 China Ethiopia 80 Ethiopia
Hsingwuke 2 China Ethiopia 89 Ethiopia
Juichang 2 China Ethiopia 506 Ethiopia
Liussuchiao 1 China Ethiopia 510 Ethiopia
Liussuchiao 2 China Ethiopia 534 Ethiopia
Paishapu 2 China Gondar 6 Ethiopia
Paoanchen 1 China Glyorgi 2 Ethiopia
Shanghai 1 China Kulubi 1 Ethiopia
Tatung China Mota 1 Ethiopia
Addis Ababa 64 Ethiopia Mota 7 Ethiopia
Adi Abun 2 Ethiopia Nazareth 3 Ethiopia
Name Origin Name Origin
Sululta 10 Ethiopia Jungbori 20 Korea
France 7 France Masan Covered 5 Korea
Tibilisi 1 Georgia Sacheon Naked Korea
Tibilisi 7 Georgia Samcheog Dolbori Korea
Mammuto Germany Suweon 31 Korea
Esfahan 1 Iran Waegwan Covered 1 Korea
Esfahan 4 Iran Yeoncheon Native Korea
Gorgan 1 Iran Zairaishu Korea
Ramsar Iran Zairai Junkei 8 Korea
70 g Iran Chame 8 Nepal
Chikurin Ibaraki 3 Japan Dhumpu 2 Nepal
Fushiguro Japan Keronja 2 Nepal
Hakusanmugi Japan Keronja 3 Nepal
Hanhadaka 2 Japan Keronja 5 Nepal
Hayamugi Japan Sikha 10 Nepal
Hiroshima Japan Sipche 14 Nepal
Hosomugi 3 Japan Thonje 16 Nepal
Iwate Hozoroi 1 Japan Thonje 19 Nepal
Kinukawa Gozen 22 Japan Tsumje 3 Nepal
Kobinkatagi 4 Japan Katana 2 Syria
Koshimaki 40 Japan Turkey 3 Turkey
Nagaoka Japan Turkey 29 Turkey
Oeyama Rokkaku 3 Japan Turkey 33 Turkey
Sakaiwa Rokkaku 27 Japan Turkey 39 Turkey
Sekitori 2 Japan Turkey 41 Turkey
Shiro Omugi 79 Japan Turkey 44 Turkey
Taishomugi Japan Turkey 45 Turkey
Tochigi Torano-o 1 Japan Turkey 47 Turkey
Torano-o Japan Turkey 56 Turkey
Torano-o 7 Japan Turkey 62 Turkey
Baegsan Santoku 1 Korea Turkey 68 Turkey
Boseong Covered 3 Korea Turkey 77 Turkey
Changweon Jecheon 5-1 Korea Turkey 83 Turkey
Cheongyang Covered 2 Korea Turkey 86 Turkey
Gangneung Covered 3 Korea Turkey 101 Turkey
Gogseong Covered 4 Korea Turkey 179 Turkey
Goheung Covered 2 Korea Turkey 440 Turkey
Gwangju Baitori 1 Korea Turkey 524 Turkey
Hamyang Covered 9 Korea Turkey 581 Turkey
Hongcheon Anjeunbaengi 2 Korea Turkey 723 Turkey
3.1.2 Mapping populations used for the development of new PCR-based DNA markers for resistance genes against BaMMV, BaYMV-1 and BaYMV-2
For the mapping approach of currently unknown resistance genes against the BaYMV complex seven different crosses with original exotic resistance donors have been generated and used. The mapping populations have been provided by the plant breeding companies Pajbjergfonden, Odder, Denmark, Florimond-Desprez, Cappelle en Pévèle, France and the Institute of Crop Science and Plant Breeding I, University of Giessen and herein referred to as MAP1-7.
3.1.2.1 Mapping population 1 (MAP 1)
The doubled haploid (DH) population MAP1 consists of 94 lines derived from a cross between the resistance donor ‘Cebada’ and the German susceptible two-rowed cultivar ‘Cleopatra’.
3.1.2.2 Mapping population 2 (MAP 2)
A number of 54 anther-derived DH lines of the Japanese cultivar ‘Shimane Omugi’ crossed with the susceptible cultivar ‘Sumo’ as well as 65 additional DH lines of the cross ‘Shimane Omugi’ with the German susceptible two-rowed cultivar ‘Gilberta’ were used for genetic mapping.
3.1.2.3 Mapping population 3 (MAP 3)
MAP 3 was developed by crossing the resistance donor ‘CI 3517’ with the susceptible two-rowed cultivar ‘Reni’ and comprises 80 DH lines.
3.1.2.4 Mapping population 4 (MAP 4)
A progeny of 131 DH lines of the cross between the resistance donor ‘Belts 1823’ and the German cultivar ‘Franziska’ were used for marker development. ‘Franziska’ is carrying rym4 and is therefore known to be resistant against BaMMV and BaYMV-1
in Europe.
3.1.2.5 Mapping population 5 (MAP 5)
The Japanese resistant six-rowed cultivar ‘Chikurin Ibaraki 1’ was crossed with the German susceptible two-rowed winter barley cultivar ‘Igri’. The DH population, which
derived from the F1 generation by anther culture, comprised 163 DH lines. ‘Chikurin Ibaraki 1’ shows resistance against all three types of the BaYMV complex in Europe but is susceptible to BaYMV in Japan (GOETZ & FRIEDT 1993).
3.1.2.6 Mapping population 6 (MAP 6)
A subset of the original population from the cross between the Taiwanese six rowed cultivar ‘Taihoku A’ and the French susceptible cultivar ‘Plaisant’ (WERNER et al. 2003b) was used for the development of closer linked markers. The original subset comprised 90 DH lines which was later enlarged to 154 DH lines of the same cross. ‘Taihoku A’ is known to be resistant to BaMMV and BaYMV/BaYMV-2 (GOETZ & FRIEDT 1993).
3.1.2.7 Mapping population 7 (MAP 7)
MAP 7 is composed of 151 DH lines derived from a cross of the Korean resistance donor ‘Muju covered 2’ with the susceptible cultivar ‘Spirit’. Like ‘Taihoku A’, ‘Muju covered 2’ is resistant to BaMMV, BaYMV/BaYMV-2, and to the new German BaMMV-strain (GOETZ & FRIEDT 1993, HABEKUSS et al. 2006).
3.1.3 Wheat cultivars used for fingerprinting and studies on genetic diversity
Different wheat lines provided by different co-operation partners (W. von Borries-Eckendorf, Germany; Pajbjergfonden, Denmark; Florimond-Deprez, France) were screened for resistance against SBCMV and WSSMV in France in 2003 and 2004. Based on resistance screening in the field, 64 interesting wheat lines were selected and used for genotyping (Table 3).