Andrew Weiss Georgiy Nikitin Dept. of Economics Boston University Boston, MA 02215 Boston, July 8, 1998.
Our main finding is that ownership concentration in the Czech Republic is associated with improvements in the performance of operating companies, but only if ownership is concentrated in hands other than investment funds. We assessed the effects of ownership structure on economic performance by measuring the relationship between annual changes in performance and changes in the composition of ownership shares during the previous year. Previous studies measured the association between levels of performance and the composition of ownership. We used robust estimation techniques, in addition to OLS estimation.
*
Funding for this research was supplied by the World Bank. We are grateful to seminar participants at the World Bank and to Gerard Caprio for valuable comments and suggestions.
Introduction
In a modern capitalist economy, one of the most important problems is the separation between ownership and control of corporations. The chief executive officer of a large firm rarely owns the firm. The separation between ownership (by shareholders) and control (by managers) can cause serious inefficiencies in the management of a firm.
The economic justification for capitalism is based in large part on the assumption of profit maximizing behavior by firms. However, firms do not make decisions. People make decisions. Rational utility maximizing behavior by managers is not sufficient to induce profit-maximizing behavior. More is required. There must be incentives for managers to maximize profits, as well as mechanisms to hire and retain competent managers (relative to their
remuneration) so that returns to shareholders are maximized. These incentives will be a function of the ownership structure of firms, the ability of the shareholder-voters to influence
management, and the regulatory and legal environment.
Problems associated with the separation of ownership and control in capitalist economies were the focus of a recent paper by Shleifer and Vishny.1 While the Shleifer and Vishny paper did not pay particular attention to transition economies in which ownership of firms was
transferred to individual citizens (rather than being sold to outside investors), the problems they discussed are potentially most severe in those economies. The process by which ownership in firms was transferred to individual citizens was normally through the granting of vouchers. These vouchers were used to bid for shares in companies or in investment funds.
The Czech voucher privatization program resulted in a larger share of industrial and commercial assets being transferred to ordinary citizens than in any other post-Communist country (and probably, more than in any country in the world). This privatization program created an especially distinct separation between ownership and control. The magnitude of the effects of that separation seems to have been affected by ownership composition; we would assume the effects would be greatest when ownership is diffused over many small Czech investors. These problems may be less severe when shareholders have a strong economic
1
incentive to increase the profitability of the firm and sufficient power to influence managers to work in that direction.
Normally the natural growth of firms limits the adverse impact of the separation of ownership and control. In a market economy, firms are founded by owner-managers with their own funds, or loans that are collateralized by their personal assets, or with money invested (or loaned) by family members. At this stage - when the managers of the firm are the owners, or are closely affiliated with the owners - the interests of owners and managers are usually the same or very closely related. If these firms grow through reinvesting earnings, problems involving the separation of ownership and control will not arise until the ownership shares of the original founder are diffused among several holders either through gifts or bequests.2
Eventually most large firms need outside capital to finance growth. However, private investors will not provide capital unless they receive some control over management and/or have security for their investment. The control over management would generally extend to the ability to replace managers and to monitor the actions of managers in order to induce them to act in the interests of investors. The first outside investors often demand majority representation on the board of directors, and it is not uncommon for them to replace the initial entrepreneurs with experienced managers. Provisions to protect the interests of minority shareholders are often embedded in the charters of publicly traded companies. In addition, outside investors who do not have control over the company will usually demand provisions that will ensure that minority rights are protected, and will be especially wary about investing in countries in which the legal and regulatory systems are too weak to adequately protect their interests. Finally, even if ownership is diffuse the threat of takeovers, which would enable a shareholder to accumulate a controlling interest, could induce management to act in the interests of shareholders. This reduces the surplus to be gained from a transfer in control.
2
The problems of succession of a controlling owner are similar to those in many transition economies. In both cases safeguards for shareholder rights were not required to raise capital. The owners were given ownership of the firm - and were not in a position to demand a measure of control to accompany that ownership. We would expect that in these firms, if the interests of the new owners are not aligned, as is often the case if there is a family friction, or if the heirs are from different marriages, managerial problems are likely to be more severe than in firms which grew through outside finance. Control by the original founder can induce its own problems if the founder loses
competence and is not aware of that loss, or places a greater personal value on controlling the company than on managing it most efficiently.
Despite these safeguards, shareholders in advanced capitalist economies often find it difficult either to replace incompetent managers or to induce existing managers to act in ways that maximize shareholders value. We would expect problems associated with the separation of ownership and control to be greater in post-Communist countries than in most other capitalist economies. In the Czech Republic, an entire state owned economy was transformed into a mere pretense of what a capitalist economy should be. Managers of the firms did not have to compete for outside funds to raise capital: assets were inherited from the state. The managers were not major shareholders of the firms they were managing and thus, did not have a personal incentive to maximize the value of the firm. When major shareholders exist, they are most often either
investment funds or the Fund for National Property (a state owned entity). Neither the managers of the investment funds, nor the head of the Fund for National Property (FNP) has strong incentives to maximize the value of the firms in which their institutions own shares. In the case of the investment funds, the lack of incentives stems from the closed-end fund structure. Because shares cannot be redeemed but can only be sold to other shareholders, poor performance by an investment fund has a relatively small effect on the amount of funds under management. Fall in the price of the investment funds does not affect management fees. The poor incentives for the Fund for National Property to improve the performance of operating companies are those associated with any state owned enterprise.
For these reasons, we would expect the problems associated with the separation of ownership and control to be especially severe in the Czech Republic.3 The privatization process in the Czech Republic transferred nominal ownership of firms from the state to private hands, but had little effect on the incentives for managers of operating companies to maximize profits.
The privatization process in the Czech Republic provides an interesting setting in which to measure the effects of ownership structure on performance. As we shall see, firms which have concentrated ownership, and in which the ownership is concentrated outside the investment funds, seem to perform better than firms with either diffuse ownership or firms in which major owners are investment funds.
3
The commission opinion, which evaluated the Czech Republic's application for membership in the European Union, blamed the method of privatization for weaknesses in corporate governance (see page 20 of the Commission Opinion).
Brief History of Czech Privatization
Under communism, 97% of the GDP in Czechoslovakia was produced by state owned enterprises. With the possible exceptions of East Germany and Albania, this was the highest proportion of any country in Eastern Europe or the former Soviet Union. Currently the Czech Republic has only 1/3 of its GDP produced by state owned firms - the smallest percentage of any of the former Communist countries.4 This rapid transformation was accomplished by allowing citizens to buy vouchers (at a nominal cost) which they could use either to bid for shares in previously state owned companies, or to exchange for shares in publicly traded investment funds. Those funds would in turn use the vouchers to bid for shares in companies. Roughly 70% of citizens exchanged their vouchers for shares in closed-end investment funds. Both individuals and funds then used the vouchers to bid for shares in companies.5 The bidding process had multiple rounds. At the beginning of each round the government would announce a price and voucher holders would submit their vouchers for shares in a company. If supply exceeded demand, all shares were allocated at the asking price. On the other hand, if demand exceeded supply by more than 25% the price would be adjusted upward and there would be another round of bidding, otherwise the shares would be distributed pro-rata among the bidders. The bidding stopped when demand did not exceed supply by more than 25%.6
During the first mass privatization, in 1992, 965 Czech companies were available for purchase through vouchers. These companies had a book value of approximately $7 billion.7 The mean book value was approximately $7 million, but the median book value was considerably lower. The market capitalization of the median publicly traded firm in the Czech Republic was probably below $1 million. By international standards, it is quite extraordinary for the firms which are that small to be publicly traded. In the US, there is roughly one publicly traded company per billion dollars of the GDP. In the Czech Republic, the ratio is 30 publicly traded
4
Dyba Karel and Jan Svejnar. 1994. ÒAn Overview of Recent Economic Developments in the Czech Republic,Ó Working
Paper Series 61, CERGE-EI , p. 45.
5
Fund managers were inexperienced, and the funds themselves could be established with a very small capital base. Fund managers could choose either to be paid a fixed percentage of the assets under management, not to exceed 2%, or to share in the profits of the fund. Almost all managers chose to receive a fixed share of assets. The market price of funds rapidly fell to large discounts to the value of the assets owned by the fund.
6
van Wijnbergen, Sweder and Anton Marcincin. 1995. "Voucher Privatization, Corporate Control and the Cost of Capital: an Analysis of the Czech Republic Privatization Programme", Centre for Economic Policy Research Discussion Paper No. 1215, pp. 4-5.
companies per billion dollars of the GDP.8 This high ratio of publicly traded companies per unit of GDP is not characteristic of the former Communist countries, e.g., the ratio in Hungary is roughly the same as that in the US.
As was noted in the introduction, publicly traded Czech firms came into existence with assets that were inherited from the state. Firms have not had to raise outside capital. Corporate statutes ensuring that management would be responsive to shareholder interests were not needed in order to attract capital. Such statutes are typically absent in Czech companies. The
shareholders in most Czech firms can only control management through threats to take over the company and replace the management or through appeals to the courts. Neither of these threats is credible. Hostile takeovers have been notably unsuccessful in the Czech Republic. Takeover bids were often tied up in the courts for long periods while the old management continued to run the companies for their own benefit. Appeals to the courts for protection of minority
shareholder rights are even less promising. There is a large backlog of cases, there are few
precedents to guide the judiciary, and the judiciary lacks expertise in securities law. Furthermore, the ownership structure affects the credibility of these threats. If ownership is diffuse or if major ownership positions are held by investment funds, then there may be no owner with sufficient incentives and capabilities to replace ineffective management. For bank managed funds, it may be more profitable for the parent bank to maintain good relations with the managers of the operating companies than to have the bank controlled funds try to displace these managers. The managers of operating companies can secure their own positions by maintaining banking relationships with the parent companies of bank managed funds.
Under these circumstances, we would expect companies with diffuse ownership to perform worse than companies with concentrated ownership. We would also expect that when ownership is concentrated in the hands of a few closed-end investment funds, performance would be worse than when strategic investors exercise control. The closed-end funds are themselves acting as agents of the true beneficiaries of good performance by the operating companies the shareholders of the funds. Thus, when closed-end funds are the major owners of firms, we would
7
Lastovicka, R., A. Marcincin, and M. Mejstrik ÒCorporate Governance and Share Prices in Voucher Privatized
CompaniesÓ in The Czech Republic and Economic Transition in Eastern Europe , 1995, p. 201.
8
The GDP data are from International Financial Statistics, IMF; the traded companiesÕ data are from the International Finance CorporationÕs Emerging Stock Markets Factbook 1997.
expect the problems of the separation between ownership and control to be more severe than when the major shareholders are operating companies, open-end funds or individuals.
Managers of closed-end funds have different incentives than the managers of open-end funds. The managers of open-end funds almost always lose assets if their portfolios perform poorly, shareholders simply redeem their shares. This redemption process automatically reduces the influence on the economy of ineffective fund managers. By contrast, the manager of a closed-end fund has little incentive to improve the performance of the operating companies in which the fund has invested. Their fees are independent share prices.9
Given these different incentives, it is not surprising that in the US there are fewer than 40 closed-end funds investing in US securities. The closed-end funds are much smaller than the open-end funds: the proportion of US assets managed by closed-end funds is a trivial fraction of assets managed by open-end funds. By contrast, up through 1997 there were several hundred closed-end funds in the Czech Republic that invested primarily in Czech equities (160 of them were actively traded). There are few open-end funds in the Czech Republic and the amount of assets managed by open-end funds is insignificant compared with the assets managed by the closed-end fund industry.
Managers of closed-end funds in the Czech Republic were only motivated to improve the performance of the operating companies in which they invested if they planned to market a new fund, raise additional capital for the existing funds, or forestall attempts by shareholders to change managers. There were only two "waves" of voucher privatization, 1992-3 and 1994-5 in which the public could have used vouchers to bid for shares in operating companies. Prior to each of these waves, vouchers were distributed to Czech citizens, and investment funds were established to attract vouchers. Funds established during the first wave of privatization could not bid for vouchers in the second wave. However, the managers of first wave funds could
establish second wave funds. Therefore, there was a financial incentive for investment companies that were managing funds established in the first wave to perform well in 1993, since that
performance would affect their ability to attract vouchers for the funds they intended to establish in the second wave. Subsequent to marketing the second wave funds in 1993-4, there have been
9
Performance based fees are rare in the Czech Republic and are severely limited in the US. In Poland, fund managers are reimbursed the percentage of assets under management control. They also receive 15% of the funds
no opportunities to market new funds, and none are anticipated. The Czech funds all sell at substantial discounts to their net asset value and have done so since they were founded,
effectively eliminating the possibility of raising additional funds through secondary offerings, or through marketing a new fund.10 There have been few attempts to remove funds managers. Most fund managers have long term contracts. Share ownership is typically diffuse and proxy voting is both difficult and expensive, because it requires notarization. Finally, in a case in which a major shareholder (Czech Value Trust) removed the managers of an investment fund (Trend fund), by the time the new managers gained control, there were almost no assets left in the fund. Since that fiasco, there have been no attempts at hostile removals of fund managers, and
therefore, little financial incentive for a fund manager to increase the value of the fund's portfolio. Although this paper is concerned with the effects of ownership on performance of operating companies, a perhaps equally important aspect of voucher privatization is its effect on the psychology of the populace. Voucher privatization was intended to build support for the market economy by making the populace the shareholders of privatized firms. Instead, in the Czech Republic, public opinion polls find large majorities reporting that they believed the voucher privatization program was a means to enrich a few individuals at the expense of the rest of the society. As major shareholders of companies, the investment funds not only did not stop the diversion of the funds from the companies to managers, but also often colluded in that process. A 1997 report of the capital markets division of the Czech Finance Ministry, strongly condemned the administration of closed end funds. The report found that fund mangers often enrich themselves at the expense of the shareholders of the fund. They divert monies from the investment funds into other joint stock companies that they control, or these companies share the gains from the diversion of funds with the fund manager.
The various mechanisms by which funds were diverted include:11
assets after 10 years. Hedge fund managers in the U.S. are typically reimbursed for the share of funds under
management control and for the share of profits.
10
For the last three years the average discounts in the Czech Republic and Slovakia have been the largest in the world. The funds in Slovakia were founded during the first wave of privatization when the two countries were parts of Czechoslovakia, and thus the management terms and genesis of the Slovak funds are exactly the same as those of the Czech funds.
11
See Veverka, Jan, "Current Aspects of the Czech Capital Market", Working Paper, Ministry of Finance of the Czech Republic, 1997.
• Writing contracts to deliver securities with large fines for failure to deliver, or to comply with the terms of the contract. The fund manager then fails to comply, the fund pays the fine, which eventually accrues to the manager.
• Prices of illiquid securities are manipulated to very high levels and then either sold to the fund, or traded for fairly valued liquid securities. In some cases these securities were originally purchased from the fund.
• Writing contracts on derivatives with terms that are highly unfavorable to the investment fund. In some cases the other party can choose whether or not to exercise the contract with no cost for this option.
• Cash is transferred from the investment fund to non-interest bearing uninsured account at a securities dealer, as advanced payment for securities. The dealer then speculates with these funds.
• Securities are sold with payments due several years in the future, or spread over periods as long as 30 years. The party owing the money sells the securities, distributes the revenue, and declares bankruptcy.
• Purchase of secondary issues of stocks at above market prices.
These are only some of the mechanisms used by fund managers to enrich themselves. Other techniques include a case in which a bank managed fund, sold all the securities owned by the fund, and deposited the cash in a non-interest bearing account at the bank. In other cases, fund managers had enough shares to be able to vote to convert the fund into an industrial holding company, which effectively gave them complete control over the assets.
A typical Czech citizen had a large fraction of his assets invested in these funds, so that massive thefts inflicted great hardship. However, the worst long-term consequence is that for many Czech citizens free market capitalism became associated with tolerance for embezzlement and fraud. The wealthiest citizens in the Czech Republic are typically people who have made no noticeable contribution to Czech society, but were associated with the investment funds.
Previous Research
Several papers have been written looking at the effects of ownership structure on firm performance in the Czech Republic. Economists at the World Bank did much of that research.12 Several problems exist with that research. The most serious shortcoming is that performance was usually measured in levels rather than in changes in levels. Consequently, if investment funds invested in well-managed companies, the research concluded that investment funds had a positive effect on managerial performance. The important issue of whether ownership structure improved or hurt performance, rather than whether certain types of owners gravitated toward relatively more profitable firms, was often not addressed. Presumably, these choices would have been affected by risk preferences, access to stock and private information, and habits of different types of investors. In most countries there is a tendency for workers who buy stock to invest in own companies. This tendency is probably stronger in Eastern Europe where employees are often able to buy shares in their own companies below market prices.
The paper by Radek Lastovicka et al uses stock market prices to measure performance.13 They find that ownership by investment funds results in high ratios of price to book value. Again that measure is misleading since competition for shares would cause stock prices to rise.14 If shares are owned by funds, then it is likely to mean that the funds were bidding against one another during the voucher privatization program causing share prices to become inflated. Shares that are owned mainly by employees are less likely to have been the object of bidding wars. Also in the Czech Republic, the book value of firms is far different than the market value, since it reflects the value of raw materials used to construct plant and equipment rather than the
usefulness or productivity of these assets. Even if we were to ignore these statistical problems, there is a fundamental problem with the overall approach. If the ratio of share price to asset value of stocks in the portfolios of the investment funds is a useful measure of the performance
12
Claessens, Stijn. 1995. ÒCorporate Governance and Equity Prices. Evidence from Czech and Slovak Republics,Ó
World Bank Policy Research Working Paper No. 1427 ; Pohl, Gerhard, Gregory T. Jedrzejczak and Robert E.
Anderson. 1997. ÒCreating Capital Markets in Central and Eastern Europe,Ó World Bank Technical Paper No. 295 ;
Pohl, Gerhard, Robert E. Anderson, Stijn Claessens and Simeon Djankov. 1997. ÒPrivatization and Restructuring in Central and Eastern Europe,Ó World Bank Technical Paper No. 368.
13
Lastovicka, Radek, Anton Marcincin and Michal Mejstrik. 1995. ÒCorporate Governance and Share Prices in
Voucher Privatized Companies.Ó The Czech Republic and Economic Transition in Eastern Europe ].
14
Even in a market as liquid as the US, exogenous increases in the level of demand have major effects on share prices. This suggests that the demand for shares of individual companies is inelastic. One example of such an exogenous increase could be inclusion of the share in S&P 500.
of the fund managers, then the low ratio of prices to net asset value of funds would be prima facie evidence of poor performance by the fund managers. When a fund is trading at less than 50% of the assets in its portfolio, as has often been the case in the Czech Republic, then using the ratio of share price to asset value, as Radek Lastovicka et al do, as support for the
proposition that fund managers are creating value, would more directly suggest that the fund managers are destroying more than 50% of the value of the fund.15 In the face of this evidence, it seems odd to argue that fund managers are contributing value because the prices of the shares they hold are high relative to the reported book value of these shares. If stock prices are to be used to measure performance, then the direct evidence from the prices of the funds themselves relative to their asset values is a better measure of the contribution of fund managers than is indirect evidence from share prices of the companies in which they invest.
15
Recently, discounts have narrowed in anticipation of legislation mandating the open-ending of funds trading at discounts above a given level. The legislation passed the lower house on April 17, 1998.
Empirical Results
The goal of our research is to analyze the relationship between the composition of ownership and subsequent changes in the performance of Czech enterprises. The main problem we must confront in this research is the endogeneity of the composition of share ownership. If the criteria used by different types of owners to decide which shares to hold are correlated with the measure of performance being used, then we could be falsely imputing a causal relationship between ownership and performance. Several reasons exist why ownership composition could differ across firms.
Some potential owners might believe that they have private information about the present or future performance of an operating company that is not fully reflected in the price of the company's stock, whether on the stock exchange or in the initial auction. This private
information would affect a potential shareholder's decision as to whether to buy shares in the company (either on the stock market or by using vouchers to bid for shares in the auction). We would expect that private information would be most important during the auction stage of the voucher privatization program, before shares were publicly traded or followed by analysts. The bids in the voucher auction started at government's assessment of the book value of the firm. The bidders were the investment funds as well as individuals. Under these conditions, the bidders with the most precise information about the present and future performance of firms would end up owning firms with the best present or future performance. In general, we would expect the investment funds to have been better informed than the general public (there were no other large institutions or wealthy investors participating in the auction). Therefore, the investment funds were likely to have been over represented among the initial owners of the better performing firms. Since initial ownership composition is highly correlated with ownership composition several years in the future, we would expect that any observed relationship between performance and ownership composition during our sample period would be biased by the relationship between initial ownership composition and performance. We can adjust for that bias by correcting for initial ownership shares in analyzing the performance of the firms.
The second reason for different ownership compositions across firms is that preferences differ among classes of investors. Some investors may prefer shares in large liquid companies. Others wish to become strategic investors and would favor purchases of shares in firms that complement the lines of business in companies they already control. To the extent that these
preferences are correlated with either performance of firms or changes in performance of firms, we may find that certain types of owners choose to invest in either high or low performing firms. (This effect is probably weaker than the effect of differences in information about performance since taste differences would not be expected to significantly affect the decisions of portfolio investors.)
The impact that owners have on the performance of different types of firms could vary across owner types. This could be another source of differences in ownership composition. If certain types of owners believe that they can positively affect the performance of low
productivity firms, then these types of owners will be associated with investments in low productivity firms. The stock market price of such firms will not reflect the productivity enhancing effect of the new owner. These owners will find it most profitable to buy shares in low productivity firms. Similarly, if a particular owner type is especially capable of slowing the decline in performance of firms whose productivity is falling, then owners of this type will find that their most profitable investments would be in firms with falling productivity.
On the other hand, certain owners may favor investments in firms from which they can most readily divert funds into their own pockets. For instance, developers may try to acquire controlling interests in banks to obtain cheap loans without putting up substantial collateral. Similarly, manufacturers may try to acquire controlling interests in a potential customer/buyer to get favorable prices for business. In the most extreme cases, a controlling position in a firm can be used to steal from the firm. In these cases, the owner may only be affecting the measured performance of the firm, and not the actual performance. The diverted funds are being distributed to the miscreants, causing reported profits to fall. However, this fall in reported profits will overstate the fall in economic profits.
No matter whether owners are improving the performance of firms in which they invest, or damaging this performance, it would be a mistake to assume that the same effects on
performance would occur if the owners invested elsewhere. These ownership effects are likely to be disproportionately stronger in firms in which a particular owner type has invested. Both performance enhancement and thievery tend to be greater in firms in which owners believe their rewards from attempting to improve performance, or from stealing assets are greatest.
The effects particular shareholders have on particular firms may be unique to these shareholder-firm combinations.
The sources of bias that are probably most important and can be most readily addressed, are differences in access to information about firms, and differences in the abilities of potential shareholders to process that information.
The dispersion of information is probably greatest at the first stages of the voucher privatization program, i.e., during the auctions. The impact of these biases, can be reduced by using firm specific dummy variables, or by including the initial ownership composition as an explanatory variable, or by taking first differences of ownership composition and performance. Using firm specific dummy variables would control for any time invariant firm effects that may be correlated ownership composition. Using initial ownership composition as an independent variable would control for that aspect of firm specific performance that is correlated with initial ownership composition. The latter approach has more degrees of freedom (the difference in the number of degrees of freedom is equal to the number of firms). However, it is vulnerable to model misspecification. Taking first differences, causes us to lose at least as many degrees of freedom as are lost using firm specific dummy variables.16 First differences is the appropriate approach if we believe that random shocks to performance follow a random walk; i.e. permanently affect performance. (Even if the effect of a random shock on performance dissipates, during short time periods it may be more effective to model these shocks as following a random walk than to assume that they are independent).
Unfortunately, using changes in ownership levels as an independent variable that represents changes in control creates new and potentially serious problems that must be
addressed before the model can be estimated. Changes in ownership levels may be independent of changes in control. For example, an owner who has attained control of a firm may decrease her ownership share in order to pay off debts incurred in attaining control. In general, an owner with majority control (whether her share is increasing or decreasing) is better able to change the firmÕs
16
If there were no missing observations taking first differences results in the same number of degrees of freedom as using a dummy variable for each firm. However, the first differences approach requires two consecutive years of ownership data for each observation, missing data resulted in us having fewer degrees of freedom with first differences than with fixed effects.
performance than is a minority owner whose share in the firm has increased.17 To limit the effects of these biases, we treated cases in which there was a majority owner separately when regressing changes in ownership on changes in performance. We also used initial ownership composition to remove the effects of initial differences in information across ownership groups. Although this technique enabled us to avoid the problems inherent in regressing changes in performance on changes in ownership, we had to specify a particular functional form for the relationship between ownership composition and firm specific effects on performance that may be correlated with ownership composition after the initial period. Unfortunately, we do not know the true functional form of that relationship, and thus additional sources of model misspecification are present.
Although it is possible to remove some sources of bias, it must be acknowledged that the remaining unexplained ownership differences are not necessarily exogenous. Thus, we need to have sources of variation in ownership composition that are not correlated with performance.
Various sources of bias that we mentioned above explain our modeling choices, and also can explain why our results may differ from those obtained in previous research.
The correlation between performance and ownership composition could be due either to differences in the information available to potential owners, or to differences in the preferences of owners. If the difference in private valuation is due to differences in information, these
information differences are likely to be greatest at initial stages of privatization.
Regardless of the measure of performance, there are three general approaches to measure the effects of ownership on performance: first, one can estimate the relationship between levels of performance and ownership composition; second, one can estimate the relationship between changes in performance and ownership composition; and finally, one can estimate the
relationship between changes in performance and changes in ownership composition. This last approach involves taking first differences of the first approach, as a means of eliminating biases arising from the correlation between ownership composition and the unobserved characteristics of firms.
17
In addition, changes in ownership shares may be due to differences in information concerning future improvements in performance. However any biases introduced by these sources of differential information are likely to be relatively minor compared with more important biases discussed in the text.
The first approach is the one that has been used in research previously. This approach may be useful for studying issues of corporate governance in economies in which ownership structure had been fixed for a long time, and in which initial relationships between purchases by different categories and initial performance had dissipated. However, this approach is not suitable for analyzing the Czech Republic in the early 1990s. Although ownership may have begun to affect performance immediately after privatization program had occurred, the effects of ownership on the level of performance were likely to be minor compared with the effects of ownership on changes in performance. At the same time, it is more likely that different types of owners would have chosen firms based on levels of performance, rather than based on predictions of changes in performance. These problems are avoided by taking first differences, which is our third approach in which
The second approach regresses changes in performance of firms as a function of ownership composition at the beginning of the period over which the changes were measured. This approach eliminates the bias stemming from the correlation between ownership composition and initial performance by only looking at changes in performance. Selectivity bias would still arise if some types of owners had better access to information about probable changes in performance, or if some types of owners were able to better evaluate information about future changes in performance, or if certain owners valued changes in future performance more than others did.18 Although this is a serious potential drawback to this study, we believe that bidders during this period were unlikely to have sufficient private information for this problem to
significantly bias our results.
Using changes in performance rather than levels of performance, as an independent variable also may improve the signal to noise ratio since ownership composition only affects the level of performance by changing performance. By focusing on changes in performance we can increase the weight placed on the effect of ownership on performance relative to selectivity bias
18
For example, suppose profits were distributed as dividends and there was perfect information about future profits. However, different types of owners have different time discount rates. If this was true, then we might find a
relationship between ownership composition and change in performance that was not due to the effects on ownership on performance, but rather to differences in preferences among types of owners for different streams of earnings. Similarly, if information about the future earnings of firms was distributed unevenly among potential shareholders, then ownership types who had access to better information about future earnings would own stocks whose measured performance increased the greatest. (This argument implicitly assumes that the necessary conditions for the efficient market hypothesis were not present in the Czech Republic.)
and noise. These benefits are greatest when changes in ownership are recent, and are, thus, having their sharpest effect on changes in performance. On the other hand, using levels of ownership to predict performance could introduce new biases into the data for firms in which ownership composition has been fairly stable. Even if ownership affects performance, once the performance enhancing (or debilitating) effects have occurred, there will not be any further relationship between the ownership composition and changes in performance, unless ownership composition changes. In general, for the later years of our sample, the coefficients on the effects of ownership on performance would be biased toward zero. The bias will be greatest for owners who have held their shares the longest, so that any effects from their ownership have already occurred. Regressing changes in performance on ownership composition also suffers from not being derived from an underlying relationship specifying the factors that affect performance.
Regressing changes in performance on changes in ownership composition addresses these problems while avoiding the most severe selection biases present if we regressed levels of
performance on levels of ownership composition.
However, using changes in ownership composition as an explanatory variable has its own difficulties. Since all the firms in our sample were privatized after 1993, it is conceivable that ownership in 1993 has a greater effect on the change in performance from 1995 to 1996, than does the change in ownership from year 1994 to 1995. A shareholder who increases his stake from 1% to 6% is likely to have far less control over the company in subsequent years than a shareholder who maintains a constant ownership of 51% of the shares, or even one whose ownership share decreased from 51% to 46% after having established control.
One of the reasons a shareholder may want to increase the proportion of shares she owns, would be to gain control of the company. Once a shareholder has gained control over a company she has less motivation to continue buying shares. She may even sell shares if outside threats are weakened after control has been established, and rivals for control have sold their shares creating more diffuse outside ownership. A controlling shareholder who is reducing her stake in the company is likely to have greater control over the company's performance than she had while accumulating shares in order to gain control. Large owners who are reducing their share holdings may be the owners with the greatest control. The reason they reduce their share holdings is that they no longer face threats to their control of the company. In addition, using first differences amplifies the effects of measurement error, and thus reduces the precision of the estimates. On
the other hand, using the change in ownership composition as an explanatory variables removes biases arising from the initial auction in which potential buyers bid for firms. It does not, however, eliminate all the biases that are present when levels of ownership shares are used as explanatory variables. In both cases purchase and sale decisions after the initial auction affect the explanatory variable, and those decisions are endogenous. They can be based either on private information about future changes in performance, or private information about the owner's ability to affect performance, or differences in preferences regarding changes in performance. Some types of owners may favor firms with good future prospects for productivity improvements, whereas other types may favor firms with poor future prospects.
Since ownership composition and changes in ownership composition have different benefits and drawbacks, we have used each as an explanatory variable in different regressions. Since each of the regressions is subject to different biases, none of the results should be viewed in isolation, but should rather be interpreted in the context of other results. We also made an attempt to adjust for the most serious drawbacks derived from using changes in composition as an explanatory variable, i.e. we treated firms with a majority owner separately.
In our analysis we used ownership data from 1993, 1994, 1995 and annual performance data from 1993, 1994, 1995, 1996. All data were purchased directly from Aspekt, a Czech publishing company. Aspekt obtained data from questionnaires mailed to firms. No ownership data existed for the Fund for National Property in 1993.
Description of Ownership Data. Restricted Pooled Data Set. Table 1
Number of Observations % of Total in the Pooled Data Set
The Largest Owner is a Fund (incl. Bank Funds and Holdings)
38 30.40%
Among them:
Holdings 6 4.80%
Bank Funds 19 15.20%
The Largest Owner
is not a Fund: 82 65.60% NPF and federal 28 22.40% Municipal 7 5.60% Domestic corp. 15 12.00% Foreign corp. 6 4.80% Investment company 16 12.80% Others 10 8.00%
Ownership is dispersed among
small owners (less than 5%) 5 4.00%
TOTAL 125 100.00%
The performance measures that we calculated from AspektÕs data are: 1. the change in value added per worker,
2. the change in value added per unit of capital, 3. the change in operating profit per worker, 4. the change in operating profit per unit of capital, 5. the change in the Solow residual.
Description of Performance Data Table 2
Change in
Years Mean Std. Dev. Min Max 1. Change in Value 93-94 33.20 151.19
-1244.01
777.67 Added per Worker 94-95 1.97 28.32 -244.97 356.72
95-96 -1.74 120.35 -1700.92 940.66 All Years 13.47 156.99 -1700.92 940.66 2. Change in Value 93-94 -0.41 3.24 -17.18 27.54 Added per Unit of 94-95 -0.03 1.07 -8.59 19.48
Capital 95-96 -1.02 16.93 -449.95 20.89 All Years -1.21 17.07 -449.95 27.54 3. Change in 93-94 -3.03 106.54 -332.25 704.02 Operating Profit 94-95 -1.96 29.06 -454.02 319.06 per Worker 95-96 -4.70 142.48 -1265.29 2977.4 2 All Years -7.87 160.09 -1265.29 2977.4 2 4.Change in Operating 93-94 -0.54 2.40 -8.38 21.49 Profit per Unit of 94-95 -0.07 0.58 -6.73 2.92
Capital 95-96 -0.42 4.21 -89.43 34.85
All Years -0.69 4.48 -89.43 34.85 5a. Change in Solow 93-94 0.15 0.68 -1.34 5.28 Residuals using 94-95 0.00 0.11 -1.16 0.87 OLS estimation 95-96 -0.02 0.25 -3.21 0.81 of production function All Years 0.04 0.52 -3.21 5.28 5b.Change in Solow 93-94 0.18 0.71 -1.32 5.37 Residuals using 94-95 0.00 0.11 -1.18 0.71 Robust estimation 95-96 -0.02 0.28 -3.25 0.90 of production function All Years 0.05 0.55 -3.25 5.37
In approaches 1-4, the numerator was intended to capture total producer surplus, whereas in the final approach, the Solow residual was used to measure the contribution of management expertise to firm performance. Thus for all the measures of performance, price effects are combined with output effects. Changes in value added, operating profits or the Solow residual could be due either to efficiency gains in production or to changes in the prices of goods sold or of inputs. We are implicitly assuming that the ownership structure is affecting the efficiency of production, rather than the prices of the goods produced or the cost of inputs. In this case, differences in price changes simply introduce noise into the measurement process. This
assumption seems reasonable in cases where control lies with financial firms. When control is in the hands of operating companies who are customers or suppliers of the firms in question, the prices of goods traded could be affected by non-economic considerations. (If the price changes refer to prices of exports, then these price changes may properly be included as efficiency gains for the Czech economy).
Each of these measures has specific drawbacks. Using either labor or capital in the denominator ignores the effect of the other factor. Hence, if the change in the measured performance was due to an increase in the other factor of production, our results would be seriously distorted. It is plausible that ownership structure affects the cost of capital so that changes in the capital-labor ratio could be associated with changes in the ownership structure. This would lead us to mistakenly infer that the ownership structure had affected performance when it had actually affected the capital-labor ratio.
This problem is less severe in our data than in other firm level data, because during this period there was little investment of new capital into existing Czech firms. We obtained rough estimates of the magnitude of this bias by measuring producer surplus (operating profits) per worker as well as per unit of capital. Thus, if changes in the capital/labor ratio were driving our results, we would find that the results would move in opposite directions depending on whether capital or labor was used in the denominator. In deciding whether to place greater weight on the results measured in terms of units of labor or units of capital, the most important considerations are which factor is scarce, and which factor is more accurately measured. If one of the factors is in excess supply, the other factor should be used for measures of performance. The value of capital reported by firms often bears little relationship to its market value, because the accounting values were frequently based on the value of physical materials used in production of it. Much of that physical capital has no market value. After the fall of communism investment in capital goods was low. Thus, capital that exists is imprecisely measured, and in many cases it is useless. Due to relatively uniform education levels, labor is probably more accurately measured than capital. In addition, low unemployment rates indicate that labor is in scarce supply. [See Table 1A of the Appendix for data on the distribution of education levels in the Czech Republic]. On the other hand, many Czech firms had (and probably still have) tremendous over staffing. Anecdotal evidence suggests that in some firms the marginal product of labor is close to zero, or even negative when we include social costs of employing a worker.
Returning to the choice of numerators in performance measures 1-4, we considered two different measures of producer surplus: value added and operating profits. If wages were equal to the opportunity cost of labor and if operating profits were correctly measured, then operating profits would be our best measure of producer surplus and thus should be used in the numerator. However, neither of these conditions holds. In many cases, workers have considerable influence or potential influence on the firm. Diffuse stockholder ownership and a Òstakeholder ethicÓ may cause managers to be more responsive to the interests of workers than to the interests of
shareholders. Consequently, wages may rise or fall with economic profits (producer surplus) generated by the firm. Moreover, in over staffed firms a fall in economic profits may cause a decline in employment. Hence, changes in the wage bill may reflect changes in economic profits. In addition, operating profits are extremely difficult to measure correctly. Many of the accounts receivable are past due and will probably never be collected. Yet firms often do not write-off these losses. For the transitional years used in this study, it is unrealistic to expect uniform or accurate accounting practices.
Our measure of capital was depreciation. This is a better measure than book value, because it avoids problems of including land holdings and other assets that do not enter into the production process as capital inputs. However, it does not avoid the problem that the imputed values of capital may bear little relationship to their market values.
The equations we estimated below were
(1) (VA/L)i,t+1- (VA/L)i,t = α(Si,t - Si,t-1) + βXi,t + γYt + ∈i,t;
(2) (π/L)i,t+1- (π/L)i,t = α(Si,t - Si,t-1) + βXi,t + γYt +∈i,t;
(3) (VA/K)i,t+1- (VA/K)i,t = α(Si,t - Si,t-1) + βXi,t + γYt +∈i,t;
(4) (π/K)i,t+1- (π/K)i,t = α(Si,t - Si,t-1) + βXi,t + γYt +∈i,t;
VA denotes value added, π denotes operating profits, L denotes the number of workers, K denotes capital depreciation;
Xt is a vector of other variables including 34 year-industry dummies (that take value of 1 or 0 for
each of the possible combinations of the industry and the period of change in performance, except for the "other" industry which is accounted for in the constant term C and a year dummy Yt for change in performance from 1995 to 1996 ).
The subscript i, t refers to firm i in year t.
These equations were derived in the following way.
We assume that performance of each company in period t depends on several variables: ownership composition of this company in period t-1, the period when the company operates, and the industry to which the company belongs.
Thus, we could estimate the following regressions:
Performance measure in period t = constant + αSi,t-1 + βXi,t + ∈i,t.
Here, performance measure is one of the four that we describe above; Si,t-1 is the
ownership composition in period t-1; and Xi,t is the vector of year-industry dummies for the
company (one element of this vector takes value of 1 for the particular year and industry combination, and the others are 0). For the regressions estimated in Table 3 we assume that ∈i,t
follows a random walk. Then, after taking the first differences for these equations, we get the equations that we estimated with all industries included as right hand variables and no constant term.
Our final approach (5) was to estimate changes in Solow residuals. Computing Solow residuals with data from the Czech Republic is problematic. When we estimated production functions by taking first differences at the firm level, we found that changes in labor were negatively correlated with changes in output. These spurious estimates of a negative marginal product of labor may arise, because the firms that failed to reduce their labor force are inefficient in other ways. For instance, their capital stock may be obsolete or their product mix may be inappropriate to the market economy, or they may be choosing economically inefficient
suppliers of other inputs. In general, the magnitude of staffing reductions may be correlated with managerial efficiency.
Instead of taking first differences to estimate production functions and changes in Solow residuals, we measured changes in Solow residuals by first estimating Cobb-Douglas production functions, computing the error term for each firm in each year, and then using the change in this
error term as a measure of the change in the Solow residual. This change in the Solow residual was used as a proxy for the change in firm productivity.
In particular, we estimated Solow residuals for each firm in an industry by using data from all firms in that industry to estimate an industry specific unconstrained Cobb-Douglas
production function, where value added was used as the measure of output. We did not allow for firm specific effects. We then calculated changes in the error terms for each firm from 1993 to 1994, 1994 to 1995, and 1995 to 1996. These differences were used as dependent variables to measure the effect of ownership composition on performance. Formally, we estimated the Solow residuals for each firm in each year as follows:
(5) lnVAi,t= Constant + alnKi,t + blnLi,t + υi,t;
Equation 5 was estimated separately for each of the 18 industries. From equation (1) we derived estimates of υi,t
We then estimated
υi,t+1 - υi,t = α(Si,t - Si,t-1) + βXit + γYt + ηi,t;
where Si,t denotes the ownership share of firm i in period t, X is a vector of industry - year
dummies, and Yt is the year dummy, and we assume that ηi,t is an i.i.d. error term. (We are
implicitly assuming that υi,t follows a random walk.)
Although in the context of the Czech Republic this formulation is an improvement over using first differences to compute Solow residuals, serious problems remain. For example, changes in accounting conventions could cause measured capital to decrease even if actual capital was unchanged. In this case, we would find spurious increases in Solow residuals for those firms that have high capital/labor ratios. If ownership composition is correlated with changes in the measurement error of factor inputs, or with changes in the use of mismeasured inputs (perhaps because different types of owners demand different accounting standards), then there may be spurious correlation between ownership composition and estimated changes in the efficiency of the firm's production.
To see how distortions may affect our results, consider the following scenario. Assume that particular types of investors are more likely to use inaccurate accounting values, rather than the economic value, of the capital stock when making decisions as to whether to shut down a division. Now, suppose the capital in a division of a firm is useless, i.e., it does not add value to
the production process of any firm (the economic obsolescence of capital could be due to changes in the demand for quality, stricter environmental regulations, and increases in energy costs, all problems which are especially severe in post-communist economies). Additionally suppose that the labor employed in that division is producing goods that are worth more than the opportunity cost of labor used in their production. Hence, the firm is using labor efficiently. If the firm were to shut down the division, then the firm specific error term in the industry production function would increase. However, economic efficiency would have fallen since labor would now be employed in less productive ways, and capital would not be employed in a better way - its productivity is zero everywhere.19 Owners who shut down divisions of this sort would appear to have been increased productive efficiency although they had actually decreased it.
Because of the difficulty in estimating production functions in an economy in which investment decisions had been made according to political rather than economic considerations, we do not have great confidence in estimates of changes in productive efficiency that are derived from residuals of a production function. As we discussed above, our best measure of the effect of ownership on performance comes from using robust estimates of the relationship between ownership composition and several different measures of changes in performance.20 None of the results by itself would be decisive, the hope is that together they will be informative.
The OLS results are reported to facilitate comparison between our results and those of other researchers who typically only report results derived from OLS estimation. The
popularity of OLS derives partly from its theoretical advantage given ÒidealÓ data. If errors are normal i.i.d., then OLS is more efficient than any other unbiased estimator. However, the
efficiency of OLS degrades quickly in the face of heavy-tailed (outlier-prone) error distributions,
19
Regardless of whether we had used value added, or operating profits, per unit of labor as our measure of performance, if the division in question was more productive than the rest of the firm, then according to either of these measures, productivity would fall from closing this economically efficient division This is the result we want. On the other hand, if we used producer surplus per unit of capital as our measure of productivity, then the results could have been even more seriously distorted than if we used the Solow residual approach. By using both labor and capital as denominators in approaches 1-4, we can bound the impact of these distortions.
20
The specific robust regression estimates we used were provided by STATA. They are generated by an iteratively reweighted least squares (IRLS) procedure. On each iteration, the econometric program estimates regression
parameters, calculates the residuals and downweights cases with large residuals. The process repeats until weights no longer show much change. It employs a combination of Huber and biweight functions. These are the standard robust estimation techniques and are particularly appropriate for our data in which we think measurement error is important. For data for which measurement error is not as serious a problem, there is less need to downweight or eliminate outliers. In this case, minimum absolute deviation might be a better approach to deal with model misspecification or absence of normality in the error terms.
such as those present in our data. Using a Jarque-Berra test we were able to reject normality of each of the dependent variables at confidence levels above one in a million. In figures 1 and 2 of the appendix, we plot dependent variables using value added as our measure of producer surplus. By inspection, it is obvious that these data are far from normal.
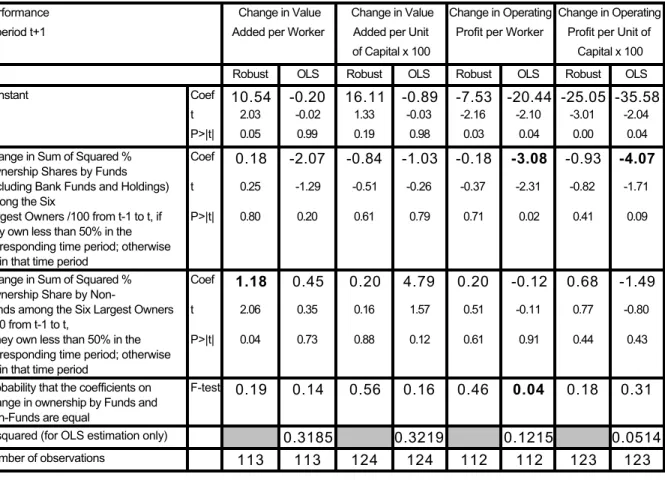
The terms in bold in the Table below denote coefficients statistically significant at the 10% level. Aspekt supplied ownership shares of the "largest shareholders", but never included more than six shareholders, and in most cases included fewer than six shareholders.
Consequently, we only use ownership shares among the six largest shareholders to measure ownership concentration. The two key independent variables in Table 3, for the purpose of this study, are the change in squared ownership shares by funds, and the change in squared ownership shares by non-funds, among the largest owners as reported by Aspekt. Other independent variables included 34 industry - year dummies, and a year dummy . In Table 3 we report results using changes in squared ownership shares as our measures of concentration. The
disproportionate weight given to the largest owners is intended to reflect their disproportionate influence on management. For example, we would expect one owner with 60% of the shares to have more effect on management than three owners with 20% of the shares each.
Although we present the results derived using both Robust and OLS regression
techniques, for the reasons discussed above, we would urge readers to pay more attention to the results derived from robust regression.
In Table 3 we used changes in the composition of ownership, rather than levels, as
dependent variables. The main advantage of using changes in ownership composition rather than levels is that we can eliminate selection bias caused by the initial matching of firms with owners. The disadvantage is that a fall in ownership composition could be associated with greater control by a shareholder who has reduced her stake, if the reduction in ownership share occurred after control have been secured. In these data we used changes in ownership from year t-1 to year t as independent variables for explaining changes in performance from year t to t+1. Because we did not have ownership data for 1992, we could not use changes in performance from 1993 to 1994 in our analysis. In addition, whenever we were measuring changes in performance from year t to t+1, we could only include firms for whom ownership data was available for years t and t-1. In previous regressions, we only needed ownership data for period t. For these reasons, the samples used in Table 3 differ from those used in the Tables in Appendix.
In our previous discussion of the suitability of using changes in ownership as an explanatory variable for changes in performance, we pointed out the paradoxes inherent if an owner had at least 50% control and then increased or decreased her share holdings while retaining control. In Table 3 we address this issue by separately estimating the effect of the change in ownership when in period t-1 there was an owner with than 50% of the shares. We focus on the effect of changes in squared ownership shares when no owner had 50% of the shares in period t-1.
Table 3
Change in Performance Change in Value Change in Value Change in Change in Operating
Change in from '94 to '95, Added per Worker Added per Unit Operating Profit per Unit of Residu and '95 to '96 of Capital x 100 Profit per Worker Capital x 100 x 100
Robust OLS Robust OLS Robust OLS Robust OLS Robust Constant Coef -22.24 -16.67 -79.64 -120.33 -17.53 -89.64
-53.46
-41.21 -9.80 -2 t -0.43 -0.12 -0.60 -0.34 -0.40 -0.87 -0.46 -0.22 -0.41 P>|t| 0.67 0.90 0.55 0.73 0.69 0.39 0.65 0.82 0.69 Change in Squared % Ownership Share by Coef -0.12 -4.05 -3.11 -3.80 -0.35 -4.57 -3.88 -4.08 -0.24 -Funds (including Bank -Funds and Holdings) t -0.15 -2.00 -1.69 -0.79 -0.63 -3.44 -2.42 -1.59 -0.78 among the Six Largest Owners /100, if none of the
owners owns more than 50%
P>|t| 0.88 0.05 0.10 0.44 0.53 0.00 0.02 0.11 0.44 Change in Squared % Ownership Share Coef 0.13 0.03 -0.08 6.34 -0.04 0.24 -0.04 -1.97 0.10 0 by Non-Funds among the Six Largest Owners /100, t 0.27 0.02 -0.07 2.07 -0.11 0.30 -0.04 -1.22 0.51 if none of the owners owns more than 50% P>|t| 0.79 0.98 0.95 0.04 0.91 0.76 0.97 0.23 0.61 Change in Squared % Ownership Share Coef -0.36 -0.58 0.19 0.68 0.19 0.05 0.25 -0.80 0.16 0 among the Six Largest Owners /100, t -0.50 -0.31 0.10 0.14 0.36 0.04 0.16 -0.32 0.57 if one of them owns more than 50% P>|t| 0.62 0.76 0.92 0.89 0.72 0.97 0.88 0.75 0.57 "p" value of an F test on the equality of the coefficients
on changes in ownership for funds versus non-funds when they own less than 50% of the company
F-test 0.95 0.14 0.24 0.08 0.82 0.00 0.06 0.16 0.62 0 R-squared (for OLS estimation only) 0.1919 0.1646 0.3450 0.1250 0. Number of observations 113 113 124 124 112 112 123 123 110
The results in Table 3 provide the strongest evidence that share ownership by funds fails to improve the performance of operating companies. In each of the regressions in Table 3, the coefficient on percentage change in squared ownership by fund, if it owns less than 50% of the shares, is negative. In 5 out of 10 regressions these coefficients are statistically significant at the 5% confidence level, and at less than the 2% level for a one sided test. These levels of statistical significance are surprising given the small sample sizes and the high levels of measurement error associated with first differences. In every regression the coefficients on changes in squared ownership by non-funds are larger than the coefficients for changes in squared ownership by funds, and in 4 of the regressions we can reject the hypothesis that the coefficients on changes in squared ownership by funds and non-funds are equal. Similar results were when changes in ownership shares, rather than changes in squared ownership, were used as explanatory variables, and dummies were used instead of the change in squared percentage change in ownership to control for the ownership in excess of 50 %.
When we used levels of ownership rather than changes in ownership as independent variables the results were weaker. Those results are presented in the appendix. There are several possible explanations for why there was a greater difference between the effects of ownership by funds versus non-funds on performance when changes in ownership, rather than levels of ownership, were used as an independent variable. First, funds may have had private
information about the future prospects of firms which enabled them to bid for firms in the auction whose performance would improve. This positive selection bias could have partially offset the deleterious effect of fund ownership on performance. An alternative explanation would be that increases in ownership shares by funds were more likely to have been the product of struggles for control. During these periods, managers of an operating company may have wanted to thwart a takeover by destroying value in ways that were more visible to potential raiders than to the average owner of the stock, so that the raidersÕ gains from a transfer of control would fall. An even more cynical interpretation is that once managers of an operating company realized they were likely to lose control of their company, they may have accelerated their self dealing since they had lost the future gains they would have derived from increasing the value of the company. This would cause reported profits to fall. Again, if increased
shareholdings by funds is associated with battles for control, it may also be associated with falls in performance.
Although there are several possible explanations for the results, the one explanation that fits all of the data is that control by entities other than investment funds has a positive effect on the performance of operating companies, whereas control by investment funds is less likely to help performance of operating companies and may hurt performance.
Conclusion
We find that the data from the Czech Republic is consistent with our economic intuition concerning the effect of ownership composition on economic performance. Ownership
concentration and the composition of ownership jointly affect the performance of operating companies.
Concentration of ownership in the hands of large shareholders other than investment funds and investment companies is associated with increases in performance. This result held for all our measures of performance. These shareholders would typically have strong financial incentives to
improve the performance of the operating companies in which they have invested. To the extent that these shareholders have large positions in operating companies, they can use their ownership power to exert control and thus, improve the performance of the operating companies.
We could not find any evidence that concentrated ownership share by funds improves the performance of operating companies. This negative result holds both for bank managed funds and funds that are not managed by the subsidiaries of banks.
We conjecture that conversion of the closed-end funds into open-end funds would improve the performance of operating companies. This will occur because managers of open-end funds have more incentive to improve the performance of the companies in which they invest, ineffective managers of open-end funds will lose assets. Besides that, the sale of shares in operating companies due to redemptions from poorly managed closed-end funds will make it easier for outside investors to accumulate controlling positions in operating companies in which they believe they can improve performance.
The 1998 Amendment to the Investment Funds Act allows closed-end funds to convert to open-end status, and mandates that all funds be converted to open-end status by 2002. Thus, we will have a real world experiment against which to measure our results.
APPENDIX Figure 1. -2,000 -1,000 0 1,000 0 20 40 60 80 100
Percentage Ownership by the Six Largest Owners
Change in Value Added per Worker
THESE CHARTS WILL BE ATTACHED LATER Figure 2. -500 -400 -300 -200 -100 0 100 0 20 40 60 80 100
Percentage Ownership by the Six Largest Owners
Change in Value Added per Unit of
Table 1A.
Employment in Czech Republic by education level, in percentages
Sector No Formal Education Grammar School Trade/High School University Companies in sample Share of sample Agriculture 0.1 18.7 76.7 4.5 40 5.3 Mining 0.0 12.3 82.9 4.9 15 2.0 Manufacturing 0.0 13.4 80.7 5.9 401 53.1 Utilities 0.0 8.1 84.4 7.5 53 7.0 Construction 0.0 8.0 86.5 5.4 70 9.3 Trade and Services 0.0 8.1 86.2 5.7 126 16.7 Transportation 0.0 9.9 85.5 4.6 30 4.0 Other/unknown . . . . 20 2.6 Total 0.0 11.2 83.3 5.5 755 100.0
Source: Czech Statistics Office and authors' calculations
Table 2A.
Description of Ownership Data. Unrestricted Pooled Data Set.
Number of Observations % of Total in the Pooled Data set
The Largest Owner is a Fund
(incl. Bank Funds and Holdings) 361 47.81%
Among them:
Industrial holding companies21 22 2.91%
Bank managed funds 108 14.30%
The Largest Owner
is not a Fund: 303 40.13% FNP and federal 109 14.44% Municipal 18 2.38% Domestic corp. 94 12.45% Foreign corp. 32 4.24% Investment company22 36 4.77% Others 14 1.85%
Diffuse ownership: No owner is listed among six largest owners
91 12.05% TOTAL 755 100.00% 21
Industrial holding companies typically started as closed-end funds, and then changed their charter to avoid restrictions placed on the behavior and fees of fund managers. They also lost the favorable tax status given to funds. For our purposes, there is no substantial difference between industrial holding companies and closed-end funds.
22