S
TUDY AND IMPLEMENTATION OF
M
ACHINE
L
EARNING
ALGORITHMS OPTIMIZED FOR DISTRIBUTED MULTIDIMENSIONAL
INDEXING DATABASES
TREBALL FINAL DE GRAU
March 20th, 2019
Student
- Adrià Correas Grifoll
Director
- Cesare Cugnasco, PhD
Tutor
- Yolanda Becerra, PhD
Facultat d’Informàtica de Barcelona
Trabajo realizado para elTFG
Departament d’Arquitectura de Computadors Facultat d’Informàtica de Barcelona Universitat Politècnica de Catalunya
Abstract
This project proposes optimizations for Machine Learning algorithms that benefit from distributed multidi-mensional indexing databases. Clustering algorithms, such as K-means, require a large amount of computa-tional resources, and as the number of points and dimensions increase, poor scalability of the algorithms as well as the loading of large files from the disk can induce into very large execution times. A thorough analysis to study K-means scalability demonstrates poor scalability of the algorithm.
A couple of optimization implementations are presented to take advantage of the Qbeast indexing tech-nology, which allows the use of multidimensional indexing in databases to query percentages of data over time.
It can be used to perform executions with small but representative amounts of data and improve the initialization of the algorithm. Tests have been conducted with different approaches with respect to the percentages of data consulted. Also, a performance comparison of these optimizations is shown with the standard K-means.
The tests showed that our optimizations present promising improvements compared to the standard approaches of data loading for K-means. In this way we aim high in that the work done in this project will improve and revolutionize in the near future the way in which the modern market focuses on the use of Machine Learning algorithms.
Resum
Aquest projecte proposa optimitzacions per als algorismes de Machine Learning que es beneficien de les bases de dades d’indexació multidimensionals distribuïdes. Els algorismes de clustering, com K-means, requereixen una gran quantitat de recursos computacionals, i a mesura que la quantitat de punts i dimensions augmenten, una mala escalabilitat dels algorismes a més de la lectura d’arxius grans des del disc poden induir a temps de execució molt grans. Una anàlisi exhaustiu per estudiar l’escalabilitat de K-means demostra una mala escalabilitat de l’algorisme.
Es presenten un parell d’implementacions d’optimització per aprofitar la tecnologia d’indexació Qbeast, que permet usar la indexació multidimensional en bases de dades per consultar percentatges de dades al llarg del temps.
Es pot usar per a realitzar execucions amb quantitats petites però representatives de dades i millorar la inicialització de l’algorisme. S’han realitzat proves amb diferents enfocaments pel que fa als percentatges de dades consultades. També, es mostra una comparació de rendiment d’aquestes optimitzacions amb el K-means estàndard.
Les proves van demostrar que les nostres optimitzacions presenten millores prometedores en comparació amb els enfocaments estàndard de lectura de dades per a K-means. D’aquesta manera apuntem alt en que el treball fet en aquest projecte millorarà i revolucionarà en un futur proper la manera en que el mercat modern enfoca l’ús dels algorismes de Machine Learning.
Resumen
Este proyecto propone optimizaciones para los algoritmos de Machine Learning que se benefician de las bases de datos de indexación multidimensionales distribuidas. Los algoritmos de clustering, como K-means, requieren una gran cantidad de recursos computacionales, y a medida que la cantidad de puntos y dimensiones aumentan, una mala escalabilidad de los algoritmos además de la lectura de archivos grandes desde el disco pueden inducir a tiempos de ejecución muy grandes. Un análisis exhaustivo para estudiar la escalabilidad de K-means demuestra una mala escalabilidad del algoritmo.
Se presentan un par de implementaciones de optimización para aprovechar la tecnología de indexación Qbeast, que permite usar la indexación multidimensional en bases de datos para consultar porcentajes de datos a lo largo del tiempo.
Se puede usar para realizar ejecuciones con cantidades pequeñas pero representativas de datos y mejorar la inicialización del algoritmo. Se han realizado pruebas con diferentes enfoques con respecto a los porcentajes de datos consultados. También, se muestra una comparación de rendimiento de estas optimizaciones con el K-means estándar.
Las pruebas demostraron que nuestras optimizaciones presentan mejoras prometedoras en comparación con los enfoques estándar de lectura de datos para K-means. De esta manera apuntamos alto en que el trabajo hecho en este proyecto mejorará y revolucionará en un futuro próximo la manera en que el mercado moderno enfoca el uso de los algoritmos de Machine Learning.
Index
1 Introduction 4
1.1 Goal and problem formulation . . . 5
1.2 Background . . . 5
1.2.1 MapReduce . . . 5
1.2.2 Apache Cassandra . . . 5
1.2.3 Apache Spark . . . 6
1.2.4 Spark SQL and MLlib. . . 6
1.2.5 Clustering classification . . . 7
1.2.6 Qbeast . . . 9
1.3 State of the art . . . 11
1.3.1 K-means++ . . . 11 1.3.2 Scalable DBSCAN. . . 11 1.4 Scope . . . 13 1.5 Stakeholders . . . 13 1.6 Methodology. . . 13 1.7 Validation methods. . . 14
1.8 Possible obstacles and solutions . . . 14
2 Project planning 15 2.1 Task description. . . 15
2.1.1 Background in distributed computing. . . 15
2.1.2 Background in NoSQL databases. . . 16
2.1.3 Background in clustering algorithms . . . 16
2.1.4 Analyze and implement possible optimizations . . . 16
2.1.5 Setup benchmark environment . . . 17
2.1.6 Perform the experiments . . . 18
2.2 Estimated time . . . 18
2.3 Gantt chart. . . 19
2.4 Alternatives and action plan. . . 20
2.5 Plan Deviations . . . 20
2.5.1 Goal and contextualization . . . 20
INDEX INDEX
2.5.3 Methodology . . . 22
2.5.4 Analysis and alternatives . . . 22
2.5.5 Laws and regulations identification . . . 22
2.6 Budget and sustainability . . . 22
2.6.1 Sustainability self-assessment . . . 22
2.6.2 Project budget. . . 23
2.6.2.1 Human resources budget . . . 23
2.6.2.2 Hardware budget. . . 24 2.6.2.3 Software budget . . . 24 2.6.2.4 Risk costs . . . 25 2.6.2.5 Indirect costs . . . 25 2.6.2.6 Total budget. . . 25 2.6.3 Budget control . . . 26 2.6.4 Sustainability report . . . 26 2.6.4.1 Environmental dimension . . . 26 2.6.4.2 Economical dimension . . . 27 2.6.4.3 Social dimension . . . 27
3 Selected optimizations implementation 28 3.1 Optimizations . . . 28
3.1.1 Bi-phase . . . 28
3.1.2 Multi-phases . . . 31
4 Testing 35 4.1 Validation of the algorithms. . . 35
4.2 Environment Spark analysis. . . 37
4.2.1 Scalability in Spark . . . 37
4.2.2 Scalability of the algorithms. . . 38
4.2.3 Spark K-means implementation . . . 39
4.2.4 Apache Spark tuning . . . 40
4.2.4.1 Tuning Resource Allocation. . . 41
4.2.4.2 Tuning Parallelism . . . 42
4.2.5 K-means performance metrics . . . 43
4.3 Benchmark test results. . . 47
4.3.1 Input data . . . 47
4.3.2 Queries . . . 47
4.3.3 Environment specification . . . 48
4.3.4 Metrics specification . . . 48
4.3.5 K-means scalability tests . . . 48
4.3.5.1 Hard scalability . . . 48
4.3.5.2 Weak scalability . . . 52
4.3.6 Optimization tests . . . 53
INDEX INDEX
4.3.6.2 Multi-phases tests . . . 56
4.3.7 Comparison between algorithms. . . 59
4.3.8 Efficient data sampling . . . 60
4.3.8.1 From Qbeast indexing to data storage. . . 63
5 Conclusions 64 5.1 Future work . . . 65 5.1.1 DBSCAN . . . 65 5.1.2 Resource re-allocation . . . 65 5.1.3 Dynamic-phases optimization . . . 65 5.1.4 Asynchronous K-means . . . 66
Chapter 1
Introduction
Modern data sets are rapidly growing in size and complexity, and there is a pressing need to develop solutions to harness this wealth of data using statistical methods. Several ‘next generation’ data flow engines that generalize MapReduce [17] have been developed for large-scale data processing, and building machine learning functionality on these engines is a problem of great interest.
Clustering is a Machine Learning technique that involves the grouping of data points. Given a set of data points, we can use a clustering algorithm to classify each data point into a specific group. In theory, data points that are in the same group should have similar properties and/or features, while data points in different groups should have highly dissimilar properties and/or features. Take for an instance, people being diagnosed have some common symptoms and are placed in a group tagged with some label representing the disease that they suffer. Clustering is a method of unsupervised learning [13], which is able to infer patterns from a data set without reference to known or labeled outcomes, and it is a common technique for statistical data analysis used in many fields. Nowadays handling petabytes of data can be a huge overhead in many modern applications, clustering algorithms require large quantities of data and hence its computation is expensive. Clustering algorithms have been around for a long time, with continuous optimizations and different kind of approaches over the years looking to improve the state of the art according to the current needs. The Big Data era made these algorithms even more relevant with the inevitable need to classify data for daily use cases such as brain tumor detection [29], document clustering [37], face recognition [41], etc.
One of the key challenges regarding large quantities of data is the way they are handled in terms of compu-tation of the data, the compucompu-tational cost of an algorithm often makes many applications unfeasible or too expensive. A lot of times data can be represented as points in a N-Dimensional space, being the similarity between points strongly connected with proximity in the space. Having the ability to run efficient data-thinning queries, enabling the user to tackle massive data sets by analyzing smaller, but statistically relevant subsets could be a huge opportunity for a lot of modern informatic applications. In this project a new approach to handle the data in order to reduce I/O operation requirements and speed up run-time will be studied and tested for clustering algorithms.
1.1. GOAL AND PROBLEM FORMULATION CHAPTER 1. INTRODUCTION
1.1
G
OAL AND PROBLEM FORMUL ATION
The objective of this project is to study different machine learning algorithms for clustering data, such as K-means and DBSCAN aiming to implement optimizations to achieve better handling of the data, focusing on the approach in which data is organized and comparing it against current state of the art implementations. Latency is a huge concern when managing a lot of data, storage system’s I/O requirements for high amounts of data are too slow and can become a bottleneck. Precisely, we will try to improve the current scalable implementations of the clustering algorithms K-means|| [11] and DBSCAN on Spark. The optimizations that we will initially center on are:Pre-samplingof the data to improve run-time, use ofregionqueries to avoid unneeded computation of data,increasing dataover the iterations of the algorithm to avoid computation cost and improve run-time, and
oversamplingdata. Optimizations will be selected and explained more extensively later on.
The QUAKE project at BSC is developing a prototype taking advantage of the patent pending new indexing technology Qbeast, that allows to index million of data points in a N-dimensional space efficiently and supports data analytics, machine learning and clustering tests. The focus of this work is to explore how Multidimen-sional indexing with efficient sampling (MIS) can improve Machine Learning algorithms and study which functionalities add to Qbeast to support it.
1.2
B
ACKGROUND
In this section, the basic concepts and paradigms that are needed in order to understand this project are described.
1.2.1 MapReduce
MapReduce is a programming model and an associated implementation for processing and generating large data sets. Users specify a map function that processes a key/value pair to generate a set of intermediate key/value pairs, and a reduce function that merges all intermediate values associated with the same intermediate key [17]. Many other models have been implemented based on this model, like Apache Spark explained later on.
Programs written in this functional style are automatically parallelized and executed on a large cluster of commodity machines. The run-time system takes care of the details of partitioning the input data, scheduling the program’s execution across a set of machines, handling machine failures, and managing the required inter-machine communication. This allows programmers without any experience with parallel and distributed system to easily utilize the resources of a large distributed system.
1.2.2 Apache Cassandra
Apache Cassandra is a distributed storage system for managing very large amounts of structured data spread out across many commodity servers [27], while providing highly available service with no single point of failure.
1.2. BACKGROUND CHAPTER 1. INTRODUCTION
Cassandra aims to run on top of an infrastructure of hundreds of nodes (possibly spread across different data centers). At this scale, small and large components fail continuously. The way Cassandra manages the persistent state in the face of these failures drives the reliability and scalability of the software systems relying on this service. While in many ways Cassandra resembles a database and shares many design and implementation strategies therewith, Cassandra does not support a full relational data model; instead, it provides clients with a simple data model that supports dynamic control over data layout and format. Cassandra system was designed to run on cheap commodity hardware and handle high write throughput while not sacrificing data read efficiency.
1.2.3 Apache Spark
Apache Spark is an open-source cluster computing framework for big data processing [34]. It has emerged as the next generation big data processing engine, overtaking Hadoop MapReduce which helped ignite the big data revolution. Spark maintains MapReduce’s linear scalability and fault tolerance, but extends it in a few important ways: it is much faster (100 times faster for certain applications), much easier to program in due to its rich APIs in Python, Java, Scala (and shortly R), and its core data abstraction, the distributed data frame, and it goes far beyond batch applications to support a variety of compute-intensive tasks, including interactive queries, streaming, machine learning, and graph processing.
1.2.4 Spark SQL and MLlib
Spark SQL is a module in Apache Spark that integrates relational processing with Spark’s functional programming API [9]. Spark SQL lets Spark programmers leverage the benefits of relational processing (e.g., declarative queries and optimized storage), and lets SQL users call complex analytics libraries in Spark (e.g., machine learning). With the addition of a DataFrame API that integrates with procedural Spark code and a highly extensible optimizer, Catalyst, Spark SQL offers richer APIs and optimizations for complex need of modern data analysis while keeping the benefits of the Spark programming model.
Apache Spark is well-suited for iterative machine learning tasks. MLlib [31] provides efficient functionality for a wide range of learning settings and includes several underlying statistical. optimization, and linear algebra primitives. This platform has emerged as a widely used open-source engine. Spark is a fault-tolerant and general-purpose cluster computing system providing APIs in Java, Scala, Python, and R, along with an optimized engine that supports general execution graphs. Moreover, Spark is efficient at iterative computations and is thus well-suited for the development of large-scale machine learning applications. MLlib, Spark’s distributed machine learning library, targets large-scale learning settings that benefit from data-parallelism or model-parallelism to store and operate on data or models. MLlib consists of fast and scalable implementations of standard learning algorithms for common learning settings including classification, regression, collaborative filtering, clustering, and dimensionality reduction. It also provides a variety of underlying statistics, linear algebra, and optimization primitives. The following list is compounded by the core features of MLib:
1.2. BACKGROUND CHAPTER 1. INTRODUCTION
algorithms.
• Algorithmic Optimizations: MLlib includes many optimizations to support efficient distributed learning and prediction.
• Pipeline API: Practical machine learning pipelines often involve a sequence of data preprocessing, feature extraction,model fitting and validation stages.
• Spark Integration: MLlib benefits from the various components within the Spark ecosystem.
• Documentation, Community, and Dependencies: The MLlib user guide provides extensive documenta-tion; it describes all supported methods and utilities. It also includes several code examples along with API docs for all supported languages.
1.2.5 Clustering classification
Grouping of objects is required for various purposes in different areas of engineering, science and technology, humanities, medical science and our daily life. Take for an instance, people being diagnosed have some common symptoms and are placed in a group tagged with some label representing the disease that they suffer. The people not possessing those symptoms will not be placed in that group, and the patients grouped for that disease will be treated accordingly while patients not belonging to that group should be handled differently. Whenever we find a labeled object, we will place it into the group with the same label. However, on many occasions, no such labelling information is provided in advance and we group objects on the basis of some similarity. In generic terms, these cases are dealt under the scope of classification [18]. Precisely, the first case when the class (label) of an object is given in advance is termed as supervised classification whereas the other case when the class label is not tagged to an object in advance is termed as unsupervised classification. The main purpose behind the study of classification is to develop a tool or an algorithm, which can be used to predict the class of an unknown object, which is not labeled. This case differs from supervised classification in the manner that there is no label assigned to any pattern.
Clustering is a very essential component of various data analysis or machine learning based applications, like regression, prediction, data mining [24], etc. According to Rokach [30] clustering divides data patterns into subsets in such a way that similar patterns are clustered together. There are different clustering techniques, that have been proposed in different approaches throughout the years. Fraley and Raftery [20] suggested dividing the clustering approaches into two different groups: hierarchical and partitioning techniques. Han et al. [24] suggested the following three additional categories for applying clustering techniques: density-based, model-based and grid-based methods. In this project we focus on partitional clustering techniques, that include distance-based approaches (K-means) and density-based approaches (DBSCAN).
- K-means algorithm
The K-means clustering problem is one of the oldest and most important questions in all of computational geometry. Given an integerkand a set ofndata points, the goal is to choosekcenters so as to minimize the total squared distance between each point and its closest center.
1.2. BACKGROUND CHAPTER 1. INTRODUCTION
K-means is a popular algorithm for clustering analysis in data mining. It aims to partition n observations into k clusters in which each observation belongs to the cluster with the nearest mean, serving as a prototype of the cluster [39].
The K-means algorithm is a simple and fast algorithm for this problem, although it offers no approximation guarantees at all. The standard steps of K-means algorithm are:
1. Arbitrarily choose an initialkcentersC = {c1, c2, · · · , ck}.
2. For eachi∈{1, . . . , k}, set the clusterCito be the set of points inXthat are closer toci than they are tocj
for allj6=i.
3. For eachi∈{1, . . . , k}, setcito be the center of mass of all points inCi:ci=
1 |Ci|
P
x∈Cix. 4. Repeat Steps 2 and 3 until C no longer changes
It is a standard practice to choose the initial centers uniformly at random from X. Although other approaches are currently used in the state of the art implementations that improve the cost of the algorithm.
- DBSCAN algorithm
DBSCAN is a clustering algorithm proposed by Ester et al. [19]. And it has become one of the most common clustering algorithms because it is capable of discovering arbitrary shaped clusters and eliminating noise data. The basic idea of this algorithm is finding all the core points and forming the clusters by clustering core points with all points (core or non-core) that are reachable from them. DBSCAN algorithm is based on three basic definitions: core points, directly density-reachable, and density-reachable [42]. Given a data set D, of points:
• Eps-neighborhood of a point p is the neighborhood of p∈D within a radius eps.
• Definition 1: A point p is a core point if it has neighbors within a given radius (eps), and the number of neighbors is at least minpts (which is a threshold). In this case, the number of neighbors is called density. • Definition 2: A point y is directly density-reachable from x if y is within eps-neighborhood of x and x is a
core point.
• Definition 3: A point y is density-reachable from x if there is a chain of pointsp1,p2, . . . ,pn, withp1=
x,pn=yandpi+1 is directly density-reachable frompi for all 1 <= i < n,pi∈D.
The algorithm starts with an arbitrary point p in D and checks its eps-neighborhood. If the eps-neighborhood size is bigger than pre-defined number minpts, the code generates a new cluster C. It then retrieves all density reachable points from p in D, and adds them to the cluster C. Otherwise, if the eps-neighborhood contains less than minpts points, then p is marked as noise. The computational complexity of the algorithm is O(n2) where n is the number of data points. If spatial indexing [14] were to be used, the complexity would be reduced to O(n∗l og(n)).
1.2. BACKGROUND CHAPTER 1. INTRODUCTION
1.2.6 Qbeast
Qbeast technology has been developed at BSC-CNS, this technology combines Multidimensional Indexing with efficient data Sampling (MIS) that allows to improve the approach in which scientific data is analyzed.
It provides a novel indexing algorithm, designed to be implemented on top of modern distributed key-value databases, like Cassandra. Its design employs de-normalization techniques to increase the scalability and the parallelism of multidimensional queries. It also allows to run efficient data-thinning queries, enabling the user to tackle massive data sets by analyzing smaller, but statistically relevant, subsets.
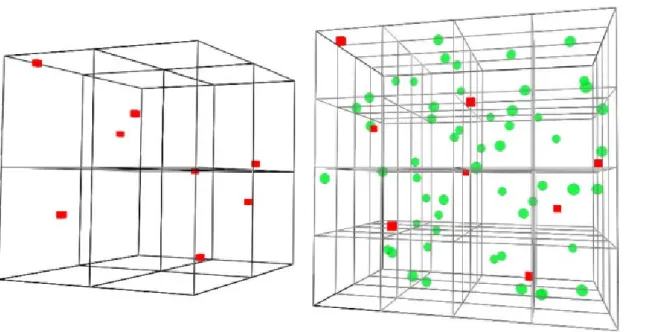
The classical indexing algorithms, such as R-trees[22], were designed to take advantage of the hardware’s characteristics at the time. At the time of its design the seek latency of the hard disks was the biggest per-formance bottleneck, RAM was extremely expensive, and databases ran on monolithic single core machines. The architecture of the computers has changed dramatically since then. The CPU’s clock frequency growth has stopped, giving the way to new architectures built on multiple cores. Modern CPUs have also adopted a Non-Uniform Memory Access (NUMA) design, which distinguishes between the local and the remote RAM, opening new possibilities for performance improvement when applications embrace share-nothing parallelism. The structure that Qbeast used in a previous version of the framework is called D8-tree[15], refered as Denormalized Octa-tree. The characteristic of the D8-tree is to replicate the elements with higher priority on the top levels of the tree so that the data contained within each level is also stored in the lower ones. Figure1.1 shows a representation of the first and second levels of a D8-tree where each node can accommodate maximum one element. It is possible to see how the elements available at the first level, the red cubes, are also accessible at the second level of the tree. Figure1.2shows the structure of an Octa-tree where denser zones are more partitioned thus making data thinning more complex.
1.2. BACKGROUND CHAPTER 1. INTRODUCTION
Figure 1.1:The first(left) and second level(right) of a D8-tree
Indeed, if we want to sample one point from the top-left quadrant, the one with the green pyramids and blue spheres, we should access each of the 15 partitions reading all the elements and then randomly select the one we need in memory. With the D8-tree, instead, we would need to read just one point from the first level of the tree as long as it is already a random sample of the underlying space area.
Figure 1.2:Octa-tree structure
A second implementation called AOTree (Asymptotic Outlook Tree), which is the one currently used, puts its weight in how to write data, apart from maintaining the read optimization that its ancestor has. This reduces
1.3. STATE OF THE ART CHAPTER 1. INTRODUCTION
the requirements of space in the disk without compromising read times.
The idea of a "max-height" global for the index is replaced for a maximum capacity in each cube. Then, the cube will only replicate the data needed to perform a regular jump.
This technology can be harnessed into many applications. On one side, scientific simulations generate complex data sets where multiple characteristics describe each item. For instance, a particle might have a space position (x, y, z) at a given time (t). If we want to find all elements within the same area and period, we either have to scan the whole data set, or we must organize the data so that all items in the same space and time are stored together, which is very complex. Using Multidimensional Indexing (MI) to cluster and to organize similar data together solves this issue. On the other side, we can relax the precision of the results to speed up analytical workloads within a specific interval of confidence.
Now focusing on clustering algorithms, these kind of algorithms usually require to load and compute a very high amount of data, the access to disk can be slow and become a significant bottleneck. Being able to load a percentage of the data very fast and start the algorithm with a sample of the whole data can be very positive for these algorithms. Instead of waiting for the whole data to be loaded before starting computation of the algorithm it could be possible to start iterations and load data "on the go".
1.3
S
TATE OF THE ART
In this section, a revision of two key machine learning clustering algorithms state of the art implementations is presented.
1.3.1 K-means++
The idea of K-means algorithm goes back to Hugo Steinhaus in 1957 [39], since then a lot of implementations have been proposed to improve the quality and run-time of the algorithm. Big Data has been a hot topic for several years and as technology evolves new ideas and optimizations try to improve the state of the art.
MLlib from Apache Spark has a current implementation of K-means [10], that improves the initialization process using an optimization that outperforms the standard random initialization. MLlib also provides a scalable version of the algorithm K-means++, called K-means|| [11] that allows to run the algorithm in parallel to increase the speed of the algorithm. Moreover, MLlib includes a Streaming K-means and Bisecting K-means [37] variant.
1.3.2 Scalable DBSCAN
Unlike K-means, DBSCAN is not currently supported in Apache Spark, as there isn’t an implementation in MLlib. Though, there are some public unofficial implementations on top of Apache Spark trying to take advantage of the framework, unfortunately benchmarks show unpromising results. Han et al. [23] defines how an efficient
1.3. STATE OF THE ART CHAPTER 1. INTRODUCTION
DBSCAN algorithm on top of Apache Spark could be implemented, but its implementation is not public. ELKI [33] is an open-source library for data analysis that includes an implementation of DBSCAN (as well as K-means), although it can only be executed in a single node because it doesn’t support parallel execution, it is widely known and used for current data analysis projects, (in some cases even outperforming parallel executions on top of Apache Spark). There are a lot of variants of DBSCAN, such as OPTICS that successfully solves some of the issues of the algorithm, the focus in the project consists in how to handle the data so that the algorithm can take advantage of that, for this reason we will ignore some improvements and optimizations of the algorithm that focus on improving the core drawbacks of DBSCAN. Moreover, HPDBSCAN is a parallel implementation of DBSCAN using OpenMP and openmpi to parallelize the algorithm and it is proved to scale very well when set up correctly in a cluster. The following tables show benchmarks [32] from different implementations of DBSCAN:
Data points HDF5 size CSV size SSV with Ids
Twitter Small 3.704.351 57 MB 67 MB 88 MB
Twitter Big 16.602.137 254 MB 289 MB 390 MB
Implementation Repository Version date
HPDBSCAN bitbucket.org/markus.goetz/hpdbscan 10/09/2015 Spark DBSCAN github.com/alitouka/spark_dbscan 22/02/2015 RDD DBSCAN github.com/irvingc/dbscan-on-spark 14/06/2016 DBSCAN on Spark github.com/mraad/dbscan-spark 30/01/2016
Number of cores 1 2 4 8 16 32 HPDBSCAN MPI 114 59 30 16 8 6 PDSDBSCAN MPI 288 162 106 90 85 88 ELKI 997 - - - - -RDD-DBSCAN 7311 3521 1994 1219 889 832 DBSCAN on Spark 1105 574 330 174 150 147
Table 1.1:Run-times in seconds of the different implementations
The previous table1.1shows run-time measurements on Small data set, using a few number of cores. HPDBSCAN (C++ implementation) on MPI only mode performs best in all cases and scales well. Second in terms of run-time is C++ PDSDBSCAN (MPI variant), however, the scalability beyond 8 cores is already limited. Even the Java ELKI which is optimised for a serial execution is much slower than the C++ implementations. The implementations for Spark are even slower (for all of them, 912 initial input partitions were used). When running on many cores, the Spark implementations beat ELKI but they are still by one (DBSCAN on Spark) or two (RDD-DBSCAN) magnitudes slower than HPDBSCAN and do not scale as well. Further analysis and benchmarks are tested thouroughly in [32].
1.4. SCOPE CHAPTER 1. INTRODUCTION
1.4
S
COPE
The first task is to make a large search of different clustering algorithms to understand them and analyze if we can take advantage of our approach of handling the data to optimize them.
Our focus will be to analyze what features can be included in Qbeast to improve ML algorithms.
After a precise analysis of the implementations of the algorithms and tests a decision will be made upon selecting which algorithms are chosen for a thorough study and possible optimizations. Then, we will validate the veracity of the solution of our optimizations.
Finally, we will benchmark the algorithms, including strong scaling and weak scaling tests. For that we will need to set up a fair Spark cluster environment at Marenostrum4.
1.5
S
TAKEHOLDERS
• Developer: This is the person in charge of research, document, benchmark and implement all the required tasks. In addition, he is responsible for the project management and the writing of the report and all the required documentation. This actor works as agreed with the director and he is, ultimately, the person in charge to accomplish the deadlines.
• Director: The director is the main responsible for guiding, giving advice and, in general, helping the developer. His action is key to determine possible errors in the project, both in its proposal and execution. In particular, Cesare Cugnasco, Research Engineer at BSC-CNS, has acted as director.
• Beneficiaries: Many businesses are interested in big data applications since we still lack on efficiency in terms of understanding tons of data and the ability to extract valuable information from it. Optimizing clustering algorithms would help creating better applications for real modern big data challenges and hence, would benefit both users and enterprises. In particular, at BSC-CNS some projects will be directly benefited: the european project IBiDaaS, QUAKE project for data analytics and collaborations with other companies like LaCaixa, FCA, Telefonica, etc.
1.6
M
ETHODOLOGY
A set of benchmarks for current state of the art implementations will be made in Minerva cluster(DAC), Marenos-trum(BSC) and AWS from Amazon, to have in comparaison for our future tests. Official datasets for benchmark-ing will be used [32].
Our implementations will be built with Scala on top of Apache Spark framework, and the data will be indexed in Cassandra using Qbeast technology for indexing. The algorithm will query the data from Cassandra using a cassandra connector for Apache Spark. The optimizations will be centered in taking advantage of the methodology in which Qbeast indexes data, when space is partitioned for scalable versions of clustering
1.7. VALIDATION METHODS CHAPTER 1. INTRODUCTION
algorithms we could query the data spatially and easily from Cassandra. Qbeast offers some parameters like density that can be useful for decisions like selecting initial k cluster for K-means or how to merge two different clusters in DBSCAN (partitioned).
Some other optimizations will include pre-sampling of the data, using a percentage of the total data for selecting initial clusters for K-means may improve significantly a run of the algorithm with the total data and custom centers set from the pre-sampled previous run of the algorithm. Also, incrementally increase the data as the algorithm is being executed could show interesting results.
Furthermore, we will evaluate the optimization’s improvements in terms of run-time, computation cost and quality of the output. For instance, we will measure the speedup obtained when running K-means with custom centers from a pre-sampled execution and compare it against a normal execution.
1.7
V
ALIDATION METHODS
We will use a hypothesis, test and validation approach during our development, along with the combination of weekly meetings with the project director and tutor for supervision will ensure the validation the objectives and the correct evolution of the project.
1.8
P
OSSIBLE OBSTACLES AND SOLUTIONS
The higher risk is that theoretical advantages could result in an insufficient considerable performance improve-ment. If that were the case, we would be aware of that thanks to this project. The path followed when a new approach is proposed to solve an issue regarding state of the art implementations usually means obstacles will appear, and sometimes unexpectedly. As it has happened before [32], out of memory exceptions are a common issue when running Spark implementations. Even if a node has a lot of memory, the memory is shared between cores in the node. Hence, the number of cores used on each node has to be restricted using the -executor-cores parameter, thus reducing parallelism, but leaving each thread more RAM. An issue that may be hard to overcome is the strong dependency between partitioned clusters for scalable K-means++, even if every partition can be computed efficiently between nodes there will always be a dependency in communicating each of the parti-tioned cluster centers between them. Moreover, pre-sampled data percentage can be different for each data set so that must be taken into account. Also, The cost of indexing the data in Cassandra could become a bottleneck, if there is too much data to be indexed “fast” a possible idea could be indexing incrementally or in samples. In addition, scalable implementations of DBSCAN require a complex process to merge different clusters from different partitions, doing this process efficiently and with good results could be the most important challenge for a scalable DBSCAN.
Chapter 2
Project planning
In this section, a description of the project phases and the resources and requirements for each one is provided along with the planning and scheduling.
The expected project duration is of about 4 months. The project started on 2nd February, 2019 and the estimated end is on 25th June, 2019, before the presentation sessions begin.
Initially we thought about optimizing both K-means and DBSCAN following the scheduling of the different tasks described next. Along with discarding DBSCAN optimizations, some plan deviations will be pointed out at the end of this chapter.
2.1
T
ASK DESCRIPTION
2.1.1 Background in distributed computing
In the last months I have been studying distributed computing as a requirement for my job position at BSC, and as a preparation for my TFG. The study mainly consisted in firstly, getting to know the general concepts to then, start reading papers about MapReduce [16] [17] and Apache Spark [8] [34]. From there I started to get familiar with scala, which is a programming language that has good cohesion with distributed computing and, in particular, Apache Spark framework. Moreover, I started to take a look at MLlib [31] for the particular application that this project wants to examine. This process took several months because I was at the same time studying the lectures for a semester at FIB. This task did not require any material resources besides printed documents, but it did require human resources and time to read and understand all the information.
2.1. TASK DESCRIPTION CHAPTER 2. PROJECT PLANNING
2.1.2 Background in NoSQL databases
NoSQL databases was another topic that I had to get to know for the first time, understanding how distributed databases work was required because in this project we will be using the indexing algorithm (Qbeast) for the NoSQL database Apache Cassandra. For that, research [27] was made in order to understand how NoSQL databases work. Furthermore, the cluster Minerva at DAC was used to run Cassandra in different nodes for testing. This task only required human resources in the research phase. On the other hand, hardware and software resources were used to setup a Cassandra instance in Minerva cluster at the last phase.
2.1.3 Background in clustering algorithms
There are plenty of clustering algorithms, and each of them have different implementations for sequential and scalable techniques. This task is focused on understanding the state of the art of the current clustering algorithms and in particular, focus on the scalable versions of the algorithms. Approximately one month was required in order to get the sufficient background about clustering algorithms, and after that a precise analysis was made to select which algorithms we are going to center on. K-means and DBSCAN will be the main algorithms in which we will test possible optimizations. This study only took human resources besides the print of documents.
2.1.4 Analyze and implement possible optimizations
This task consists in a thorough analysis of the algorithms K-means and DBSCAN, to then study which opti-mizations to test for each algorithm. The optiopti-mizations will be centered on these techniques:
• Pre-samplingthe data before running the algorithm. For instance, in K-means we can take advantage of this technique to select initial centers, running the algorithm with a small percentage of all the data can be very fast, and using the final centers of that run as the initial centers for the run with all the data could be beneficial.
• Increasing the data, with this technique we want to run the algorithm with an small percentage of data, and increase that percentage of data over the iterations of the algorithm.
• Region Query, some of the density-based algorithms like DBSCAN can take advantage of a partition of the space for the scalable optimizations, where each partition is executed in an independent node, doing region queries to select the data directly in a region instead of computing all the data and then selecting a region could be beneficial.
• Oversampling of data, when clustering data, some regions of data are dense enough that may not need to be computed to know they form a cluster, Qbeast can provide the density of a region easily. If we could avoid computing some regions of data because they are dense enough, we could improve the run-time.
Also, this task includes the implementation of such optimizations, hence this task will require a considerable large amount of time.
2.1. TASK DESCRIPTION CHAPTER 2. PROJECT PLANNING
As a disclaimer, since the project is still at an early stage ideas for optimizations and experiments may differ from the actual ones that may be performed.
The resources needed for this task are:
1. Human Resources
• The developer needs to analyze and implement. 2. Hardware Resources
• Personal laptop used in all tasks for this project. • Minerva cluster at DAC to do tests in a real cluster. 3. Software Resources
• OpenSuse 15 OS used in all the tasks.
• Scala: used to build the scripts for the experiments.
• Libraries: Set of libraries and dependencies to run the experiments, such as MLlib, spark cassandra connector, etc.
2.1.5 Setup benchmark environment
Before doing any test, we need to define the setup where we will be performing the experiments. On one hand, we will have two kinds of data sets, a synthetic dataset created by us from 1M to 3M 3D/4D points and a real data set. The real data was obtained by Junjun Yin from the National Center for Supercomputing Application (NCSA) using the Twitter streaming API. This data set contains 3 704 351 longitude/latitude points and is available at the scientific data storage and sharing platform B2SHARE. There, the data is contained in file twitterSmall.h5.h5. A bigger Twitter data set twitter.h5.h5 from the same B2SHARE location covers whole of June 2014 containing of 16 602 137 data points.
On the other hand, the experiments will be performed in different clusters. We intend to perform the experiments in Minerva cluster (at DAC), Marenostrum (at BSC), and AWS.
The resources needed for this task are:
1. Human Resources
• The developer needs to setup the benchmark environment by installing all libraries and software required to make experiments.
• Help from the BSC’s support team. 2. Hardware Resources
2.2. ESTIMATED TIME CHAPTER 2. PROJECT PLANNING
• Minerva cluster at DAC where tests will be executed. • Marenostrum cluster at BSC where tests will be executed. • AWS cluster from Amazon where tests will be executed. 3. Software Resources
• OpenSuse 15 OS used in all the tasks. • Scala: used to implement the optimizations. • Python: used to implement scripts and tests.
• Libraries: Set of libraries and dependencies to run the experiments, such as MLlib, spark cassandra connector, etc.
2.1.6 Perform the experiments
During this task, a set of benchmark experiments will be made following a test and validation approach method. Once we have analyzed properly all the possible optimizations, we will try to test them in an order of achievable-approach manner to validate them, thus the optimizations that we think are easier to implement and more likely to success will be made first. Each experiment will be executed several times and measure of the mean of each run-time will be made as a standard method. In Minerva, we will make sure all caches are dropped after each execution to avoid cache exploitation for concurrent executions. The same executions will be made in different clusters to be able to compare how the scalability is affected in different environments.
The resources needed for this task are:
1. Human Resources
• Setup and run correctly the experiments 2. Hardware Resources
• Personal laptop used in all tasks for this project.
• Minerva cluster at DAC where the experiments will be performed. • Marenostrum cluster at BSC where the experiments will be performed. 3. Software Resources
• OpenSuse 15 OS used in all the tasks.
• Scala: used to build the scripts for the experiments.
2.2
E
STIMATED TIME
2.3. GANTT CHART CHAPTER 2. PROJECT PLANNING
Task Estimated duration time (h)
Background in distributed computing 55 Background in NoSQL databases 60 Background in clustering algorithms 70 Analyze possible optimizations 105 Setup benchmark environment 50 Perform the experiments 80
Final stage 30
Total 450
Table 2.1:Estimation of the duration time (hours) of the tasks
2.3
G
ANT T CHART
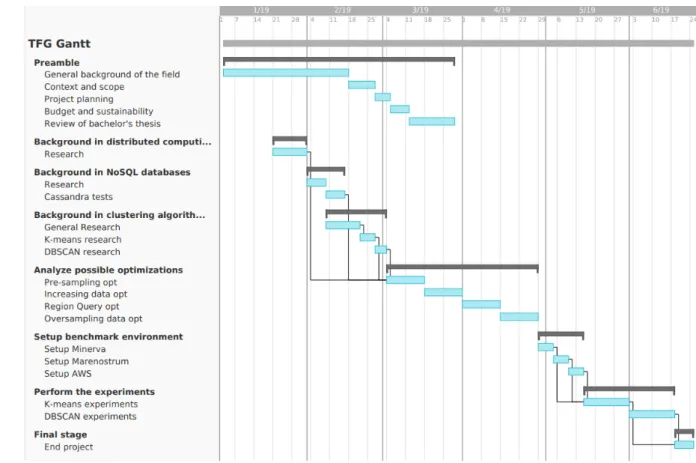
Figure2.1(next page) shows the tasks planned for the project in a Gantt chart.
2.4. ALTERNATIVES AND ACTION PLAN CHAPTER 2. PROJECT PLANNING
2.4
A
LTERNATIVES AND ACTION PL AN
As it has been explained, the use of a test and validations lock methodology (agile) will allow to revise and adapt dynamically this initial planning. Although the main ideas for optimizations and duration time are set, if alterations occur, such as bugs or a task has a different duration from the expected one, the planning will be modified accordingly. If a task lasts more than expected, a later task will have to be shortened or, in the worst case cut out of the action plan. On the other hand, if a task has less duration than the expected, the next task will start as soon as possible.
As pointed out previously, the optimizations are decreasingly ordered based on the estimated gain in terms of executions time and feasible implementation. Weekly meetings have been arranged with the project director and tutor to detect possible deviations from the original planning with enough time to be able to correct them. Even though we will try to prevent possible deviations, if we were too much behind schedule an alternative solution would be to cut out less important tests or reduce its number for each optimization, being able to present all the results but in this case with less quantity or accuracy. Moreover, coming across with a bug will mean:
• Firstly, if the developer isn’t able to fix it by himself, he will ask for help to the tutor/director of the project. • If we cannot overcome a bug we would decide whether to rollback to a previous version or change the
code (and possibly the end solution) to avoid part of the code related to the bug.
Summarising, with an estimated dedication of 30 hours per week and a total budget of (16x30) 480 hours and the alternatives mentioned above, the project planning is feasible.
2.5
P
L AN
D
EVIATIONS
2.5.1 Goal and contextualization
The goal of the project was to study how Machine Learning algorithms can take advantage of multidimensional indexing with efficient sampling (MIS).
We optimized K-means algorithm, which is a clustering algorithm that is used to classify data in an unsuper-vised way. We want to integrate the new technology Qbeast to handle the data for the algorithm, it will work as a multidimensional indexing algorithm on top of Apache Cassandra. Moreover, we are using Apache Spark because it is a state of the art framework for distributed computing, which supports a K-means library and a Cassandra connector, that we will use to query the data from the NoSQL database.
K-means is one of the most famous clustering algorithms that is widely used in the market, use-cases go from brain tumor detection in the eHealth field to document classification. Even though it is a common algorithm, it has some problems because it requires a lot of computation and its scalability is bad.
2.5. PLAN DEVIATIONS CHAPTER 2. PROJECT PLANNING
We decided to use Scala programming language to implement the optimizations because it’s very popular in Big Data projects and supports the technologies that we want to use. We can import all the spark libraries which contain K-means algorithm very easily, as well as using the spark connector for Cassandra. The reason why we did not choose Python, which also supports ML algorithms, is that it does not provide distributed ML libraries. Also, the most mature and popular distributed Machine Learning is written in Scala.
Though, to validate the solution of our optimizations we used silhouette score which is an sklearn algorithm for Python.
2.5.2 Project plan deviations
Initially we thought about implementing and testing DBSCAN algorithm. But, as research projects usually suffer plan deviations, some changes have happened regarding the initial planification. The optimizations for DBSCAN algorithm have been discarded of the project because the complexity to implement some scalable parts of the algorithm using Spark(Spark MLllib doesn’t support DBSCAN) was too costly along with the time to implement and test K-means optimizations which was already enough workload. So, benchmark tests for DBSCAN have also been discarded.
Moreover, a point that we didn’t take into account in the initial planification is that a lot of time was needed to setup the cluster environment at Marenostrum, analyze the scalability of the algorithms and understand that we are doing it right, so that the tests that we are gonna perform make sense in comparison between them.
For these reasons, we have re-defined the optimizations related to K-means, reduced to a couple of opti-mizations (Bi-phase and Multi-phases) that were the most promising to show good results. The main objective to show that the K-means algorithm by itself doesn’t scale well and that with our optimizations we can obtain significant Speedups remained.
Furthermore, initially we thought to use two different data sets from Twitter that are publicly available, but we saw that we needed higher amounts of data as well as more data sets to perform weak scaling tests. That is why we ended up using a single large data set from Open Street Map where we took the Geo-localization parameters and skewed the whole data set to form different data set sizes. Mainly we ended up using a small skewed data set (2,6G) and a bigger one of 26G.
Also, with the optimizations that we chose for K-means we selected which features need to be implemented for Qbeast to support ML and our optimizations. Therefore, the last section about the Qbeast results will be focused on comparing the results with an approximation of how efficient sampling will work.
The overall cost of the project has not changed, the developer has worked the amount of hours that was initially planned. Minerva cluster was mainly used to test the algorithms correctness before performing tests in a high-end cluster like Marenostrum4. We also thought to perform tests in AmazonWebServices clusters, but we finally discarded it because the tests performed at Marenostrum4 were already conclusive.
Finally, the state of the project plan is almost close to the end, further tests need to be performed and finally write down everything in the memory.
2.6. BUDGET AND SUSTAINABILITY CHAPTER 2. PROJECT PLANNING
2.5.3 Methodology
There haven’t been significant methodology deviations. Though, a methodology that we had not mentioned before and is worth to be pointed out is the performance metrics that we chose to understand the scalability of the algorithms, before we went on to start performing the experiments.
2.5.4 Analysis and alternatives
There is a lack for specialized frameworks for multidimensional data. We chose Qbeast on top of Cassandra as the indexing algorithm because it shows better performance than native Cassandra, that does not provide spatial sampling and efficient sampling(percentages of data). It also shows better performance than multidimensional PostgreSQL.
2.5.5 Laws and regulations identification
We are using technologies from Apache Software Foundation. Since Spark and Cassandra are open-source they are freely available to the public. In this case, the license to which refers is one of the most known: Apache License 2.0 [7]. To sum up, it has some conditions and limitations:
• Allows its commercial use, distribution, modification, patented use and private use. • The license must remain and is susceptible to state changes.
• Limits the responsability, use of brand and warranty.
On the other hand, Qbeast is a brand new technology, patent pending protected IP that will be published in April 2020.
2.6
B
UDGET AND SUSTAINABILITY
2.6.1 Sustainability self-assessment
The poll is about the self-evaluation of sustainability knowledge. Its main goal is to get information of the knowledge and competences in sustainability from teachers and students in the Spanish university system.
The poll is divided in three dimensions: social dimension, environmental dimension and economical dimension. A set of question are targeting each dimension individually.
My personal opinion about the knowledge acquired about sustainability in the university system is that it should be learnt exclusively in a compulsory subject. I was lucky to course APC which helped me understand better some of the concepts about sustainability, but most of my colleagues did not take that course and hence,
2.6. BUDGET AND SUSTAINABILITY CHAPTER 2. PROJECT PLANNING
in my opinion they have not learnt enough concepts about sustainability during the degree. One way in which the university could include the variable of sustainability more effectively could be integrating that in a project. I have done many projects during the degree and despite TFG, none includes concepts about sustainability.
We are aware of the issues that pollution provokes, we know that we should be as sustainable as possible. With digitization, sometimes we forget that small things like sending an email or doing a google search means CO2 emissions to the atmosphere. And if we scale it to millions of people and hundreds of services we can realise that we can send tons of CO2 with small actions.
I think that digitization is unstoppable and technology is our ally, but we need to be really aware of the consequences that it produces, and we need to think always with the sustainability variable at our side.
But for that, it is really important that more awareness is given in the education sector, which is probably the most important one since in our case, engineers can have a high impact when deciding how to implement projects to be respectful towards the environment.
2.6.2 Project budget
In order to carry out this project, a set of Hardware and Software resources mentioned earlier will be used, next we will detail the budget of these two resources along with Human resources as they are also part of the total budget. In addition, risk and indirect costs will be taken into consideration and are described in this section.
2.6.2.1 Human resources budget
This project will be performed by a single person. This person will need to act for all the basic roles in a project, Hence, this person will need to be a project manager, software developer and, since we need to perform benchmark tests in this project this person will also act as a tester. Each role will be responsible for different tasks distributed in the total of 450 hours. In table2.2an estimation of the human resources budget is provided.
Tasks Role #Hours €/hour Total cost (€)
1, 2, 3, 4, 5, 6,
7, 8, 9, 10, 16 Software developer 260 35 9.100
11, 12, 13, 14, 15 Tester 150 30 4.500
7, 8, 9, 10, 16 Project manager 40 50 2.000
Total 450 15.600
Table 2.2:Human resources budget(€) and task association per role
Each number in column Tasks represents a different task from the Gantt chart provided in the project planning section. Number 1 would be the first task counting from: Research- Background in distributed computing. Number 16 would be the last task from the chart:End project- Final stage.
2.6. BUDGET AND SUSTAINABILITY CHAPTER 2. PROJECT PLANNING
2.6.2.2 Hardware budget
A set of hardware resources will be needed in order to implement the optimizations previously explained and to perform all the needed benchmarks. Table2.3shows the estimation cost of the hardware required for this project taking into account the cost per unit, useful life and amortization of each product.
Product Units Cost/u (€) Useful life (years) Amortization (€)
Dell Latitude 7480 1 1.567,4 5 130,6
Minerva 1 0 - 0
Marenostrum 1 - - 0
Total 1.567,4 130,6
Table 2.3:Hardware budget
In relation to the amortization of the products, the amortization cost for the Dell Latitude 7480 is based taking into account 5 months of its use. Moreover, Minerva is a 6 year old cluster, and we consider that it has already been amortized. As for Marenostrum costs, we will minimize the use of it, most of the implementations and analysis will be performed in Minerva, thus, we will consider this costs as negligible. Finally, the cost of AWS t3.small virtual machine is 0.0208€/h and we will use it for two weeks (60 h).
2.6.2.3 Software budget
Many Software resources will be need in order to carry out the project. All the software that will be used for the project is free since the university email and business partnerships allow us to get plenty of software for free. Although some of the software is already free without the need of these tools, some software resources restrict their content for the standard version, but we can unlock the education/professional version thanks to the emails or business partnerships.
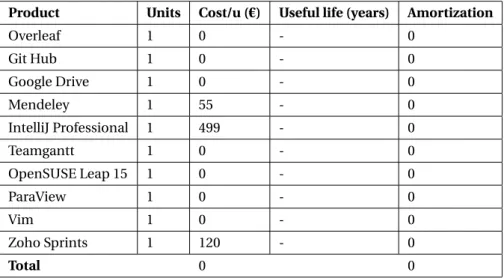
Product Units Cost/u (€) Useful life (years) Amortization
Overleaf 1 0 - 0 Git Hub 1 0 - 0 Google Drive 1 0 - 0 Mendeley 1 55 - 0 IntelliJ Professional 1 499 - 0 Teamgantt 1 0 - 0 OpenSUSE Leap 15 1 0 - 0 ParaView 1 0 - 0 Vim 1 0 - 0 Zoho Sprints 1 120 - 0 Total 0 0
2.6. BUDGET AND SUSTAINABILITY CHAPTER 2. PROJECT PLANNING
Table2.4shows the estimation cost of the software required for this project taking into account the cost per unit, useful life and amortization of each product.
2.6.2.4 Risk costs
In addition, an estimation of unexpected costs is shown in table2.5, derived from the potential deviation of the project plan.
Role Hours €/hour Total cost (€)
Software developer 25 35 875
Tester 25 30 750
Project manager 10 50 500
Total 60 2.125
Table 2.5:Risk costs
We consider the potential incidents listed next:
• Delay in any task.
• Issues regarding the clusters where we will be performing the tests. • Issues regarding the implementation of any optimization.
In order to resolve the potential incidents the plan is to either work more hours to end in time or more hours per day to comply the schedule.
2.6.2.5 Indirect costs
Indirect costs when carrying out the project would be transport, electricity and connection to the internet. In table2.6a list of the indirect costs is shown.
Element Cost (€) Units Total cost (€)
Transport (T-jove) 105 2 210
Internet 35/month 4 months 140
Electricity 0,135/kWh 2000 kWh 270
Total 620
Table 2.6:Estimation of the indirect costs for the project
2.6.2.6 Total budget
Finally, to measure the total budget of the project shown in table2.7, we add all the budgets provided above including 4% of contingency that has been added over the total cost in order to cover unexpected costs.
2.6. BUDGET AND SUSTAINABILITY CHAPTER 2. PROJECT PLANNING
Concept Total cost (€)
Human resources budget 15.600 Hardware budget 131 Software budget 0 Risk costs 2.125 Indirect costs 620 Total partial 18.476 Contingency (4%) 739 Total 19.215
Table 2.7:Total budget
2.6.3 Budget control
For the project we will monitor the budget in order to control it in case any deviation occurs during the project’s development, after the end of each task we will check whether the budget should be updated according to the duration of that task and the remaining hours left for the next tasks. We will detect any possible deviation due to variance in cost or consumption (and time) since we track both the amount of hours per task and the cost (resources) spent in each task.
Moreover, all of this is done taking into account that we already have a contingency plan in terms of both budget and time.
2.6.4 Sustainability report
In this section we analyse the sustainability of the project in three different dimensions based on the sustain-ability matrix shown in table2.8.
PPP Useful life Risks Environmental 8/10 8/10 -1/-10
Economical 7/10 6/10 -2/-10
Social 6/10 8/10 -1/-10
Table 2.8:Sustainability matrix
2.6.4.1 Environmental dimension
The expected consumption in the development stage of the project is the consumption of the electricity in the work environment, both for the basic equipment like the laptop and any cluster used for the tests. To optimize time and energy when doing the tests, we want to run multiple executions per test to take advantage of the data from Cassandra already cached, instead of doing a single execution per test. As for the useful life, the goal of the project is to optimize clustering algorithms, and by doing that, we would be reducing the energy consumption
2.6. BUDGET AND SUSTAINABILITY CHAPTER 2. PROJECT PLANNING
of the algorithms (in run-time). Thus, this project could potentially improve the ecological footprint of current solutions. Furthermore, the current proposed solution would avoid computation time thanks to range queries and pre-sampling techniques.
As for the reduction of the environmental impact, next are listed some methods that we will try to carry out:
• Working from home to avoid the transport cost to university.
• When performing some of the tests multiple executions must be carried out, we will perform those executions sequentially to take advantage of the resource allocation from the initial job, instead of submitting a job for each execution.
• Any given code implementation already made that we can use will be taken into account instead of losing time and effort to implement it ourselves, that would ultimately induce into an environmental cost.
2.6.4.2 Economical dimension
As pointed out previously, the quantification of all the costs has been shown for all types of resources. The proposed solution has been concrete for our project, but it is hard to compare it with other implementations. We can observe that the budget can easily increase over time, we hope that the work in this project will be worth for future applications in which could contribute. Since our solution will be an optimization in run-time and resource consumption it will also be beneficial in the economical dimension.
2.6.4.3 Social dimension
Personally, this project will bring me the necessary experience for the labour market, which is not acquired during the rest of the degree. From the point of view of environment and professional relations, towards meetings to discuss the direction of the project. Also the fact to work against deadlines and the responsibility of the mistakes that it produces.
Being Big Data such a hot topic and having the possibility to improve the current state of the art of data classification is a huge motivational factor.
Although it can be left unnoticed for a lot of people, mainly because applications in data analysis are usually hidden behind products and applications, a wide variety of current real use-cases such as medical field, air traveling field, etc, can be benefited considerably if these use-cases are able to classify their data in a better way.
Chapter 3
Selected optimizations implementation
The goal of the experiment is to test and compare how our optimizations improve the state of the art of K-means in terms of run-time and computation cost. Our optimizations aim to take advantage of Multidimensional Indexing with efficient Sampling (MIS), that allows us to obtain samples of data much faster than classic management of data obtained from disks. These optimizations will allow to obtain K-means convergence much faster and hence, improve many K-means use-cases in the modern world. For instance, machines will be our future doctors, given the symptoms of the patient they will be able to detect the illness of the patient before you leave the room. Moreover, any given application with a process of clustering which can slow down many product pipelines will be able to improve and get a solution for their product in a faster way.
3.1
O
PTIMIZATIONS
The optimizations have been implemented in Scala using Apache Spark framework to distribute the compu-tation in a cluster. We have implemented each optimization with two kinds of data source, one reading data from disk to first analyze the viability of the optimizations and the other one reading from Cassandra on top of Qbeast indexation.
3.1.1 Bi-phase
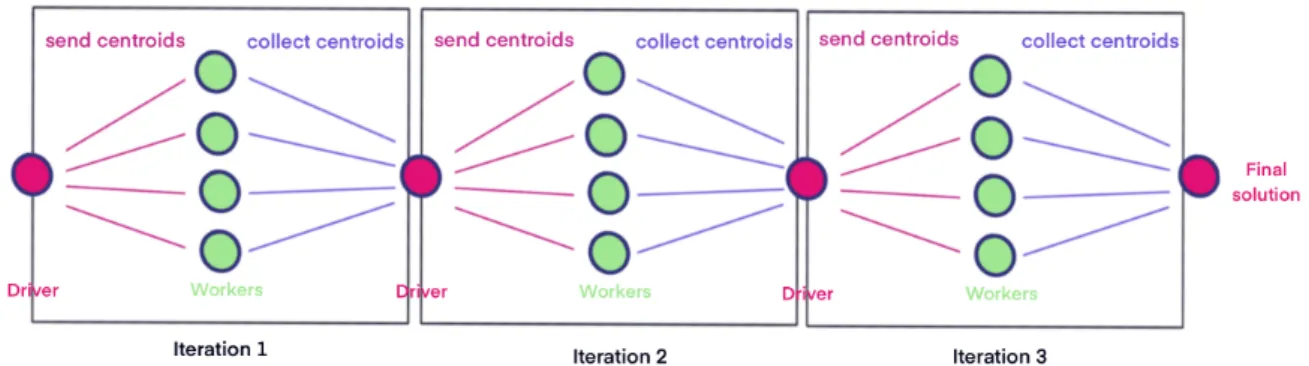
This optimization consists of two main phases, the first phase takes care of a K-means execution with a small percentage of all data. After that, another K-means execution is performed, but now with all the data and centers initialized from the output of the previous run. K-means implementation from MLlib allows us to set custom centers before starting the algorithm, hence we can get the output from one execution, and use it to initialize a different one. In figure3.1we can observe a representation of the data along with a formal notation right after.
3.1. OPTIMIZATIONS CHAPTER 3. SELECTED OPTIMIZATIONS IMPLEMENTATION
Figure 3.1:Bi-phase Data partition
D= ∪1i=0Pi
K0=K means(P0,cent r oi d s(r and om))
K1=K means(D,cent r oi d s(K0))
The idea is that with Qbeast we will be able to obtain small percentages of data faster than querying all the data, and "on the go" we will be able to perform a K-means execution with that smaller amount of data while we wait for the rest of the data to be loaded. Moreover, K-means standard initialization can be inefficient because random values are not optimal for center initialization, we can take advantage of the last state of the centers from a previous execution with an smaller percentage of the data, but still relevant. In any case, we can find many optimizations for the initialization of the centers. Our optimizations will always have the first phase where an initialization mode is needed, we could choose between random initialization or any kind of available optimization to set initial centers.0
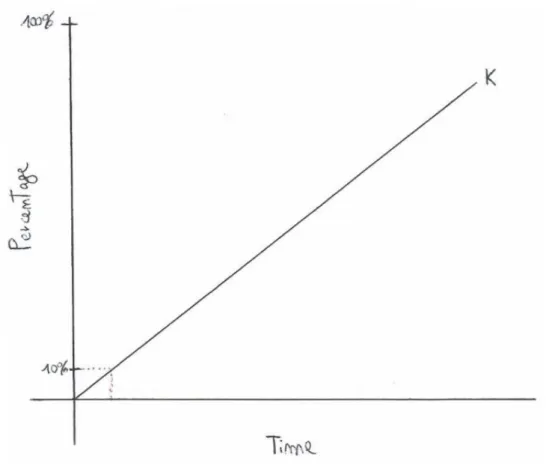
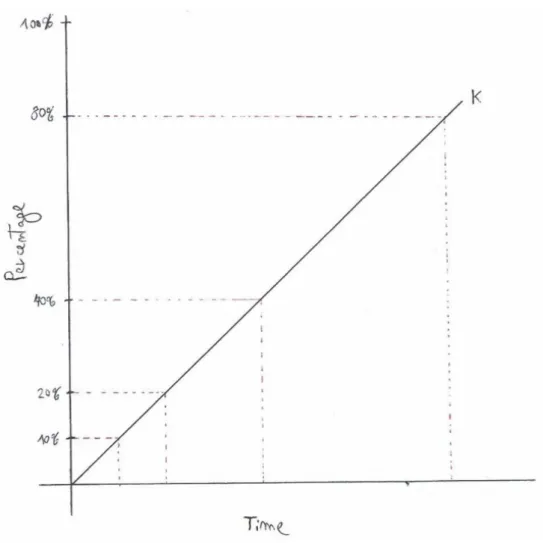
To make it clearer, Figure3.2shows an example of how a data storage that supports efficient sampling behaves in time. The time spent to query percentages of data is strongly dependent on K, that represents the cost to query data. The total cost of the algorithm will depend on that value. For the simulation tests where we read data from disk, we consider that value as 0. Because we want to analyze the theoretical results with an ideal scenario we measure the run-times having all the data already cached. Though, with Qbeast its performance to query data (value k) will affect the overall cost of the algorithm. We can describe the cost of the algorithm
3.1. OPTIMIZATIONS CHAPTER 3. SELECTED OPTIMIZATIONS IMPLEMENTATION
Figure 3.2:Bi-phase data percentage
f(Nor mal)=100 k +Tkm f(Bi−phase)= 10 k +max( 90 k ,T1phase)+T2phase
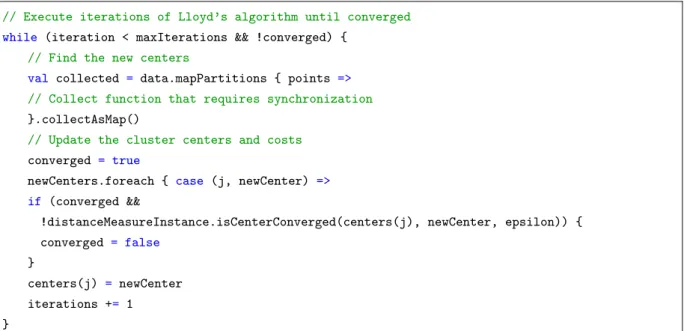
The code begins with arguments such as number of K-means centers (k), max iterations number and percentage of data to be sampled. Then3.3, we create a resilient distributed data set [40] of the entire data with Spark connector to our Cassandra database, partition the data (i.e repartition = number of cores) and with Qbeast we are able to query the sample without processing all the data.
var sampledSource =
spark.read.format("org.apache.spark.sql.cassandra")
.options(Map("keyspace" -> "benchmark", "table" -> "m4", "sampling" -> "true", "pushdown"
-> "true"))
.load().select("x", "y").rdd
.map(row => Vectors.dense(Array(row.getDouble(0), row.getDouble(1))))
if (args.length > 6) sampledSource = sampledSource.repartition(args(6).toInt)
val sampledVector = sampledSource.sample(false, percentageData) //Sampling data
3.1. OPTIMIZATIONS CHAPTER 3. SELECTED OPTIMIZATIONS IMPLEMENTATION
Next, we initialize a K-means class with a previously saved initial model and execute the first phase. Finally, we execute the second phase with the output centers from the first one3.4.
val oldRandomModel: KMeansModel = KMeansModel.load(spark.sparkContext, "randomModel")
val kmeansSample: KMeans = new KMeans().setK(numclust).setMaxIterations(iter) .setSeed(3132626920565747559L).setInitialModel(oldRandomModel)
//Execute k0=Kmeans(P0,centroids(random)
val (timeSampling, modelcluster) = time(kmeansSample.run(sampledVector))
val allData = sampledSource
val meansRUN = new
KMeans().setK(numclust).setMaxIterations(iter).setInitializationMode(mode) .setInitializationSteps(steps).setInitialModel(modelcluster)
//Execute k1=Kmeans(D,centroids(k0)
val (timeFullData, clusterModelRandom) = time(meansRUN.run(allData))
Figure 3.4:Bi-phase implementation: K-means phases execution
3.1.2 Multi-phases
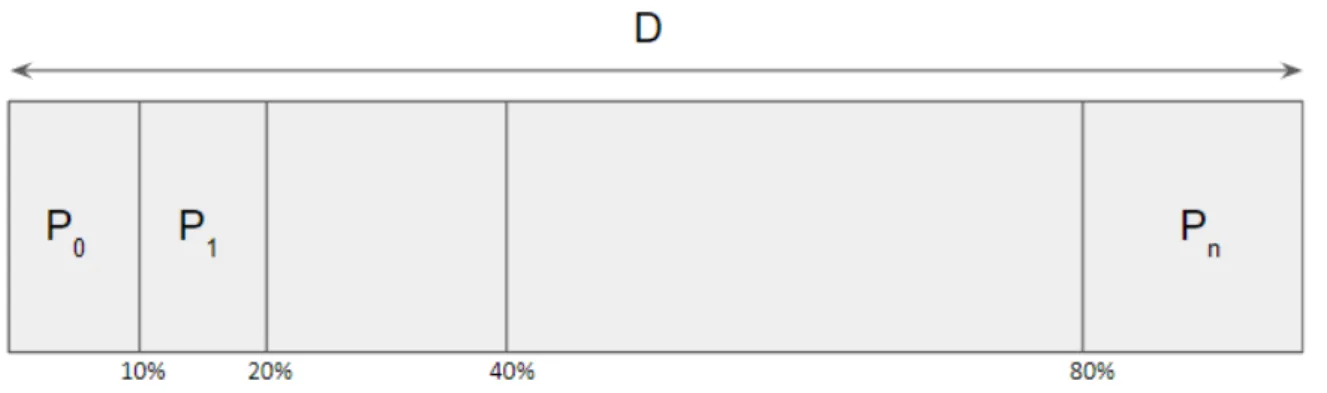
The point of this optimization is alike Bi-phase, to take advantage of Qbeast fast access to data over time, which requires smaller time to obtain small percentages of the data, and as percentage of data increases, more time is needed to obtain higher percentages of data. In this case, that can be visualized in Figure3.5along with the formal definition right below. N executions of K-means are performed, each execution uses a percentage of the data that increases over n, and each execution -except the first one- initializes its centers from the previous output. Precisely, we will test this optimization with three kinds of data percentage increase over the phases following the ideas from [25][12]:
• Linear: The first one starting at 10% of the data and increasing the same data percentage value(+10%) until reaching all data.
• Geometric: The second one starting at 10% of the data and increasing in powers of two until reaching all data (10%,20%,40%,80%,100%).
• Order of magnitude: Lastly we will test with smaller percentages in products of 10 (0,1%,1%,10%,100%). Which fits best when using Qbeast indexing to query data, since small percentages can be queried much faster.