HEDG Working Paper 09/27
“Do I really need to go to rehab? I’d say no, no, no.”
Estimating Price Elasticities of Convalescent Care
Programs
Ziebarth, Nicholas
July 2009
ISSN 1751-1976
“Do I really need to go to rehab? I’d say no, no, no.”
Estimating Price Elasticities of Convalescent Care Programs
‡
Nicolas R. Ziebarth
SOEP at DIW Berlin and TU Berlin∗
July 13, 2009
‡I would like to thank Martin Karlsson, Jochen Kluve, Michael Kvasnicka, Therese Nilsson, Nigel
Rice, Hendrik Schmitz, Matt Sutton, Tom Siedler, Gert G. Wagner, and participants in seminars at the 2008 Latin American Meeting of the Econometric Society (LAMES), the 2009 Health Economists’ Study Group (HESG) Meeting in Manchester, the 2009 Annual Conference of the Royal Economic Society (RES), the SOEP Brown Bag, and the Berlin Network of Labour Market Researchers (BeNA) for their helpful comments and discussions. I take responsibility for all remaining errors in and shortcomings of the article. Financial support in the form of a scholarship from the Stiftung der Deutschen Wirtschaft
(sdw, Foundation of German Business) is gratefully ackknowledged.
∗German Institute of Economic Research (DIW Berlin), Socio-Economic Panel Study (SOEP),
Grad-uate Center of Economic and Social Research, Mohrenstraße 58, D-10117 Berlin, Germany, and Berlin University of Technology (TUB)e-mail: [email protected]
Abstract
This study is the first to estimate the price elasticities of demand for both medical rehabilitation programs and treatment at health spas. In Germany, the Statutory Health Insurance (SHI) covers both forms of therapy if administered in authorized medical facilities on referral from a physician. While health resort stays are prescribed to recover from general symptoms of poor health and are preventive in character, medical rehabilitation implies recovering from a specific illness or accident. From 1997 onwards, the German government more than doubled the copayments for both types of health care services from DM 12 (e6.14) to DM 25 (e12.78) per day for those insured under the SHI. Using longitudinal microdata from the German Socio-Economic Panel Study (SOEP), this exogenous price variation allows us to study the causal effects on demand, since we have a sound control group available. The data suggest that pull-forward effects in 1996 accounted for up to one-fifth of the subsequent decrease in demand. Taking this anticipation effect into account, we show that the reform induced a decrease in total demand of about 20 percent. We estimate the price elasticity for rehabilitation programs that aim at preventing work incapacity to be about -0.15, whereas the elasticity for rehabilitation programs for recovery from work accidents lies around -0.30. In contrast, the price elasticity for treatment at health spas is elastic and lies between -1 and -2.5.
Keywords: convalescent care, health spa, medical rehabilitation, price elastici-ties, SOEP
1
Introduction
How does the demand for medical care change when prices change? Since the early days of the profession of health economics, the question of the price elasticity for health services has been central. Alone Joseph P. Newhouse, one of the founders of the field of health economics, has published more than 100 articles on health care demand. Newhouse was also the leader of the RAND group that designed and directed the famous RAND Health Insurance Experiment that focused on the impact of cost-sharing on the demand for medical care. Not only Newhouse but also many other renowned economists have devoted a great deal of attention to this topic.
Many health economists have tried to causally link the level of cost-sharing to the demand for individual health services or entire insurance plans. Most of the existing studies use North American data from the 1960s, 70s, or 80s. Unfortunately, most of these datasets are not even representative for the U.S. but are limited to individual cities, counties, states, or specific health insurance plans. In a health insurance market like that of the U.S., which is dominated by private insurance providers, it is extremely difficult to deal appropriately with health status related sorting into different health plans. Another issue is the poor comparability of the estimates, given that private health insurance providers usually offer plans that differ with respect to deductibles, coinsurance rates, stop-losses, and copayments. Studies relying on such a framework are forced to calculate the change in demand as a response to a change in one or more of these parameters. When making estimates with variations in two or more parameters comparable to those where only one parameter is varied, it becomes necessary to extrapolate the results making more or less strong assumptions.
The RAND Health Insurance Experiment (HIE) remains the largest health policy study in U.S. history until today. It was set up in 1971 and is still the methodological “gold standard” when it comes to demand for health care. Families at six different sites in the U.S. were randomly assigned to 14 different health insurance plans and observed for up to five years (Manning et al., 1987). Besides concerns about higher refusal rates for certain health plans and the generalizability to other health care systems and countries, the biggest problem of this study is its age. After almost 30 years one might question the extent to which the results apply to the present and to the behavior of insured people today. Various authors have highlighted different aspects of the experiment which are documented in more than 300 publications, most of them from the 1980s (Zweifel and Manning, 2000).
Convincing empirical evidence from countries other than the U.S. is very scanty. In recent years, remarkably few studies have convincingly identified causal effects and accordingly derived elasticities (Chiappori et al., 1998; Cockx and Brasseur, 2003; Bishai et al., 2008). In addition, there is surprisingly little evidence on the price elasticity of
demand for preventive care, despite its potentially high relevance for public health. The few existing studies suggest that these elasticities are higher than those for other medical services, but, to the best of our knowledge, no study up to the present day has come up with a concrete estimate (Roddy et al., 1986; Keeler and Rolph, 1988; Ringel et al., 2002).
Most studies estimate the overall price elasticity of the demand for health services to lie at around -0.2. Outpatient care is found to be more elastic than inpatient care, and mental health care more price responsive than outpatient care. There is evidence that price elasticities are higher in the short run than in the long run. Moreover, it has been shown empirically and theoretically that elasticities are lower for more severe illnesses and for more urgent care (O’Grady et al., 1985; Wedig, 1988; Keeler et al., 1988; Lee, 1995; Zweifel and Manning, 2000). However, since elasticities are most likely subject to cultural influences, to differences in health care systems, and to change over time, a conclusive answer to the question of how demand for medical care responds to variations in prices is still lacking.
This study analyzes how an exogenous increase in the copayment rate for people insured under the Statutory Health Insurance (SHI) affected the demand for medical rehabilitation and treatment at health spas in Germany at the end of the 1990s. We contribute to the existing literature in a number of ways. Most importantly, this is the first study that provides price elasticity estimates for medical rehabilitation and treat-ment at health spas. As only one single parameter is exogenously varied, elasticites are computed without making further assumptions about other cost-sharing elements. Ad-ditionally, this is one of the few European studies on health care demand, and it uses recent and representative data for Germany, the largest country in Europe. Moreover, it is noteworthy that selection into or out of the treatment is no issue in this context. The majority of German citizens are compulsorily insured under the SHI system, which provides free universal health care coverage. Germany also has a variety of independent Private Health Insurance (PHI) providers for people in particular income and occupa-tional groups. Strict legal regulations prevent switching between the SHI and the PHI and thus make it impossible to switch out of the statutory system in response to reforms, which guarantees a sound control group for this natural experiment.
Except for a daily copayment, the German SHI fully covers medical rehabilitation as well as health spa treatments if prescribed by a physician and carried out in an authorized medical facility. From 1997 onwards, the daily copayment rates for medical rehabilitation programs and health spa treatments more than doubled for people insured under the SHI. We show that this increase has led to an overall decrease in the demand for convalescent care of around 25 percent. As the data suggest that pull-forward effects in the year prior to the reform are likely to have an effect, the pure policy-induced decline in demand is estimated to lie at around 20 percent. In consideration of these pull-forward effects, we
estimate the price elasticity for rehabilitation treatments that aim at preventing work incapacity to lie at around -0.15. Moreover, we estimate the elasticity for rehabilitation programs due to work accidents to be about -0.30. The elasticity of demand for physician-prescribed health spa treatments, which can be classified as preventive care, is much more price-responsive and is likely to lie between -1 and -2.5. To our knowledge, this is also the first attempt to compute price elasticities for preventive care, which is, according to our estimates, price-elastic.
In the next section, we describe some features of the German health care system and give more details about the reform. In Section 3, the dataset and the variables used are explained, and in the subsequent section, we specify our estimation and identification strategy. Estimation results are presented in Section 5. We discuss the results afterwards and conclude with Section 7.
2
The German Health Care System and the Policy
Re-form
The German health care system actually consists of two independent health care systems existing side by side. The more important of the two is the Statutory Health Insurance (SHI), which covers about 90 percent of the German population. Employees whose gross income from salary is below a politically defined income threshold (2007: e3,975 per month) are compulsorily insured under the SHI. High-income earners who exceed that threshold as well as self-employed people have the right to choose among the SHI, private health insurance, and remaining uninsured. Non-working spouses and dependent children are automatically insured by the SHI family insurance at no charge. Special groups such as students and unemployed people are subject to special arrangements, but most are SHI-insured. Everyone insured under the SHI is subject to a universal benefit package which is determined at the federal level and codified in the Social Code Book V (SGB V). Coinsurance rates are prohibited in the SHI and thus, apart from copayments, health services are fully covered. The SHI is one pillar of the German social legislation (German Ministry of Health, 2008).
The SHI is primarily financed by mandatory payroll deductions which are not risk-related. For people in gainful employment, these contributions are split equally between employer and employee up to a contribution ceiling (2007: e3,562.50 per month). De-spite several health care reforms that tried to tackle the problem of rising health care expenditures, the contribution rates rose from 12.6 percent in 1990 to 13.9 percent in 2007 mainly due to demographic changes, medical progress, and system inefficiencies (German Federal Statistical Office, 2008).
(PHI). Private insurance providers primarily cover private sector employees above the aforementioned income threshold, public sector employees, and the self-employed.1
Pri-vately insured people pay risk-related insurance premiums determined by an initial health checkup. The premiums exceed the expected expenditures in younger age brackets, since health insurance providers make provisions for rising expenditures with increased age. Coverage is provided under a range of different health plans, and insurance contracts are subject to private law. Consequently, in Germany, public health care reforms apply only to the SHI, not to the PHI.
It is important to keep in mind that compulsorily insured persons have no right to choose the health insurance system or benefit package. They are compulsorily insured under the standard SHI insurance scheme. Once an optionally insured (high-income or self-employed) person opts out of the SHI system, it is practically impossible to switch back to the SHI. Employees above the income threshold are legally forbidden from switch-ing back, while employees who fall below the income threshold in subsequent years may do so under certain conditions, but lose their provisions, which are not transferable (nei-ther between PHI and SHI, nor between the different private health insurance providers). In reality, switching to a private health insurance provider may be regarded as a life-time decision, and switching between the SHI system and PHI – as well as between PHI providers – is therefore very rare.
The German Market for Convalescent Care
In Europe, and especially in Germany, there is a long tradition of seeking care in health spas to recover from poor health. Since the time of the Roman Empire, “water cures” have been recommended for various disorders. In Germany, spa treatments are usually combined with various types of physical therapy, often including electrotherapy, massage, underwater exercise, ultrasonic therapy, health and diet education, stress reduction ther-apy, and cold and hot bath as well as mud applications. While spa therapies are usually prescribed to people suffering generally poor health and are often largely preventive, medical rehabilitation implies recovery from a specific illness or accident. In German, both therapy forms are commonly referred to with the umbrella term Kur.
Apart from small copayments, the German SHI fully covers health spa treatment and medical rehabilitation. However, both require a physician’s prescription, and the indi-vidual has to submit an application for treatment to his or her SHI provider. The role of 1 We need to distinguish two types of employees in the German public sector. First, there are
civil servants with tenure (called Beamte), henceforth called “civil servants.” They are primarily PHI insured as the state reimburses around 50 percent of their health expendiures (Beihilfe) and almost all insure the non-reimbursable expenditures privately. Second, we need to consider employees in the public sector without tenure (called Angestellte im öffentlichen Dienst). They have some privileges, too, but are mostly insured with the SHI (under the same conditions as everyone else). We call them “public servants.”
the patient is the application process is central. On the one hand, well informed patients may push their doctors to write favorable medical opinions, and doctors may comply simply out of the fear of losing patients due to the free choice of medical practitioners among the SHI insured. On the other hand, patients may not accept their doctor’s rec-ommendation to go to a health spa or medical rehabilitation. After the application, the SHI provider determines whether the preconditions for treatment have been fulfilled and authorizes the therapy. The wording of the preconditions can be found in the German social legislation, Social Code Book V (SGB V, article 23 para. 1, article 40 para. 1). In general, approval of spa treatment requires that the patient is suffering a health con-dition that is likely to lead to an illness or disability in the foreseeable future. Hence, health spa therapies have a generally preventive character although the patient already has health problems. Medical rehabilitation, by contrast, implies that an actual illness exists. After authorization by the sickness fund, the prescribed treatment is provided in an approved medical facility under contract by the SHI provider. These medical facilities are usually located in scenic rural villages licensed by the state as Kurorte. For a village to attain such a license, it needs to fulfill several conditions established in state laws: extraordinarily clean air, seaside location, or mineral springs. The idea of providing pa-tients a healthy change of environment is integral to the treatment program, and this is also why such treatments are referred to as “inpatient.”2
The German SHI is one of the few health insurance systems that provides health spa treatments to people in poor health but without any diagnosed illness. This is in sharp contrast to most western health care systems, where visits to health spas are mainly pleasure-oriented and paid completely out-of-pocket. Even medical rehabilitation treatments are not always covered by private or public health insurance in other countries but are subject to the benefit catalog of the German SHI. Thus, it may come as no surprise that the German market for convalescent care is said to be the largest worldwide, at least when the booming wellness industry is not considered. In 1995, a total ofe7.646 billion was spent on convalescent care, accounting for more than 4 percent of all health expenditures in Germany (German Federal Statistical Office, 2008). Almost e6 billion thereof were spent by the SHI and the Statutory Pension Insurance (SPI). Around 1,400 medical facilities with 100,000 full-time (equivalent) staff members treated 1.9 million patients, who stayed 31 days each on average. The majority of these cases were medical rehabilitation. Health spa treatment of individuals in the SHI system suffering poor health, most of whom were retirees or family members of the insured, accounted for 300,000 cases (German Federal Statistical Office, 2008).3
2Nowadays, “outpatient” medical rehabilitation provided in the patient’s city of residence has become
increasingly prevalent. In the mid-90s, however, almost all rehabilitation in Germany was “inpatient,” i.e., provided at a specialized medical facility in a Kurort. “Outpatient” health spa treatment also entails traveling to aKurort, but in this case patients do not stay overnight at the facility but rather in a guesthouse of their own choice.
The German SPI is legally obligated to pay for medical rehabilitation treatments that help to prevent permanent partial or total work disabilities. This is rooted in the basic principle of “rehabilitation before pension” in the German social insurance system. Thus, the SPI provides treatment for patients in gainful employment whose illness is severe enough to threaten their ability to work. We will discuss the importance of this funding principle in detail later on.
The Policy Reforms on Convalescent Care
At the end of 1996, the German government under Chancellor Kohl implemented two health reforms that both affected convalescent care programs. The first is the focus of this study. In West Germany as of January 1, 1997, copayments for inpatient health spa stays and medical rehabilitation therapies were increased from DM 12 (e6.14) per day to DM 25 (e12.78) per day. In East Germany, the copayments were increased from DM 8 (e4.09) to DM 20 (e10.23). This reflects an increase of 108 (150) percent.4 To illustrate
how drastic this copayment increase really was, we multiply the daily copayment rates by the average length of stay according to the Federal Statistical Office (German Federal Statistical Office, 2008). In West Germany, the absolute increase per treatment amounted to around e300, and in East Germany, it was around e290. Before the reform and in relation to the monthly net wages of those who received convalescent care in our sample, the total copayment sum per treatment was 23 percent of the net wage in East Germany and 26 percent in West Germany. After the copayment increase, the total copayment sum per treatment approximately doubled to 50 (East) and 47 (West) percent of the average monthly net wage.
The second law was intended to bring down the sickness absence rates and to prevent moral hazard. The statutory replacement level for sickness spells up to six weeks was reduced from 100 percent to 80 percent of foregone gross wages for employees. As employees are eligible for sick pay during a health spa or medical rehabilitation treatment, this law is believed to affect the demand for convalescent care as well. Moreover, the government allowed employers to deduct two days of paid vacation for every five days that an employee was unable to work due to a convalescent care treatment.5
integrate disabled people into the labor market. However, since this form of rehabilitation was not affected by the reforms, it is outside the scope of this paper. Its overall importance is minor. In 2007, only 68,100 cases were registered. Unemployment insurance (UI) provides the benefits (Rauch et al., 2008).
4 Passed on November 1, 1996 this law is entitledGesetz zur Entlastung der Beiträge in der
geset-zlichen Krankenversicherung (Beitragsentlastungsgesetz - BeitrEntlG), BGBl. I 1996 p. 1631-1633. The time that needs to elapse between two treatment episodes in order for the insured to be eligible again was extended from three to four years, and the regular length of both therapy forms was reduced from four to three weeks. Both changes were only effective conditionally on the non-existence of severe medical reasons for treatment. While the reduction of the regular length of stay is likely of negligible overall importance, we will assess the impact of the shortening of the qualifying period in Section 5.
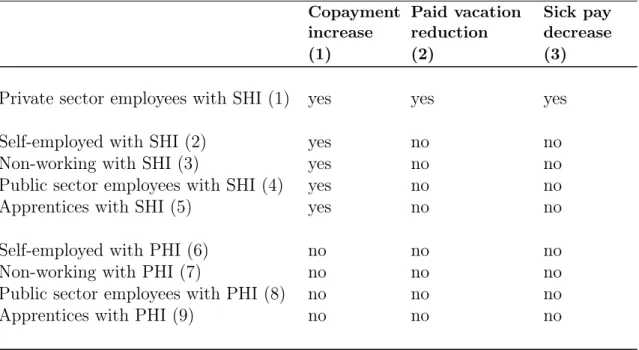
We now identify and define subgroups that were affected differently by the increase in copayments, the cut in statutory sick pay, and the deduction of paid vacation. These subgroups serve as treatment and control groups in the evaluation of this natural exper-iment.
[Insert Table 1 about here]
We see from Table 1 that subgroups (6) to (9) were completely unaffected by all three legislative changes; all these groups are insured under the PHI, which is unaffected by SHI copayment changes. Moreover, self-employed and non-working people are not eligible for paid sick leave. Apprentices and public sector employees were exempted from the cut in sick pay and the reductions in paid vacation, for political reasons. Consequently, these subgroups serve later jointly as control group. We call them Control Group 1.
Subgroups (2) to (5) – SHI insured public sector employees, apprentices, self-employed, and non-working respondents – also were not affected by the cut in sick pay and paid vacation. However, since they were insured under the SHI they were affected by the copayment increase. We use subgroups (2) to (5) to isolate the effect of the increase in copayments from the cut in compensation levels. The effects can be disentangled by comparing them to the SHI insured who work as employees in the private sector (subgroup (1)) since they were affected by all policy changes.
[Insert Table 2 about here]
As Table 2 visualizes, we accordingly define three treatment groups and two control groups. Treatment Group 1 incorporates all respondents who were subject to the co-payment increase, the policy measure of key interest here. Hence Treatment Group 1 consists of all SHI insured, namely the subgroups (1) to (5). As some of these SHI insured were also affected by the cuts in sick pay and paid vacation (subgroup (1)), it is desirable to isolate the different reform effects. We do so by defining Treatment Group 2 as those respondents who were only subject to the copayment increase (subgroups (2) to (5)). In the subsequent sections, to estimate the net effect of all policy changes, we contrast Treatment Group 1 with Control Group 1, i.e., we contrast those who were affected by all reforms with those who were affected by neither. To isolate the impact of the increase in copayments, we contrast Treatment Group 2 – those who were solely affected by the copayment rise – with Control Group 1. Additionally, we contrast Treatment Group 3, which is subgroup (1), with subgroups (2) to (5), to assess the impact of the cut in sick pay and paid vacation on the demand for convalescent care.
Wachstum und Beschäftigung (Arbeitsrechtliches Beschäftigungsförderungsgesetz), BGBl. I 1996 p. 1476-1479. The law became effective on October 1, 1996. It should be noted that we are not able to precisely identify those employees who were actually affected by the cut in statutory sick pay, as employers and unions voluntarily agreed to extend the old sick pay arrangement in some collective wage agreements.
3
Data and Variable Definitions
Dataset
The empirical analysis relies on microdata from the German Socio-Economic Panel Study (SOEP). The SOEP is an annual representative household survey that started in 1984 and sampled more than 20,000 persons in 2006. Wagner et al. (2007) provide further details. Information on convalescent care treatments is only available for two post-reform years. Hence, for the core analyses, we use data on waves 1995 to 1999, which include time-invariant information, current information, and retrospective information about the previous year. As the main dependent variables contain information about the year prior to the interview, we employ data that is related to the years 1994 to 1998.6
We use the whole sample size except for respondents under the age of 18, who are exempted from copayments. Moreover, we have to drop observations with missings on the exogenous or endogenous variables.
Dependent Variables
The SOEP contains various questions about the usage of health services and the health insurance. In total, we generate four dependent variables on the demand for convalescent care programs. Our main dependent variable Rehab measures whether the respondent went to a health spa or underwent an inpatient medical rehabilitation treatment in the previous year: it takes the value one if that was the case, and zero if not. This variable has been generated from the following question that was asked continuously from 1995 to 1999: “Were you admitted to a health spa or inpatient medical rehabilitation facility last year?” In German, this question is even clearer because of the well-known umbrella termKur and the inpatient treatment this entails at a different location, aKurort, which minimizes measurement errors. The fact that we do not know the exact time period of the therapy does not severely hamper the analysis, even more so given that such treatments are usually not carried out over Christmas or New Year’s. Hence, there should be no doubt as to whether the therapy was in 1996 or in 1997.
By combining our main dependent variable with further questions, we generate ad-ditional dependent variables that we employ in refined model specifications. We call the first of the three Rehab due to illness. It takes the value one for respondents who have 6 If the respondent was interviewed in two subsequent waves, e.g., in 1994 and 1995, we match the
time-variant data from the first year dealing with the current (first) year with data from the second year dealing with the first year. For example, in 1995, respondents were asked about their current health status but about their insurance status during the previous year. Hence, we use the 1994 information on health status together with the 1995 data on insurance status if the respondent was interviewed in both years.
a one on their Rehab variable and who claimed that the SPI funded their treatment.7 Since we know that the SPI only funds rehabilitation to prevent people from becoming unable to work, we thus capture only those employees who underwent such treatment.
Two more dependent variables are generated to measure the incidence rate of medical rehabilitation therapies for recovery from work accidents (Rehab due to accident). Re-spondents were asked whether they were admitted to a hospital or whether they received medical treatment because of a work-related accident in the previous year.8 Hence, the
third dependent variable has a one for those employees who had a work-related acci-dent that required a hospital stay and whose Rehab variable takes on the value one. Analogously, a fourth variable with a one for respondents who claimed to have needed medical treatment due to a work-related accident and with a one on theirRehabvariable is generated. In both cases it is very likely that those individuals underwent the med-ical rehabilitation therapy due to the work-related accident. Even small measurement errors would not be an issue as long as the reforms had no significant influence on the measurement errors, which should not be the case. Appendix A displays the summary statistics for all dependent variables.
Control Variables and Treatment Dummies
In our econometric specifications, we make use of various control variables. These control variables capture personal and family-related characteristics such as age, female, immi-grant,partner, orchildren. Moreover, we control for educational characteristics by using data on the highest school degree obtained. An important determinant of the demand for health spa and rehabilitation treatments is the health status of the respondents, which we control for. We also include covariates that measure whether the person was employed full-time, part-time, marginally, or non-employed, and additionally control for the gross income per month. To capture time-invariant regional characteristics, we make use of 15 state dummies. Regional labor market dynamics are controlled for by the inclusion of the annual state unemployment rate. Time trends are captured by year dummies. A list of all covariates, their means and standard deviations can be found in Appendix A. According to Table 2, we define three treatment dummies that mirror whether a person belongs to Treatment Group 1, 2, 3, or to a control group. T1 takes on the value one if the person belongs to Treatment Group 1 and zero if the person is in Control Group 1. T2 also has a zero for those in Control Group 1 and a one for those belonging to Treatment Group 2, whereas T3 takes on the value one when respondents are in 7 The exact SOEP question reads: “Who paid the greater part of the costs? a.) Statutory Pension
Insurance b.) Statutory Health Insurance c.) other organization.” As this question was only asked up to 1998, we cannot employ the 1999 wave in the models where this variable serves as a dependent variable.
8 The exact SOEP question reads: “Were you in the hospital or did you receive medical treatment
last year because of a work-related accident? a.) yes, received medical treatment b.) yes, went to the hospital c.) no”
Treatment Group 3 and zero when they are in Control Group 2. To estimate the causal reform effects, each of these treatment dummies enters the model specification alone and in interaction with a reform year dummy as will be explained in the next subsection.
4
Estimation Strategy
Difference-in-Differences
We would like to measure how the different reform elements affected the decision to go to a health spa or to participate in a medical rehabilitation program. Thinking of the policy intervention as a treatment, we fit a probit model of the form:
P[y= 1|X] = Φ(α+βpost97+γT+δ(post97*T)
| {z }
DiD
+ψ0ζ) (1)
where post97 is a dummy that takes on the value one for post-reform years and zero for pre-reform years. Tis representative for one of our three treatment dummies (see previ-ous subsection). The interaction term between both dummies gives us the difference-in-differences (DiD) estimator. To evaluate how the reform affected our outcome variable, henceforth, we always compute and display the marginal effect of the interaction term
∆Φ(.) ∆(p97*D).
9 Φ(.) is the cumulative distribution function for the standard normal
distrib-ution and ψ0 is a vector including all personal, educational, and job-related controls as well as time dummies, state dummies, and the annual state unemployment rate.
Identification
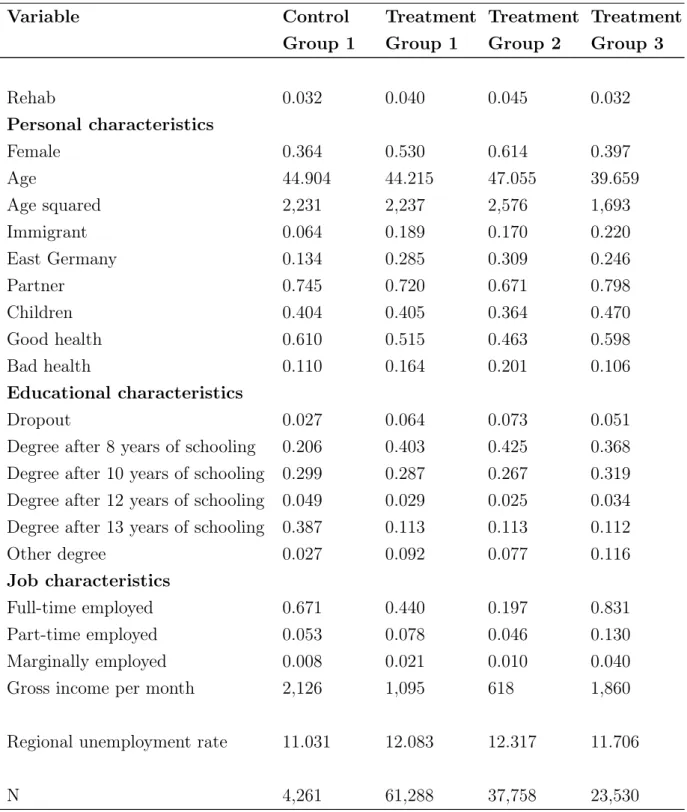
Our main identification strategy relies on DiD estimation and hence on the assumption of a common outcome variable trend for treatment and control groups in the absence of the treatment. This assumption should hold conditional on all available controls. In almost all natural experiments and non-randomized settings, controlling for a rich set of covariates is important since control and treatment groups differ significantly with respect to most of the observed characteristics. This is also true in our case, as Table 3 shows. In comparison to the control group, Treatment Groups 1 and 2 include more females and immigrants, and the employees are less educated. Moreover, the people in the Control Group have the best health, whereas those in Treatment Group 2 have 9Puhani (2008) has shown that the advice of Ai and Norton (2004) to compute the discrete double
difference ∆∆p972Φ(∆.)D is not of relevance in nonlinear models when the interest lies in the estimation of a treatment effect. Using treatment dummies, the average treatment effect on the treated is given by
∆Φ(.)
∆(p97*T) = Φ(α+βpost97+γT+δDiD+ψ
0ζ)−Φ(α+βpost97+γT+ψ0ζ)which is exactly what we
the worst. Treatment Group 3 is younger than the other subgroups and more likely to have a partner and children. As by definition non-working respondents are not included in Treatment Group 3, this group is much more likely to be employed full-time. The heterogeneity of most of the observable characteristics is due to the federal regulations of the German health insurance and hence unavoidable.
[Insert Table 3 about here]
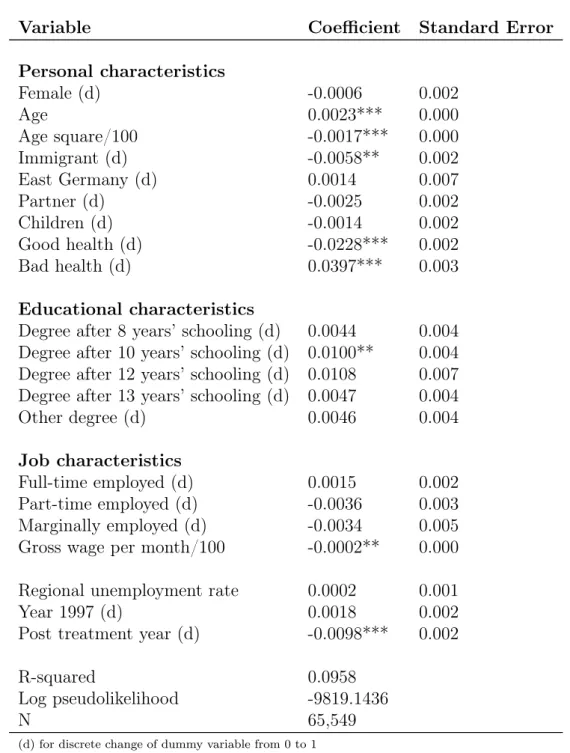
As can be seen from Table 4, the most important driver of the demand for health spa and rehabilitation programs is health status. Not surprisingly, age also plays a role, as well as gross wage. Immigrants are less likely to go to a health spa, probably because of information asymmetries. Note that a clear downward trend in post-treatment years is captured by the post97 dummy.
[Insert Table 4 about here]
Since we are able to control for these characteristics, differences in the variables’ levels
in the different subgroups pose no problem, even if related to the outcome, as long as the differences do not change over time. Put differently, it is important that there are no unobservables that might have produced different dynamics for the treatment and control groups. We argue that this key assumption, which is common to all DiD studies, does hold. Again, we are in the position to adjust the sample composition for various personal, educational, and job-related characteristics of the respondents. We also control for time effects, persistent state differences, and the annual state unemployment rate. Hence, it is difficult to think of unobservables that might have affected the outcomes of treatment and control groups differently. Moreover, we experiment with different time spans and consider panel attrition by using the panel structure of the data. For example, using a balanced panel in addition to an unbalanced panel, we assess the sensitivity of the results. A similar robustness check is performed by weighting the regression with the inverse probability of not dropping out of the sample in post-reform years. Another piece of evidence for the absence of distorting unobservable effects is the nonsignificance of placebo reform estimates for years without a reform. We will make use of these methods later on.
Figure 1 shows the evolution of the outcome variable for the different treatment groups and the controls over time.10 Even without the correction for observables, we observe a distinct parallel evolution for all four groups during the pre-reform years. 10As will be shown later, it is likely that due to the announcement of the reform at the end of 1995,
anticipation effects play a role. Hence, the two uncontaminated pre-reform years 1994 and 1995 are contrasted to the two post-reform years 1997 and 1998.
After the reform implementation, the ratio of controls with convalescent care therapies remained stable, whereas we observe a clear and distinct, but parallel, decrease for all three treatment groups.
[Insert Figure 1 about here]
In recent years, there has been an extensive debate about the drawbacks and limitations of DiD estimation. A particular concern is the underestimation of OLS standard errors due to serial correlation in the case of long time horizons and unobserved (treatment and control) group effects. To deal with the serial correlation issue, we focus on short time horizons. As Bertrand et al. (2004) have shown, the main reason for the understating of standard errors is rooted in serial correlation of the outcome and the intervention variable and is basically eliminated when focusing on less than five periods. While there is consensus about the serial correlation problem, the issue with unobserved common group effects is more of a controversial subject of debate. If one takes the objection of Donald and Lang (2007) seriously, then it would not be possible to draw inferences from DiD analyses in the case of few groups, meaning that no empirical assessment could be performed. We subscribe to the view of Wooldridge (2006) who refers to that as (p. 18):
“DL [Donald and Lang] criticize Card and Krueger (1994) for comparing mean wage changes of fast-food workers across two states because Card and Krueger fail to account for the state effect (New Jersery or Pennsylvania) [...]. But the DL criticism in the G = 2 case is no different from a common question raised for any difference-in-differences analyses: How can we be sure that any observed difference in means is due entirely to the policy change? To characterize the problem as failing to account for an unobserved group effect is not necessarily helpful.”11
Alongside our focus on short time spans to resolve serial correlation concerns, we use robust standard errors and correct for clustering at the individual level throughout the analysis.
A crucial issue in most studies that try to evaluate policy reforms is, besides the absence of a control group, selection into or out of the treatment group. We can cope with concerns about selection since we are in the fortunate position of having a framework in which two almost totally independent health care systems exist side by side, as explained 11 In this very readable extended version of an older published AER paper (Wooldridge, 2003),
Wooldridge (2006) discusses several other shortcomings and assumptions of the estimation approach proposed by Donald and Lang (2007). At another juncture, Wooldridge (2007) asks rhetorically whether introducing more than sampling error into DiD analyses was necessary, or desirable. “Should we con-clude nothing can be learned in such settings?”, he questions (p. 3). Moreover, he uses the well known Meyer et al. (1995) study, which is similar to ours and also obtains marginally significant results, as another example: “It seems that, in this example, there is plenty of uncertainty in estimation, and one cannot obtain a tight estimate without a fairly large sample size. It is unclear what we gain by concluding that, because we are just identifying the parameters, we cannot perform inference in such cases. In this example, it is hard to argue that the uncertainty associated with choosing low earners within the same state and time period as the control group somehow swamps the sampling error in the sample means.” (p. 3 to 4).
in Section 2. On the one hand, this provides a well defined control group. On the other hand, we do not need to fear that reform-induced selection has distorted the results, as there is virtually no switching between the SHI and the PHI, and since all SHI-insured persons are covered by universal health plans. Due to strict German regulations, a switch to the PHI was only legally allowed for a small fraction of optionally SHI insured, and we are able to identify and exclude these cases when running robustness checks.
Individuals insured under the SHI who were for some reason exempted from copay-ments are not identifiable. For example, people whose annual copaycopay-ments for pharma-ceuticals, health care services, or medical devices exceeded a certain percentage of their disposable household income could have applied for a case of hardship.12 However, at
that time, the Association for Health Resort and Rehabilitation Therapy claimed that the exemption clauses were widely unknown to the public and thus we believe that they do not downwardly bias our results severely.
Furthermore, we need to consider the possibility of pull-forward effects. Health spa treatment or rehabilitation is usually planned several months or even years in advance. Certainly, health spa stays are easier to schedule than rehabilitation. Since the first policy reform plans were made public at the end of 1995 (Handelsblatt, 1995), it may be that a significant portion of the SHI insured attended health spa or medical rehabilitation programs in 1996 instead of 1997. We address this issue by including and excluding the year 1996 in the analyses.
To be able to fully attribute changes in the incidence rates to changes in the demand for health spa and medical rehabilitation programs, supply side effects should not play a role in this context. We have not found indications of supply-side constraints. In contrast, there have been reports about the deepest crisis in the market for convalescent care since the end of the Second World War (Handelsblatt, 1998). Dozens of medical facilities and health spas had to close and, hence, there is strong evidence that there was excess of supply. This is also supported by official statistics stating that the utilized bed capacity of all facilities strongly decreased, from 83.2 percent in 1996 to 62.3 percent in 1997 (German Federal Statistical Office, 2008).
Admittedly, it may have been that, due to rising awareness and increased political pressure, the SHI and the PHI were more restrictive in their authorization of therapy programs during the period when the reforms were under political discussion. We address this possibility by excluding 1996 in several model specifications.
One point that may hamper our identification strategy results from the design of the data. As the respondents were not asked directly about the medical reasons for the therapy, we can only indirectly identify specific treatment forms. As described in Section 3, we combine the general question about convalescent care therapy with the 12 The usual threshold is 2 percent of disposable household income; for people with chronic diseases
more specific question about the funder of the therapy. Thanks to the general and clear principle in the German social legislation that the SPI only funds medical rehabilitation treatments that are necessary to prevent work incapacity, we are able to identify this type of therapy. While the identification of this therapy form is well-defined, we need one assumption to identify another specific form of rehabilitation therapy: we plausibly assume that respondents who had a work-related accident requiring medical treatment and were prescribed convalescent care therapy in the same year did in fact receive the therapy due to the accident. In this context, we have to point out that, in our sam-ple, the number of respondents who belong to Control Group 1 and who underwent medical rehabilitation due to a work-related accident is so small that we cannot use this group. Hence, we discard the controls in this sub-specification and rely solely on Treatment Group 1 to obtain a sufficiently large sample size. This before-after estimator relies on the assumption that the demand for this specific treatment remained constant for Control Group 1, which seems to be a reasonable assumption given Figure 1. For both specific forms of treatment – rehabilitation due to illness and rehabilitation due to work-related accidents – the daily copayments increased considerably. Hence, we can accurately attribute post-reform changes in demand to reform-induced exogenous price variations.
Due to various methodological issues, to the best of our knowledge, never before has it been possible to compute an elasticity estimate for preventive care. As health spa treatments can be categorized as a form of preventive care, we make an attempt to compute an elasticity estimate. Unfortunately, we cannot directly identify such treatment forms. However, we know how the total demand for convalescent care reacted to the copayment increase and we know from official data that health spa treatments accounted for 15.13 percent of all convalescent care therapies. Since we also know the fraction of medical rehabilitation treatments and can directly identify and calculate the reform effects for these treatments, we can derive and indirectly calculate price elasticities for health spa stays. More details about the assumptions that lead to the upper and lower bound elasticity estimates can be found in Section 5.
As a last point, we would like to emphasize that our identification strategy relies on different model specifications according to our main outcome measures: convalescent care treatments, rehabilitation treatments due to illness, rehabilitation treatments due to work accidents that required a hospital stay, and rehabilitation treatments due to work accidents that required medical treatment but no hospital stay. Additionally, the first two of these model specifications are estimated by including three different treat-ment dummies representing different subpopulations that were affected differently by the reforms. This setup guarantees the results to be based upon various pillars, with each based on distinct underlying exogenous price variations. Hence, the identification of the reform effects is supported by a broad strategy. By crosschecking, the plausibility and
sensitivity of our results is automatically verified.
5
Results
We have already examined Figure 1 in the previous subsection. It displays the un-conditional incidence rates for convalescent care treatments by treatment and control groups. While the ratio of the treated decreased sharply after the implementation of the policy reforms, it remained fairly stable for the controls. Note that the incidence rates for all three treatment groups developed in a remarkably parallel manner over the whole period, while the incidence rates for treated and controls show a parallel pattern only for the pre-treatment periods. This reinforces the plausibility of the common time trend assumption and points strongly towards causal reform effects. Averaging over the pre- and post-reform years for Treatment Group 1 and Control Group 1 and taking the unconditional double difference yields a raw DiD estimate of about -1.5 percentage points.
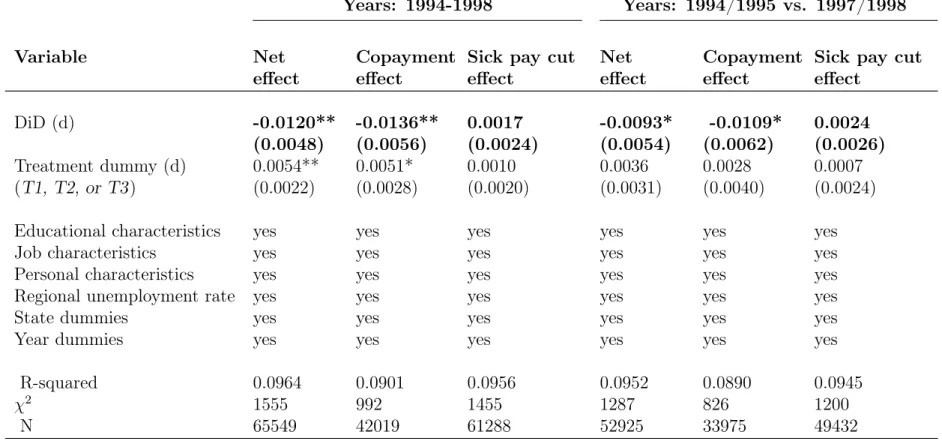
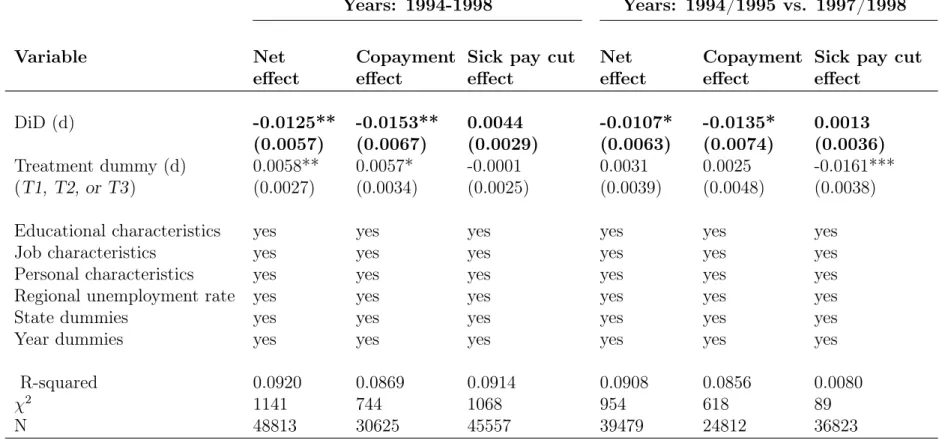
Table 5 shows the regression results when probit models like in equation 1 are es-timated using a pooled sample. Since the coefficient of interest, displayed as DiD, is insensitive to the stepwise inclusion of sets of covariates, we present the full specifica-tions throughout the rest of the section. Marginal effects are always displayed.
[Insert Table 5 about here]
Columns one to three incorporate the years 1994 to 1998, whereas in columns four to six, the pre-treatment year 1996 is omitted due to potential anticipation effects. Column one shows estimation results when we include T1 as treatment dummy and thus contrasts all those who were affected by any reform element with those who were entirely unaffected by the reforms. We find that the reforms led to a significant decrease in the incidence rate of convalescent care treatments by 1.2 percentage points. The absolute decrease is slightly higher (-1.36 percentage points) when we compare SHI insured who were only
exposed to the increase in copayments to the control group (column two). On the other hand, the specification in column three, which compares those who were affected by all policy changes with those who were affected only by the increase in copayments, does not provide evidence that the cut in sick pay and vacation days had any significant additional effect.
Columns four to six reinforce the previous results: the increase in copayments has induced a significant decrease in the incidence rate of health spa and medical rehabilita-tion treatments of about 1 percentage point (column five). However, we find no evidence that the cut in sick pay and paid vacation led to a decrease in either type of treatment (column six).
Interestingly, if we do not consider the year prior to the reform, 1996, the magnitude of the decrease is approximately 0.25 percentage points or around 20 percent lower, which suggests that pull-forward effects may have occurred. When related to the average incidence rates in the pre-treatment periods, the purely copayment-induced percentage point decreases translate into overall decreases by 1.36/5.02 = 27 percent for all years and 1.09/5.18 = 21 percent for the specification without 1996.
To investigate whether a change in the composition of the sample size may have confounded our results, we balance the sample and restrict it to respondents who were successfully interviewed in all years and have valid information on their variables. The residual buildup of Table 6 is the same as in Table 5. The same picture as before appears. We find that the reforms induced a significant decrease of 1.25 percentage points when all those who were exposed to any reform element are compared to Control Group 1 (column one, use of T1). The decrease shrinks about 0.20 percentage points when we do not consider 1996 (-1.07, column four). This is also true when we contrast those who were only affected by the copayment increase to those who were totally unaffected (-1.53 vs. -1.35 percentage points, columns two and five). Again, we find no evidence that the cut in sick pay and the deduction of vacation days had any effect (columns three and six).
[Insert Table 6 about here]
We now estimate how the reforms affected medical rehabilitation programs for working people who without treatment would run the risk of becoming unable to work. The SPI funds these programs, and we have information on who funded the therapy for the years 1994 to 1997. Hence, columns one to three in Table 7 display the regression results when we analyze respondents who indicated that the treatment was paid by the SPI. We find marginally significant but substantially lower effects of -0.26 and -0.21 percentage points when Treatment Groups 1 and 2 are contrasted to Control Group 1 (columns one and two). Again, we find no evidence that cuts in sick pay and paid vacation had any significant effect on top of the copayment-induced decrease (column three).
It should be noted that the power of the statistical tests clearly decreases due to smaller sample sizes for the refined specifications. However, in contrast to column three, the coefficient in column one is significant at the 8 percent level and the one in column two is significant at the 18 percent level. We take this as evidence that it is solely the sample size that caused the p-values to decrease in comparison to Tables 5 and 6.
Since we also have information on whether the employee had a work-related accident in the corresponding year, we now consider people who answered the Rehab and the
Work Accident question with “yes.” By this means, we estimate how the reforms affected medical rehabilitation treatments due to work accidents. Furthermore, we differentiate
whether the work-related accident required a hospital stay or only outpatient medical treatment. This comes at the cost of losing the control group, as too few respondents in these subgroups meet these criteria. As most of the employees with work accidents and rehab stays are in subgroup (1), we use Treatment Group 1 for these specifications. As we have already seen that the results are more or less identical irrespective of whether we use Treatment Group 1 or 2, the focus on Treatment Group 1 should not make a major difference. Discarding the controls and relying on simple before-after comparisons is equivalent to the assumption that the demand for work accident-related rehabilitation treatments remained constant over time. Figure 1 is indicative that this is a realistic assumption.
[Insert Table 7 about here]
Column four of Table 7 gives us a marginally significant coefficient of -0.038 percentage points, and according to column five, the reform induced a significant decrease of -0.07 percentage points. Note that the strength of the decrease is not comparable between the specifications as the average incidence levels differ between the specifications. For example, the overall incidence rate for rehabilitation due to work accidents with hospital stays for Treatment Group 1 and the pre-reform period was 0.148 percent leading to a reform-induced decrease in demand of around 25 percent. Despite the smaller sample size, the estimated reform effects for these specific therapy forms are very plausible and the decreases in percent are remarkably similar to the ones in our main specifications in Table 5.
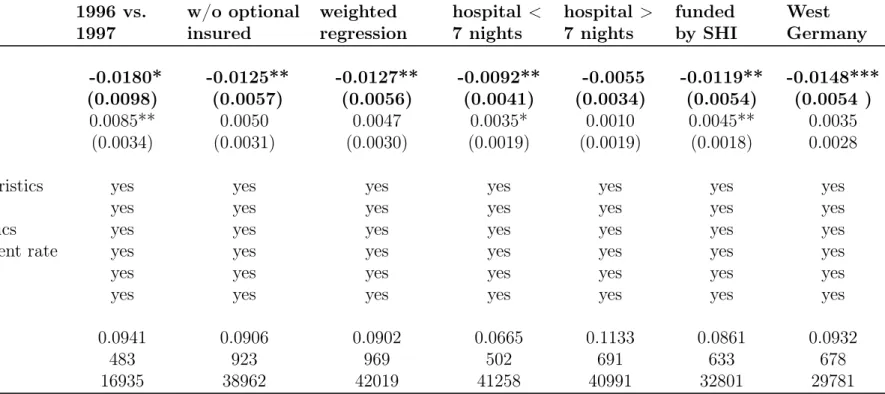
In Table 8, we present additional model specifications to prove the consistency and robustness of our results. Therefore, we limit the analysis to the comparison of Treatment Group 2 with Control Group 1, e.g., we always estimate the “pure” copayment effect. Column one gives the estimation result when the period under consideration is shortened to two years and thus represents the short-run impact of the reform, anticipation effects included. Consequently, the reform effect is higher and -1.8 percentage points.
To definitely exclude the possibility that selection into or out of the treatment dis-torted our results, we drop the only group that had the option to change the health insurance system, namely that of optionally insured people. We see that the estimates almost perfectly fit our basic results as the reform effect of the copayment increase is estimated to be -1.25 percentage points.
In addition to the balanced estimates, we show that panel attrition is of no issue in column three, which weights the same regression as in column two of Table 5 with the inverse probability of not dropping out of the sample in the post-reform period. The point estimate is highly significant and of the same magnitude as before (-1.27 percentage points). In this context, it is worth mentioning that, conditional on all other covariates,
convalescent care treatments are not significantly related to the probability of dropping out of the sample in the post-reform period (Coef.: 0.010, Std. Err.: 0.044).
We also try to differentiate by severity of illness by dropping respondents who spent either more or less than seven nights in the hospital during the year of their rehabilitation treatment (columns four and five). We find that the percentage point decrease is almost twice as large for those who stayed in the hospital less than one week (-0.92** vs. -0.55 percentage points [p-value: 0.1125]).
Although we cannot identify which specific convalescent care programs were funded by the SHI, we find a plausible 1.19 percentage point decrease (base incidence level: 2.9 percent) for these programs. Finally, restricting the sample to West Germans leads to a highly significant 1.48 percentage point reform-induced decline. All in all, these robustness checks are notable insofar as every one of these specifications fits our main results and is in line with the literature.
[Insert Table 8 about here]
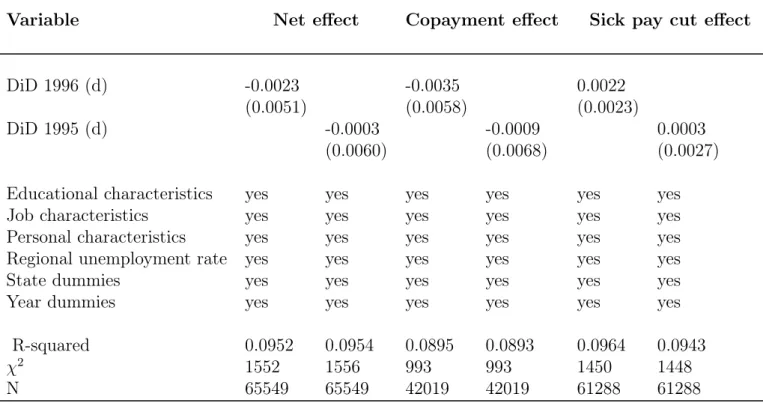
As a final check to ultimately corroborate the common time trend assumption, we present placebo estimates for the years 1995 and 1996. That is, we pretend as if the reform had become effective in 1995 or 1996. If any significant reform effects arose, the assumption of a common time trend for treatment and control group in the absence of the treatment would be seriously challenged. However, as Table 9 demonstrates, this is not the case.
[Insert Table 9 about here]
Price Elasticities of the Demand for Convalescent Care
Using the estimates from the previous subsection, we calculate arc price elasticities of demand for various convalescent care programs according to
εq,p =
(q1−q0)/q¯
(p1−p0)/p¯
(2) whereq1 represents the incidence rate of the program for post-reform years andp0 stands for the pre-reform copayment rate. q¯and p¯are average values over all years.
To compute the overall change in demand, we rely on the estimates for the pure copayment effect in Tables 5 and 7. The numerator of the elasticity formula is obtained by plugging in the estimated percentage point decrease in demand and relating it to the average incidence level over all years. For example, for the most general specification
with all years in Table 5, we would obtain a copayment-induced demand decrease of 1.36
4.48 ∗100 = 30.36percent.
Concerning the denominator, we calculate the change in daily prices as (25+12)(25−12)/2 = +70.27 percent in West and (20+8)(20−8)/2 = +85.71 percent in East Germany and consider by simple weighting that 18.8 percent of all treatments were received by East Ger-mans between 1994 and 1998 (German Statutory Pension Insurance, 2008). Moreover, when computing the overall elasticities, we take into account that 8.14 percent of all convalescent care programs were outpatient health spa programs, which were not af-fected by the copayment increase. For example, the overall elasticity for convalescent care programs using estimates for the years 1994 to 1998 is computed according to
εq,p= 0.919∗(0.812∗70−30.27+0.36 .188∗85.71) =−0.45.
Another, so far neglected, reform element is likely to have partially driven the decrease in the incidence rates. Given the lack of compelling medical arguments against it, the period of eligibility for cost coverage between two treatments was raised from three to four years over the course of the reforms. This change applied to all forms of convalescent care programs. Under the assumption that a fraction of insured people are well-informed and take advantage of the possibility to receive treatment on a regular basis, we would overestimate the copayment-induced decrease in demand and thereby the elasticities.
The data reveal that, indeed, around 20 percent of the average users of these treat-ment programs are regularly prescribed treattreat-ment according to the legally defined min-imum time intervals. For example, an SHI insured who was prescribed treatment in 1990 is not eligible again for another treatment until at least three years had passed, unless a necessary medical reason arises. Taking all SHI insured, i.e., subgroups (1) to (5) in Table 1, 17.8 percent of those who were prescribed a convalescent care treatment in 1990 underwent such a therapy again in 1993 or 1994 but neither during the quali-fying period after the first treatment nor during the qualiquali-fying period after the second treatment.13 This number is confirmed if we take those who were in treatment in 1991
and again in 1994 or 1995 without having been in therapy in between. In total, 17.8 and 16.9 percent of those who were in therapy in 1990 and 1991, respectively, underwent treatment again after approximately three years. This also means that their illness was not severe enough for a freely chosen physician to certify that urgent medical reasons would justify another treatment before the end of the waiting period. Hence, we take these numbers as evidence that around 20 percent of all administered convalescent care treatments are received by patients who know their rights very well and who participate in convalescent care programs on a regular basis. Note that the suspicion of a significant degree of moral hazard in the convalescent care market was one central argument for doubling the copayments; ex-ante, experts estimated that around a quarter of all treat-13We do not have data for the year 1992. To obtain the numbers, we condition on those respondents
ments were unnecessary (Schmitz, 1996; Sauga, 1996). Also remember that according to our estimates, around 20 percent of the overall decrease in demand is attributable to pull-forward effects. These numbers fit quite nicely to the estimated proportion of well-informed regular convalescent care program users. This group is likely to be responsible for the bulk of the anticipation effect and the large degree of moral hazard in the market. The plausibility and complementarity of these numbers are additional pieces of evidence for the consistency of our estimation and identification strategy.
Given that we have information about two post-reform years, the prolongation of the qualifying period prevented one year-fraction of well informed people from attending therapy in these two post-reform years. Hence, when calculating the copayment-induced demand decrease, we subtract 10 percent of the average incidence rate from the estimated percentage point decrease. In the example above, this would mean that the numerator would be −1.36+04.48.1∗4.48 =−20.36percent leading to an elasticity of -0.30 instead of -0.45. However, to account for measurement inaccuracy and to establish our estimates on a broad basis, we always display both values, which could be interpreted as upper and lower elasticity bounds.
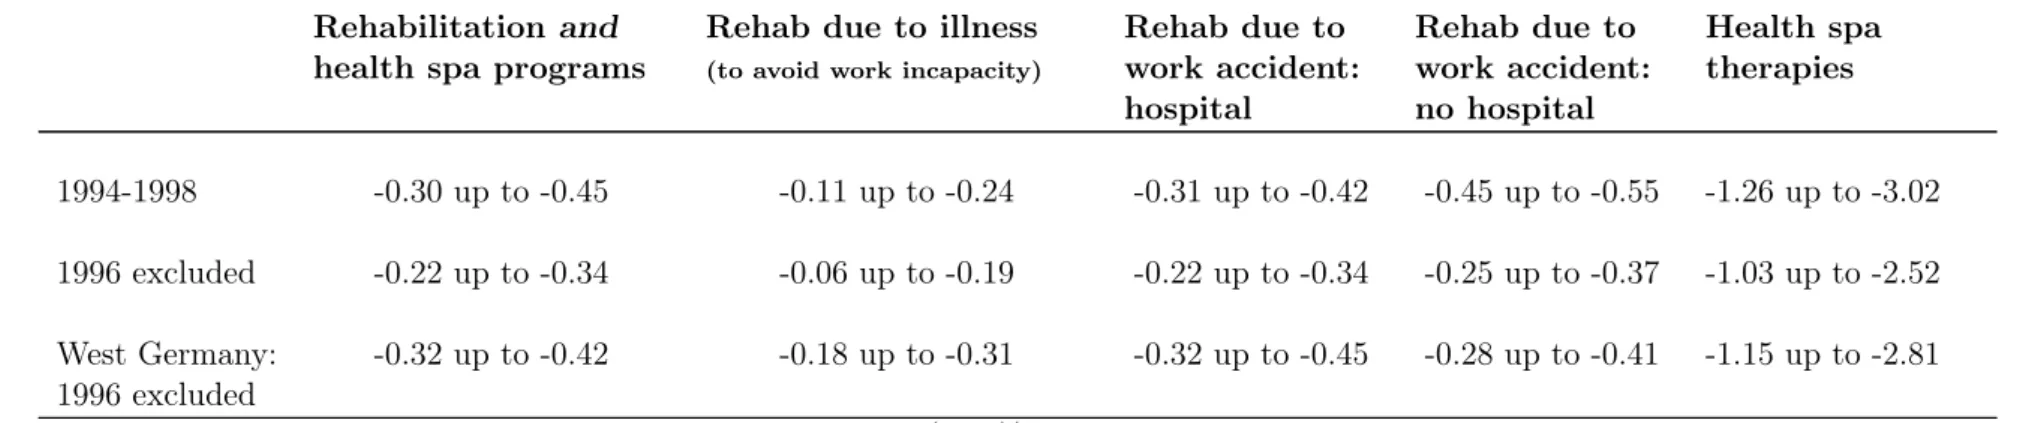
Table 10 emerges. We differentiate between estimates where all years from 1994 to 1998 are considered and estimates without the year 1996 to make allowance for pull-forward effects. Additionally, row three shows estimates for West Germany that might be more precise as we do not have to weight the price increases according to the overall East/West incidence rate of convalescent care programs. Another argument for separate West elasticities would be that East Germans might have reacted differently to the reforms only seven years after reunification. On the other hand, the precision of the estimates decreases due to a smaller sample size.
Column one shows the overall price elasticities for all convalescent care programs; the calculations are based on the estimates in Table 5 (columns one and four). We estimate the overall price elasticity to lie between -0.30 and -0.45 for the years 1994 to 1998 and -0.22 and -0.34 without considering 1996. For West Germany without 1996, the bounds are -0.32 and -0.42. Column two shows substantially lower estimates for rehabilitation treatments due to illnesses that threaten the employees’ work capacity. The price elasticity is around -0.15 for this type of therapy (-0.25 for West Germany).14 Medical rehabilitation programs that were prescribed to recover from a work-related accident and required a hospital stay are calculated to lie between -0.22 and -0.34 for all of Germany as well as -0.32 and -0.45 for West Germany (without 1996). If the work accident led to medical treatment but no hospital stay, the elasticity is around -0.30.
All elasticities are of a reasonable and overlapping range and show the same general 14 Due to space limitations, in the previous subsection, we have not presented estimates for medical
rehabilitation due to illness and work accidents without considering 1996. These estimates, which are used to calculate some of the presented elasticities as well as the detailed estimates for West Germany, are available from the authors.
pattern. We always find that the computed elasticities without considering 1996 are lower, which implies strong evidence for anticipation effects. Moreover, the estimated elasticities for West Germany are of the same range as the overall elasticities but are a little bit larger throughout all specifications.
[Insert Table 10 about here]
As already mentioned in Section 4, we can only indirectly calculate the price elastici-ties for health spa programs and need to make further assumptions. Hence, we present broad upper and lower bound estimates which we obtain under the following assump-tions. First, it is implicitly assumed that we can perfectly identify and calculate the copayment-induced decrease in demand for rehabilitation treatments. This is, however, not the case as we can only identify rehabilitation treatments that are funded by the SPI and aim at preventing work incapacity. Beside these programs, there also exist re-habilitation therapies that are funded by the SHI for recovery from less severe illnesses or accidents. The SHI also funds rehabilitation programs for retirees. Second, as we can-not directly identify the demand for health spa programs, we are unable to directly test whether the cut in sick pay and paid vacation affected the demand for health spa thera-pies. However, we solely consider estimates for Treatment Group 2, i.e., those who were only affected by the cut in copayments, to indirectly calculate the elasticities for health spa programs. Third, we rely our calculations on data from the German Federal Statis-tical Office (2008) stating that between 1994 and 1998, health spa programs accounted for 15.13 percent of all convalescent care programs. Outpatient health spa programs, for which no copayments were raised, made up 8.14 percent. Back-of-the-envelope calcula-tions under consideration of the decrease in total demand for convalescent care and the decrease in demand for rehabilitation programs to prevent work incapacities result in a reform-induced decrease in total demand for health spa programs of 67.9 percent. If we fully attribute this decrease in demand to the copayment increase for inpatient health spa programs which made up 46.2 percent of all health spa programs (German Federal Statistical Office, 2008), we end up with an overall elasticity of about -2.5. For the rea-sons mentioned above and given the wide lack of knowledge that can be assumed among the insured, this should be regarded as an upper bound estimate. The German media tended to give the impression that the increase in copayments affected all types of Kur
and did not explain that outpatient health spa treatment was not affected. Hence, we compute a lower bound elasticity for health spa treatments, attributing the total decrease in health spa demand to all health spa programs, ending up with an estimate of around -1. Hence, it is reasonable to conclude that in contrast to rehabilitation programs, the price elasticity for health spa therapies, which can be classified as preventive health care, is elastic.
6
Discussion
In the previous sections, we have shown by means of various model specifications and robustness checks that the German health reforms of 1996 decreased the demand for health spa and medical rehabilitation programs by around one percentage point through-out Germany. This corresponds to an overall decrease in demand of approximately 20 percent.
It should be kept in mind that we estimate the average treatment effect on the treated in each specification, i.e., the reform effects for the subsample under consider-ation. Hence, the external validity of our results might be questioned. However, our sample is representative of the German population. Table 1 and 2 show that Treatment Groups 1 and 2 consist of subgroups that are each representative for Germany. The subgroups may differ and each may be made up of a relatively homogenous popula-tion group, but note that self-employed, public sector employees, apprentices, and the non-working population are included in the control group as well as in both treatment groups. The only population group that is not considered at all is underage respondents and private-sector PHI insured people, the latter representing less than five percent of the German population. In light of this and the fact that the estimates are amazingly robust to various model specifications, we believe that our results are representative and generalizable for Germany, the third largest economy in the world and the most populous country in Europe.
At first sight, it may be surprising that the increase in copayments had such a large effect and that we have not found evidence of an impact of the cut in sick pay and the new possibility for an employer to deduct two days of paid vacation for every five days of treatment. We have several explanations for this. First, according to union leaders, around half of the German workforce was de facto not affected by the laws that stipulated the sick pay decrease based on collective wage agreements between employers and unions. We are not able to identify employees who were subject to such wage agreements. However, even if only half of the respondents were affected, one would expect to measure an effect. This may not be the case given that, second, the tightening of the conditions did not necessarily pose a limitation on most eligible persons. It could have been irrelevant since the majority may have faced a decision between going to rehabilitation or simply staying home to recover from the illness or accident. In any case, the patient would have been on sick leave. If necessary, physicians usually recommend inpatient treatment, but if patients prefer to stay at home on sick leave, their wishes are usually respected. Third, the cut in sick pay or in vacation days may also not have been a binding constraint as many employees take all or part of their paid vacation to go to a health spa or to rehabilitation in any case. Although entitled to take paid leavein addition to their paid vacation, many employees fear negative job consequences,
especially when unemployment rates are high. The only population groups that are either autonomous or in a secure job are self-employed and public sector workers, both of whom are not in Treatment Group 3, which is used to estimate the effect. Finally, the only group that was affected only by the cut in sick pay was the group of PHI-insured private sector employees. We defined them as Treatment Group 4 and contrasted them to Control Group 1 by estimating the same econometric specifications as for the other treatment groups.15 We were unable to find any significant reform effects, which confirms
on the one hand our previous results. On the other hand, this may be due to the small sample size since Treatment Group 4 is made up of only about 140 observations per year. Although measurement errors might have slightly biased our results, all our esti-mates are in line with the previous literature (Zweifel and Manning, 2000). Despite the usage of different model specifications and different subgroups to derive these ef-fects, the calculated elasticities are remarkably similar, which strengthens the credibility and identification of the reform effects. In all our specifications, we consistently found that pull-forward effects were of importance. Moreover, these anticipation effects are of the same size throughout all models and fit the estimated fraction of well-informed SHI-insured people who take regular advantage of the legal possibilities for receiving convalescent care.
Although we have only indirectly calculated them under a few assumptions, we are the first to present elasticity estimates for preventive care. While the offered computation range is broad, it is narrow enough to state that the price elasticity for health spa treatments is very likely to be elastic, which is again in line with the literature (Ringel et al., 2002).
All in all, our setup produces various price elasticity estimates that all stem from distinct exogenous price variations of a single cost-sharing parameter without having the issue of treatment-related selection. The crosschecking of our results by means of four different outcome measures, combined with different treatment and control groups and various robustness checks, produces notably robust and plausible price elasticity estimates. Hence, we are confident of having obtained, for the first time, reliable price elasticity estimates for convalescent care treatments.
What has been reduced: moral hazard or necessary preventive
care?
Before the reforms became effective, experts claimed that around a quarter of all health spa and rehabilitation treatments were unnecessary (Schmitz, 1996; Sauga, 1996). Moral hazard was one central argument for politicians to increase the copayments.