Using Sequential Observations to
Model and Predict Player Behavior
Brent Harrison
North Carolina State University Raleigh, NC 27695-8206
[email protected]
David L. Roberts
North Carolina State UniversityRaleigh, NC 27606
[email protected]
ABSTRACT
In this paper, we present a data-driven technique for design-ing models of user behavior. Previously, player models were designed using user surveys, small-scale observation experi-ments, or knowledge engineering. These methods generally produced semantically meaningful models that were limited in their applicability. To address this, we have developed a purely data-driven methodology for generating player mod-els based on past observations of other players. Our un-derlying assumption is that we can accurately predict what a player will do in a given situation if we examine enough data from former players that were in similar situations. We have chosen to test our method on achievement data from the MMORPG World of Warcraft. Experiments show that our method greatly outperforms a baseline algorithm in both precision and recall, proving that this method can create ac-curate player models based solely on observation data.
Categories and Subject Descriptors
I.2.6 [Artificial Intelligence]: Learning; I.2.1 [Artificial
Intelligence]: Applications and Expert Systems—Games
General Terms
Model Development
Keywords
Artificial Intelligence, Design
1.
INTRODUCTION
The ability to determine how players will respond to situa-tions in game can be invaluable information both to game designers and to AI management systems trying to tailor games to players’ preferences; however, predictive models of player behavior in video games is an open research topic that is receiving increasing attention in the literature. In the past, researchers have created these models using survey data or personal interviews; however these techniques can be
time-consuming to execute and result in models with limited generalizability (i.e., pertinent only to a single game). The ability to accurately predict a player’s behavior in a game has a number of applications. While these applica-tions are beyond the scope of this paper, we discuss two of them briefly here to better situate and motivate our ap-proach. With a model of player behavior, we can create an experience that is unique to a user’s tendencies or prefer-ences. For example, if we predict that the user will choose to fight a certain non-player character (NPC) rather than talk to it, that NPC can be made more willing to fight. Another application involves guiding players to parts of games
that they may enjoy. Modern games often take place in
large, sandbox worlds where the player is given total free-dom. It’s quite possible that players may never see content that they would like because the sandbox is just so big. Pre-dictions about a player’s behavior can be used to guide her to the parts of the game that she would enjoy.
Existing techniques for creating player models typically rely on surveys or questionnaires. This method for creating player models is intuitive; however, there are several issues that may arise. First, the models created using these techniques are limited to the aspects of player behavior covered in the survey. In order to record more information about players, a more comprehensive set of questions would have to be used. Another limitation of using surveys is that there is often not enough data to create an accurate model. Typically, survey response rates are very low, which means that data gathered from these responses is likely to be noisy. Also, it is difficult to update or adapt the model as players progresses through games. Also, it has been shown that players often have diffi-culty reporting their own habits. Self-reports have a low cor-relation with actual behavior tendencies [5]. Also, surveys suffer from the “social desirability bias” which means that players are more likely to answer questions according to how they feel the questioner wants them to answer, rather than truthfully. Creating behavior models by monitoring players’ in-game behaviors will ease these difficulties by eliminating the biases associated with surveys.
Other approaches to creating player models have involved
a degree of knowledge engineering. Typically some prior
knowledge about what type of player prefers certain actions must be gathered and applied to the actions available in a game. For example, a sneaky player will choose to avoid
guards while an aggressive player would rather fight them. This is a simple example and the association of actions to a player type is relatively clear; however, having to determine which actions correspond to which type of player can be an arduous undertaking in the general case. Another inherent drawback of the knowledge engineering approach is that the player types are hard coded into the model before observa-tion. Since it is the author of the game who decides on which actions are grouped together, it is possible that players can not be described by any predefined category. Creating these player models through observation without knowledge engi-neering is one method to side-step these difficulties. We feel that a purely data-driven approach has significant promise for creating accurate predictive models of player behavior in games without the difficulties associated with earlier modeling techniques. Very little research has been done in this area to date.
As players of different types progress through a game, they are likely to trend towards different types of content. If we assume that similar types of players will select the same ac-tions in a given situation we can use observaac-tions of former players as a basis for a model of future player behavior or enjoyment. By observing the actions a player takes as they progress through the game, we can compare these to the ac-tions that previous players have made in similar situaac-tions and then predict what the current player will do or enjoy. Here, when we refer to player actions, we are primarily con-cerned with evidence of the game content players experi-ence. For example, completing a particular set of quests in an MMORPG is an example of an “action” of interest for building our models. Lower level actions such as running and jumping, however, are not of interest for building our models. In other words, the level of action we are concerned with is when a significant game event is caused by the player (either by atomic actions or through a sequence of actions) and can be interpreted as an attribute, or indicator, of the game content the player experiences.
Using a data-driven approach to player modeling, one would only need to observe the actions that a player takes in order to construct the overall model of player behavior. Since our approach is dependent solely on observing the actions that a user takes, we only need an ordered list of the attributes that characterize a user’s experience as she progresses through the game. One of the main benefits of this data-driven ap-proach is we are agnostic to player type and therefore do not rely on a semantically meaningful description of players’ behaviors as input—our method does not rely on any prior knowledge about player types and has the power to learn these tendencies based only on observation.
There are two potential issues with purely data-driven ap-proaches. First, the statistical techniques used to construct data-driven models do not afford a semantically meaning-ful interpretation of outputs. For example, in survey-based models, players are often grouped into categories such as “ex-plorer” or “achiever”, both of which are human-interpretable. In contrast, the output of a statistical technique is a set of numbers indicating similarity to other players. While we may be able to cluster players together using these num-bers, we can not easily understand the behaviors that make
the members of a cluster similar. We do not view this as a limitation of our approach. Provided a predication that is useful in realizing a tailored game experience for players can be made, an inability to describe the qualities of play-ers’ behaviors is not a concern. The second potential issue with a purely data-driven approach is that of algorithmic
efficiency. Especially in cases of games with large player
populations, the volume of data collected can easily over-whelm the capabilities of game consoles or PCs. The tech-nique we describe below is designed to overcome this issue by breaking construction of models and making predictions into two, asynchronous, phases. This allows a model to be constructed offline where efficiency isn’t as large a concern, and predictions to be made efficiently online where delays can affect players. Below we will present results validating our technique’s ability to handle large volumes of data.
2.
RELATED WORK
One of the earliest attempts to build models of human be-havior for computer games came in 1996 when Richard Bar-tle [1] created his four player types (Achievers, Socializ-ers, ExplorSocializ-ers, and Killers) by observing player responses to what their favorite parts of a multi-user dungeon (MUD) were. These models were based entirely on observational data gathered from the message board associated with the MUD in question. In 2006, Nick Yee [16] empirically tested Bartle’s player models by creating a survey based off of these
player models. This survey was given to 3,000 players and
then used in aprinciple components analysis(PCA) to group
the answers. A PCA is an orthogonal transformation of a set of (possibly correlated) variables into a set of uncorrelated variables that account for as much of the variance in the original variables as possible. This technique allowed for the players to be grouped along dimensions that maximally ex-plain their differences. Three overall player types emerged:
those concerned withachievement, those concerned with
so-cializing, and those concerned with gameimmersion.
As more research was done in this area, researchers be-gan to incorporate data-driven techniques into their
sur-vey methodologies. Lankveld et al. [15] create a union of
survey-based and data-driven models by directly
translat-ing a player behavior survey into a game setttranslat-ing. They
used observations of the player as answers to questions that would have been on a survey and then built a player model
based on those observations. Sharmaet al.[10, 11] also
cre-ated a hybrid methodology by combining game traces along with player survey data in order to create player models. In their method, the model creation module monitors players’ progress through the game and tries to match their progress with a game trace from an accumulated library of traces. This was then used as an estimate of how enjoyable the cur-rent player would find the game.
In the PaSSAGE system, Thue et al.[13, 14] describe
an-other approach to player modeling where actions are anno-tated according to the player type likely to perform them. For example, an aggressive player is likely to fight if given the choice. As a player moves through the game, the collec-tion of their accollec-tions and the annotacollec-tions combine to inform a model. The player types were modeled after those from Laws’ guide for pen-and-paper role-playing games [7]. To our knowledge, no evaluation of their system has determined
if players in virtual worlds can be modeled by types identi-fied in pen-and-paper games. Further, this approach heavily relies on knowledge engineering annotations to relate game events to modeled player types. Another approach by Ryan Houlette [6] involves creating a hierarchy with low-level user
actions (such as “use smoke bomb”) as leaves in a tree and
user traits (such as being “stealthy”) as parent nodes in the tree. As the player completes low-level actions, information about that player’s style is updated according to the tree’s internal nodes. This approach also requires of knowledge engineering in creating the tree.
Some researchers have chosen to create player models that
focus on a single aspect of a game (e.g. time). In Brian
Magerko and John Laird’s interactive drama architecture (IDA) [9], player modeling is done with respect to the goals
that the story has laid out. The player models are only
able to determine if a player will advance to the next plot point within a given amount of time; however, it ignores valuable data from other players because it only uses the
current player’s past performance as input. Shimet al.[12]
created models of player behavior for Everquest II1 using
techniques from home run prediction. Their model is created by examining the leveling speed of a character in the past in order to predict how long it will take to level in the future. All of these methods have been based on small-scale data col-lection experiments or were based on knowledge engineering.
Drachen et al.[4] created player models for Tomb Raider:
Underworld2 by examining various statistics gathered from
1365 players such as cause of death or the number of times that a player requested help in game. Their method uses emergent self-organizing maps (ESOMs) to cluster the data. It is important to note that the statistics gathered from play-ers were high-level descriptions of play and could not be used to predict individual actions. In contrast to our approach, the statistics used in their technique were selected specifi-cally to enable qualitative descriptions of player types, and therefore limited the generalizability of their models to only the game they collected data for.
Lastly, our approach to player modeling can be viewed as similar to plan or goal recognition. Plan/goal recognition is a closely related problem in which sequences of actions are used to predict the most likely goal those actions are try-ing to achieve. The input to a plan recognition algorithm is an ordered set of observations, and the output is a set of goals that explain the observed actions. Often, generally the minimum set of goals that explain a series of actions is pre-ferred because it is more likely that a small set of goals can explain a set of actions than a large one [2]. Plan recognition techniques could also be used to predict player behavior. If we can determine players’ goals, then we can predict that they will finish the steps in plans to complete those goals. The main difference between our problem and plan recogni-tion is that we are predicting behavior directly rather than predicting goals and using those goals to predict behaviors. Further, we do not assume that players are pursuing goals, or that their actions are indicative of goal-oriented behav-ior. We are not suggesting that our approach is better or
1http://www.everquest2.com/
2
http://www.tombraider.com/
Phase 1 Achievement
Training Set Phase 2 Achievement Prediction Achievement
Test Set Cliques
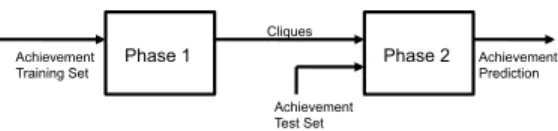
Figure 1: Flowchart for Algorithm Execution. During Phase 1, our algorithm takes in a dataset of the ordered actions that characters have completed and uses them to create a set of cliques containing actions that users complete together. Phase 2 uses the cliques created in Phase 1 to predict the actions that a new user will take.
worse than the approaches taken in plan recognition. We are simply answering a different question.
3.
METHODS
We designed an algorithm that uses a player’s past behav-ior to make a predication about what they will do in the future. This algorithm operates by examining what players who exhibited similar behavior in the past have done. Based on this information, our algorithm determines actions that the current player is likely to perform. In future work, these predictions can be used to make recommendations to players in an effort to customize their game experience.
Our approach is to use data collected from earlier game-play traces to build a model and then use that model for prediction. The data we are interested in is sequential in nature, but not necessarily time stamped. In other words, we are interested in the order in which players perform ac-tions, but not the elapsed time between actions. From these sequences of actions, we build up a representation of com-mon co-occurrences of actions. For example, two actions that are both in the intersection of a majority of players’ ac-tion sequences will be included. Because those two acac-tions commonly co-occur, observing one will help predict more ac-curately that a player will eventually go on to perform the other. We use creative techniques to sift through large data sets and identify these co-occurrence relationships to lever-age this insight. Later in this paper we will present data indicating this process can reduce the model size by one or two orders of magnitude, making inference and predication far more efficient. Further, by selecting away irrelevant or low-confidence data, we can further increase the predictive accuracy of our model. Here we will describe the various techniques we use to build our model.
As depicted in Figure 1, our algorithm uses previous
play-ers’ action histories to create cliques of actionsthat tend
to occur together. These cliques are used to calculate the probability that a new player will complete (or at least want to complete) the composite actions in the clique, given they have completed at least one. There are two phases of execu-tion in our algorithm. The clique construcexecu-tion phase (Phase 1) is composed of two steps: action network construction and clique finding. The second phase consists of an itera-tive probability update as a player completes actions. The product of the first phase is groups of actions that are often completed together. These groups of actions are then used as the basis for the second phase. During the second phase, a player’s action progress is monitored and used to deter-mine the probability that they will complete other, related
Phase 1 Achievement Training Set 1) Calculate pairwise correlation Complete Network 2) Downselect Network Downselected Network
3) Find Maximal Cliques
Downselected Cliques
4) Downselect Cliques List of All Cliques
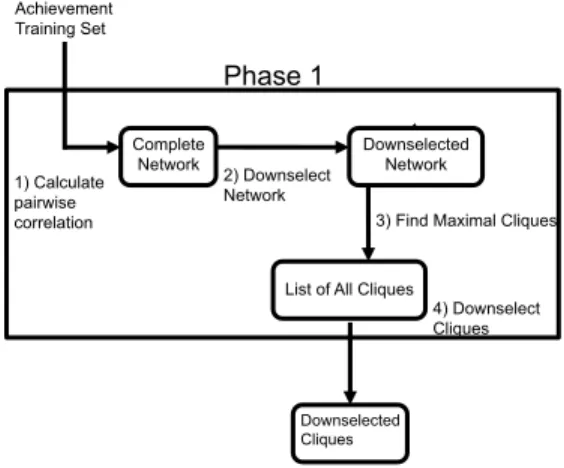
Figure 2: Phase 1 of the Algorithm. Our algorithm cre-ates a complete correlation network between actions and then downselects edges with low correlation. Maximal cliques are then extracted from this network and downs-elected to keep only those which contain actions that are completed together. These cliques are used during Phase 2 of the algorithm.
actions. It is important to note that the first phase, which is more computationally expensive than the second phase, only needs to be performed when a large amount of data has been added to the training set.
3.1
Phase 1
During the first phase of the algorithm, the training set of
players’ actions is used to create a set of cliques. These
cliques are then used during phase 2 of the algorithm to determine the probability that a player completes the ac-tions in a clique given his past acac-tions. Figure 2 depicts a high-level overview of phase one of the algorithm.
3.1.1
Action Network Construction
The first step in our algorithm is to create an underlying model of how frequently actions occur together. We rep-resent this relationship as a correlation network in which the nodes of the network correspond to actions, and edges
between nodes indicate that there exists a positive linear
correlationbetween the edge’s two endpoints. Therefore, an
edge between two nodes indicates that players who perform the action associated with one of the endpoints, tend to also perform the action associated with the other endpoint. As indicated in step one of Figure 2, we first create the complete correlation network by examining the action fre-quencies in our training set. The correlation network is con-structed using pairwise Pearson correlations between every achievement in our dataset. The result of this process is a complete, weighted network in which weights between two nodes correspond to the correlation coefficient between those two actions. An example of a complete correlation network can be seen in Figure 3. This initial network is then fur-ther refined by examining the correlation values themselves. Note that the correlation coefficient measures if the two ac-tions have a linear correlation between them. Values close to 1 mean that there is a high positive correlation, indicat-ing that as one action occurs more frequently, the other will
Achievement 3 Achievement 1 Achievement 2 Achievement 4 0.7 -0.3 0.01 0.2 -0.02 0.5 0.7 -0.3 0.01 0.2 0.5
Figure 3: An Example Correlation Network. Each node in the network corresponds to an action in the dataset and edges between nodes are weighted with correlation values between actions.
tend to occur more frequently as well. Values close to −1
mean that there is a high negative correlation, indicated that as one action occurs more frequently, the other will tend to occur less frequently. Values close to 0 indicate that the oc-currence of one action does not indicate anything about the occurrence of the other action.
Due to the nature of the prediction task, we are not in-terested in correlations that are either negative or close to zero—we seek highly positively correlated actions. To iden-tify highly positively correlated actions we used a threshold set to two standard deviations above the mean correlation
value, but could be any value between−1 and 1. Any edges
with weight below the threshold are discarded. Once low-correlation edges are removed from the network, the weights can be ignored. This is done in order to ensure that edges only exist between actions that players are likely to both complete. An example of this process can be seen in Fig-ure 4. In the figFig-ure, network 1 shows a complete, weighted network containing 4 actions with each edge weighted by correlation coefficients. Suppose the threshold value is 0.1 and that all edges with a lesser weight should be discarded. These edges are depicted in the figure with a dashed line. The second network in the figure shows the result after all edges falling below that threshold have been removed. We found that using a correlation network has several
advan-tages over more complicated network representations (e.g.
Bayesian Networks). We are almost entirely concerned with the structure of the action network. Constructing a corre-lation network involves computing a complete network and then pruning edges to find the structure. There is no search involved in this process. On the other hand, finding the Bayesian network structure that best describes the data re-quires extensive search. This can be a very costly process because the number of network structures grows exponen-tially with the number of data attributes. The data we get from most modern computer games will contain large num-bers of attributes (the dataset we describe later in this paper contains 1289). For such large data sets we found it took more than a week to find the network structure on a
dedi-cated server.3 Typically, dimension reduction is used, a
pro-cess that removes noisy, otherwise unnepro-cessary, attributes in order to simplify the data set; however, dimension re-duction is not applicable in this case. Since our goal is to predict players’ future behaviors with respect to their and
3
Achievement 3 Achievement 1 Achievement 2 Achievement 4 0.7 -0.3 0.01 0.2 -0.02 0.5 0.7 -0.3 0.01 0.2 0.5 Achievement 3 Achievement 1 Achievement 2 Achievement 4 0.7 0.2 0.5 Achievement 1 0.7 0.2 0.5 Downselect Edges Threshold = 0.1 Below Threshold 1) 2)
Figure 4: Downselecting Edges in the Complete Net-work. All edges with a correlation value below a thresh-old (0.1 here) are removed (denoted by a dashed line).
other players’ past behaviors, it is necessary to keep all at-tributes in our data. Also, the directionality in a Bayesian network can be problematic. Since a Bayesian network is a directed acyclic graph, an edge in one direction between two vertices does not imply an edge in the other. For our data, imposing the directionality constraint is unnecessary and actually subverts our ultimate goal. Because we seek to find groups of actions that tend to be taken by similar players, order is unimportant.
3.1.2
Clique Finding
The next step in Phase 1 is to find groups of actions that are highly correlated to each other. These are the groups of ac-tions that exhibit similar frequencies of occurrence. In other words, these are the actions that were all likely to be com-pleted by the same player. In the correlation network, these groups of actions are identified as cliques. These groups of highly correlated actions were identified by extracting all maximal cliques, or cliques that are not a subset of any other clique, from the network. In our algorithm, we used the maximal clique algorithm in the “igraph” package for “R
statistical computing” software.4
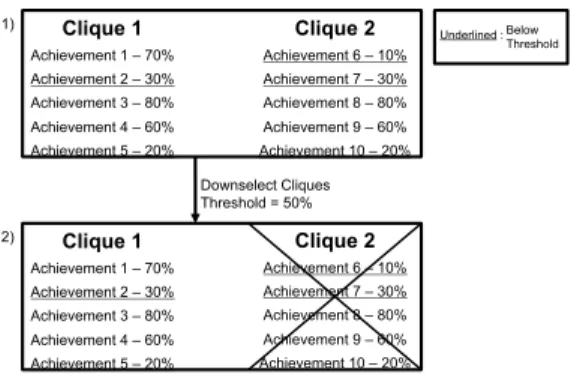
After extracting all maximal action cliques, we remove the remaining cliques that are not maximal. These cliques do not help predict player behavior, so it is safe to discard them. We first calculate the percentage of players in the training set that completed each remaining action. If for a given clique more than half of the actions were completed by fewer than 50% of players, it is discarded. This ensures the remaining cliques contain actions that many players tended to complete together. An example of this process can be seen in Figure 5 where we see two cliques consisting of 5 actions each. In the first clique only two of the actions are below the 50% threshold. As a result, this clique would be kept. The second clique, however, contains three actions that fall below the threshold. As a result, this clique would be discarded. At the end of this step, we have groups of actions that play-ers typically complete together. These groups form the basis for our model of behavior. Further, because we have down-sampled both edges and cliques, the size of our model is
4 http://www.r-project.org/ Clique 1 Achievement 1 – 70% Achievement 2 – 30% Achievement 3 – 80% Achievement 4 – 60% Achievement 5 – 20% Clique 2 Achievement 6 – 10% Achievement 7 – 30% Achievement 8 – 80% Achievement 9 – 60% Achievement 10 – 20% Clique 2 Achievement 6 – 10% Achievement 7 – 30% Achievement 8 – 80% Achievement 9 – 60% Achievement 10 – 20% Clique 1 Achievement 1 – 70% Achievement 2 – 30% Achievement 3 – 80% Achievement 4 – 60% Achievement 5 – 20% Downselect Cliques Threshold = 50%
Underlined : BelowThreshold
1)
2)
Figure 5: Downselecting Cliques. In clique 1,
achieve-ments 1 and 5 are below50%. This means that this clique
falls below the threshold value, and is therefore kept. In
clique 2, achievements 6, 7, and 10 are below50%. This
means that clique 2 is above the threshold value and is pruned. Phase 2 Cliques Achievement Training Set Calculate Probabilities Probability > ϕ No Store Probability Yes Recommend Achievements
Figure 6: Phase 2 of the Algorithm. Phase 2 uses the cliques from Phase 1 to calculate the probability that
a new player will complete one of the cliques. If this
probability is above a given threshold, then the player is predicted to complete the remaining actions in the clique.
significantly reduced and therefore, the efficiency of our pre-diction step discussed below is improved.
3.2
Phase 2
An overview of how phase two of the algorithm performs can be seen in Figure 6. Phase two of the algorithm uses the cliques produced in the first phase to determine the proba-bility that a player will finish the remaining achievements in a given clique. Formally, we represent this value asP(Q|A),
whereQis an action clique andAis the set of actions that
a player has completed. We calculate P(Q|A) =NCAQ
NA
(1)
whereNAis the number of characters in the training set that
have completed the actions inA, andNCAQ is the number
of characters in the training set that have completed the
actions inAand have also completed all of the actions inQ.
So, our model of player behavior is based off of the decisions that players in similar situations made in the past.
This probability is calculated each time a player completes an action. With each action that is completed, players’ ac-tion profiles are updated. In other words, whenever a player completes actiona,P(Q|A) is calculated for everyQwhere
a∈Q. This way, we are able to refine our probabilities as
In order to actually make a prediction, we have to select a probability threshold,φ. Once a clique’sP(Q|A) is aboveφ, we predict that the user will eventually complete the clique. In the future, this predication will be the basis for making a recommendation to the user to finish the remaining actions in the clique. For simplicity,φis currently chosen arbitrarily; however an area of future research is to intelligently choose a threshold that maximizes our algorithm’s predictive power.
3.3
Adding Data to the Model
There are several ways that new data can be added to the
model. The first involves incorporating new player data
as evidence to aid in computing P(Q|A). Currently, all
player data used for prediction is stored in a database that is queried whenever the player completes an action. These
queries are used to computeP(Q|A) for each clique. As a
result, adding character information to this database will add knowledge to the behavior model. The ability to add data to the model is important in games that are constantly
expanding such as World of Warcraft5 (WoW).
Another way to incorporate new data into the model is by computing the action network and extracting the cliques again. This ensures that relationships between actions are updated as new data is gathered. Since this process is more complicated than adding data to a database, it is only worth-while with a large amount of new data. Luckily, this time consuming aspect can occur independently of prediction and the second phase of the algorithm can execute while data updates are incorporated. In our experiments this process could be completed in less than a day, which is a big im-provement compared to the week of computation required to build a Bayesian network.
4.
EVALUATION
To evaluate our algorithm, we tested it using player data from WoW. Here we will review our experimental design and the results obtained from running these experiments.
4.1
Experimental Methodology
Our experimental methodology consists of three steps: ob-taining the character data from the WoW Armory, cleaning the data, and performing the experiment itself. The next sections will cover each of these steps in greater detail.
4.1.1
Obtaining WoW Achievement Data
Our algorithm was tested using character data that was ex-tracted from the WoW Armory using a web-crawler, Wowspy-der [8], developed by Chris Lewis and Noah Wardrip-Fruin. The WoW Armory is an online database that contains in-formation about every character in WoW. Examples of this information include statistics about characters such as play time as well as information about the achievements they have obtained. An achievement is a representation of some game content the player experienced. It may require a long sequence of low-level actions, and therefore meets our cri-teria for a composite action in our model. Thus, we are concerned only with a character’s achievement information. In most games, there are certain actions or milestones that
will earn the player anachievement. Actions that result in
5
http://us.battle.net/wow/en/
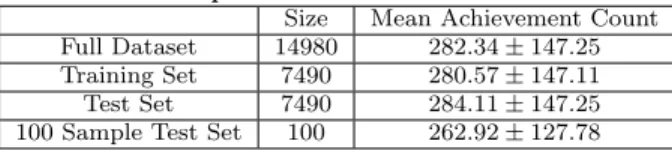
Table 1: Summary of Dataset. Size is the number of
characters. The mean achievement count is the mean
and standard deviation of the number of achievements a character has completed.
Size Mean Achievement Count
Full Dataset 14980 282.34±147.25
Training Set 7490 280.57±147.11
Test Set 7490 284.11±147.25
100 Sample Test Set 100 262.92±127.78
an achievement range from being natural parts of the game (such as simply leveling a character) being quite difficult (such as exploring the entirety of a game world or
complet-ing all quests in an area). In these experiments, we use
achievements as input to our algorithm. We have chosen to use achievements for two reasons. First, achievements offer a convenient encapsulation of sets of player actions. Typically achievements are challenging to obtain and specialized. For example, an achievement might consist of finishing a level in a certain amount of time. Second, as many achievements re-quire dedication to complete, we assume that we can use the fact that a player completed an achievement as a measure of their interest in that action.
We encode characters’ achievements as a 1289-dimensional bit vector where each dimension corresponds to whether that particular achievement has been realized or not. Our dataset
contains 14,980 maximum-level characters. See Table 1 for
a more detailed summary of our dataset.
4.1.2
Data Cleaning
We randomly divided our data into two subsets, a training set and a test set, each containing half (7940 characters) the data. Therefore, the data in each set was independent and identically distributed. Note that both the training set and test set only contain maximum-level characters. Since some achievements can only be completed by higher level characters, we would see a disproportionate amount of formation regarding these higher level achievements if we in-cluded lower-level characters. We further sampled the test set by randomly selecting 100 characters to test on. Table 1 contains data indicating the 100 sample test set provided a representative sample of the full dataset.
During the algorithm’s execution, there are several points in which the data obtained is filtered to ensure that we find the data that we are looking for. The result of these downs-elections can be seen in Table 2. When we downselect edges (keeping only the highly positive correlated edges) we reduce the network size by 95% in terms of edges. We see a simi-lar reduction in the number of cliques (keeping only cliques involving achievements that players completed).
4.1.3
Experiment
We randomly chose 100 examples from our test set and mea-sured prediction accuracy. When the algorithm predicts an achievement, it is checked against the player’s achievement profile to see if that player did acquire that achievement in the future. If the player does go on to complete the predicted achievement, it is considered a true positive (TP). If the player does not go on to complete this achievement, it is
con-Table 2: Summary of Downselections. Included are the number of edges before and after low correlation prun-ing. Also included are the number of cliques before and after clique pruning.
Edges Cliques
Before Downselection 830116 15444
After Downseletion 38607 628
Percent Reduction 95% 96%
sidered a false positive (FP). In addition, if we do not predict an achievement that the player eventually completes, then that is a false negative (FN); however, if the player does not eventually acquire that achievement, the prediction would be considered a true negative (TN). We compared our algo-rithm with a baseline that predicts achievements randomly. In the interest of fairness, we ensured that the random base-line always predicted the same number of achievements for each character that our algorithm did.
Recall that our algorithm has a threshold value, φ, that
determines when the actual achievement prediction should
be made. In order to test the effect that changes inφwould
have, we have run the algorithm on the test set three times
each with a different value forφ. For these experiments, we
use the valuesφ= 0.6,φ = 0.7, andφ = 0.8. Recall that
this means our algorithm will only predict the remaining
achievements in achievement cliqueQwhen P(QA) ≥0.6,
P(QA) ≥ 0.7, and P(QA) ≥ 0.8 respectively. Lastly, we
measured the average time to calculateP(QA).
4.2
Results
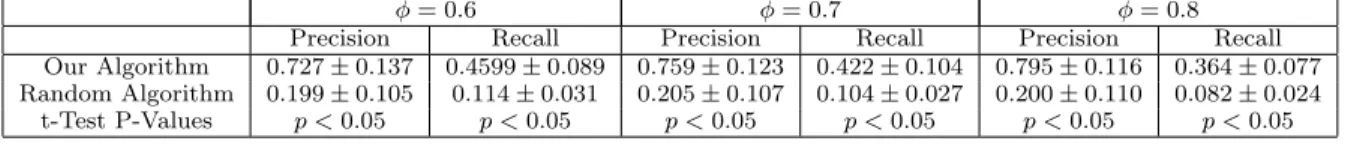
We calculated precision and recall values for both the ran-dom baseline and our method. We use precision and recall because they are good measures for characterizing the accu-racy of predictions. When making predictions, we want to be sure that we are identifying things that the player is likely to do. In other words, we are more concerned with correctly predicting a completed achievement than correctly identify-ing achievements that players will not complete. Precision is defined as T PT P+F P and recall is defined as T PT P+F N. Infor-mally, precision is the percentage of predicted achievements that the player actually completed. This is the validation metric that we are most concerned with. If our algorithm is successful, the majority of achievement predictions will be for achievements that the player eventually completes— high precision. Informally, recall is the percentage of player completed achievements correctly predicted. There exists a natural trade-off between precision and recall and recall is less important for our problem. The more achievements that are input into our model, the higher the precision of our predictions but the lower the recall. Since we are mainly concerned with the precision of our algorithm, this is an ac-ceptable trade-off. Also, because making no prediction will not adversely affect players’ experiences, having a low recall value is acceptable, provided precision is high.
We experiments with three differentφvalues to characterize
their effect on precision and recall. The mean and standard deviation for precision and recall values for each algorithm
for all values ofφare presented in Table 3.
Consider the first two rows of the table. As the value ofφ
in-creases, the precision values also increase. This is expected
behavior because of howφvalues effect when predictions are
made. For greater values ofφ, more evidence must be seen
before predicting achievements in a clique, which means ac-curacy will increase. This is confirmed by our results. As
φ increases, our recall values decrease. This is because the
number of predictions decreases asφgrows larger—also
ex-pected behavior. Since larger φ values require more
evi-dence to make a prediction, there are fewer opportunities to make predictions. As a result, when sufficient evidence has been obtained, the majority of achievements in the clique have already been realized. More informed decisions can be
made about selecting a φ value that fits the specific game
the model is being used in; however, if finding an “optimal”
value for φ is important, using an optimization algorithm
such as a genetic algorithm or MIMIC [3] is probably best. Next, we will consider the columns of the table. After run-ning both our algorithm and a random achievement baseline algorithm, we found that our algorithm outperformed the random prediction algorithm across all thresholds. As can be seen in the table, our algorithm produced higher precision and recall values compared to the random prediction algo-rithm. In each case, our algorithm obtained much higher precision than recall (as expected). In order to further ver-ify our results, we ran a one-sided t-test to verver-ify that the difference we found between our algorithm’s precision/recall and the random prediction algorithm’s precision/recall was statistically significant. With p < 0.05 in all experiments, all these results were statistically significant.
Our results show that the predictions our models made were highly accurate. Because of the scope of the problem and data set, finding an appropriate algorithm to compare against was difficult. Although a random baseline may seem simple, this test is still important in establishing that our method does indeed perform well on a non-trivial problem (the low precision and recall rate for the random algorithm are indi-cators that the prediction problem is a non-trivial one). Our
results show that 70%−80% (depending on the value ofφ)
of our predictions were accurate. This number is even more significant when you consider the size of the data set we are working with and the number of attributes it contains. Our timing experiments showed that on a 2.8GHz Intel Xeon
Processor with 8Gb of RAM it takes an average of 20.08±
38.56 seconds to calculateP(QA). Once a player has
com-pleted an achievement it will take less than one minute to do all calculations required and predict any achievements that the algorithm has determined the user might want to complete. At face value this seems like a long time. And for certain fast-paced games it is; however, for the types of large games that generate extremely large data sets the time between achievements for players can be hours or days. Therefore, a minute of computation time is not a problem.
5.
FUTURE WORK
There are several avenues for future research. One of these is implementing a system for action recommendation. This system would use our models of player behavior to guide players towards actions that they would prefer to perform. Another avenue of research involves using an optimization
Table 3: Summary of Results. The results of both algorithms across varying threshold values.
φ= 0.6 φ= 0.7 φ= 0.8
Precision Recall Precision Recall Precision Recall
Our Algorithm 0.727±0.137 0.4599±0.089 0.759±0.123 0.422±0.104 0.795±0.116 0.364±0.077
Random Algorithm 0.199±0.105 0.114±0.031 0.205±0.107 0.104±0.027 0.200±0.110 0.082±0.024
t-Test P-Values p <0.05 p <0.05 p <0.05 p <0.05 p <0.05 p <0.05
algorithm, such as a genetic algorithm or a repeated hill climbing algorithm, to determine the best threshold val-ues for downsampling or prediction. This way, we can en-sure that there is a solid reasoning behind picking a specific threshold value. Also, a more detailed validation needs to be performed. Since very few achievement prediction algo-rithms exist, adaptations to existing algoalgo-rithms will need to be made in order to compare against a baseline other than random; however, this will provide a better understanding of how our algorithm performs compared to others. Another possible avenue for future research is testing this method using human subjects in order to further confirm that we are making accurate predictions; however, there are several difficulties inherent to this type of work. The first of these involves creating and distributing a program that users could use in game as well as a survey in which the player evaluates how well the program predicted their behavior. Since there is no way to guarantee how many people use this software, issues with sampling size can arise. Also, even if a player downloads the software there is no way to ensure that the survey is filled out and returned, and it is quite common to see low response rates with these types of experiments.
6.
CONCLUSION
In this paper, we have introduced a method for creating player behavior models using observations of players’ actions in games. This model enables predictions about actions the player will take to be made using only the player’s past per-formance and the actions of similar players. By creating cliques of actions, we find actions that many players com-plete together and use this information to drive predictions. We have shown that this method produces accurate predic-tions on real data. Using WoW character data we showed that our method performs significantly better than a base-line algorithm. To verify our results, we ran a Student’s t-test on reported precision and recall values and found that there was a statistically significant difference between the performance of the two methods.
We have shown it is possible to create a purely data-driven approach to player modeling. By moving away from survey-or user-study-based behavisurvey-or models and knowledge engi-neering techniques, we can create more robust models more efficiently. With our technique, not only can we predict user behavior through only previous observations, but we move one step closer towards being able to dynamically create personalized user experiences.
7.
REFERENCES
[1] R. Bartle. Hearts, clubs, diamonds, spades: Players
who suit MUDs.Jour. of MUD research, 1(1), 1996.
[2] S. Carberry. Techniques for plan recognition.User
Modeling and User-Adapted Interaction, 11(1):31–48,
2001.
[3] J. De Bonet, C. Isbell, and P. Viola. MIMIC: Finding optima by estimating probability densities. In
Advances in neural information processing systems,
pages 424–430, 1997.
[4] A. Drachen, A. Canossa, and G. Yannakakis. Player modeling using self-organization in Tomb Raider:
Underworld. InIEEE Symposium on Computational
Intelligence and Games, pages 1–8, 2009.
[5] S. Gross and C. Niman. Attitude-behavior
consistency: A review.Public opinion quarterly,
39(3):358–368, 1975.
[6] R. Houlette. Player modeling for adaptive games.AI
Game Programming Wisdom, 2:557–566, 2003.
[7] R. Laws.Robin’s Laws of Good Game Mastering.
Steve Jackson Games, 2002.
[8] C. Lewis and N. Wardrip-Fruin. Mining game statistics from web services: a World of Warcraft
armory case study. InProceedings of the Fifth
International Conference on the Foundations of
Digital Games, pages 100–107. ACM, 2010.
[9] B. Magerko and J. Laird. Building an interactive
drama architecture. InFirst International Conference
on Technologies for Interactive Digital Storytelling and
Entertainment, pages 226–237, 2003.
[10] M. Sharma, S. Onta˜n´on, M. Mehta, and A. Ram.
Drama Management and Player Modeling for
Interactive Fiction Games.Computational Intelligence,
26(2):183–211, 2010.
[11] M. Sharma, S. Ontan´on, C. Strong, M. Mehta, and
A. Ram. Towards player preference modeling for drama management in interactive stories. In Proceedings of the Twentieth International FLAIRS
Conference (FLAIRS07), 2007.
[12] K. Shim, R. Sharan, and J. Srivastava. Player
performance prediction in massively multiplayer online role-playing games (mmorpgs). In M. Zaki, J. Yu,
B. Ravindran, and V. Pudi, editors,Advances in
Knowledge Discovery and Data Mining, volume 6119
ofLecture Notes in Computer Science, pages 71–80.
Springer Berlin / Heidelberg, 2010.
[13] D. Thue, V. Bulitko, and M. Spetch. PaSSAGE: A Demonstration of Player Modeling in Interactive
Storytelling. InProceedings of Artificial Intelligence
and Interactive Digital Entertainment, 2008. [14] D. Thue, V. Bulitko, M. Spetch, and E. Wasylishen.
Interactive storytelling: A player modelling approach. InProceedings of Artificial Intelligence and Interactive Digital Entertainment, 2007.
[15] G. van Lankveld, S. Schreurs, and P. Spronck. Psychologically verified player modelling. In Proceedings of the 10th International Conference on
Intelligent Games and Simulation, 2009.
[16] N. Yee. Motivations for play in online games. CyberPsychology & Behavior, 9(6):772–775, 2006.