Original Research
T1 Mapping in the Rat Myocardium at 7 Tesla
Using a Modified CINE Inversion Recovery
Sequence
Henk Smit, MSc,
1* Ruben Pellicer Guridi, MSc,
2Jamal Guenoun, MD,
2Dirk H. J. Poot, PhD,
1Gabriela N. Doeswijk, BSc,
2Matteo Milanesi, PhD,
3Monique R. Bernsen, PhD,
2,4Gabriel P. Krestin, PhD,
2Stefan Klein, PhD,
1and Gyula Kotek, PhD
2Purpose: To evaluate the reproducibility and sensitivity of the modified CINE inversion recovery (mCINE-IR) ac-quisition on rats for measuring the myocardial T1 at 7 Tesla.
Materials and Methods: The recently published mCINE-IR acquisition on humans was applied on rats for the first time, enabling the possibility of translational studies with an identical sequence. Simulations were used to study signal evolution and heart rate dependency. Gadolinium phantoms, a heart specimen and a healthy rat were used to study reproducibility. Two cryo-infarcted rats were scanned to measure late gadolinium enhancement (LGE).
Results: In the phantom reproducibility studies the T1 measurements had a maximum coefficient of variation (COV) of 1.3%. For the in vivo reproducibility the COV was below 5% in the anterior cardiac segments. In simu-lations with phantoms and specimens, a heart rate dependency of approximately 0.5 ms/bpm was present. The T1 maps of the cryo-infarcted rats showed a clear lowering of T1 in de LGE region.
Conclusion: The results show that mCINE-IR is highly reproducible and that the sensitivity allows detecting T1 changes in the rat myocardium.
Key Words: T1 estimation; CINE inversion recovery; rat cardiac T1; delayed enhancement
J. Magn. Reson. Imaging 2014;39:901–910.
VC 2013 Wiley Periodicals, Inc.
ESTIMATING THE T1 relaxation parameter of tissues is a promising MRI technique which can be used for detecting and characterizing different types of pathol-ogy in vivo. T1 estimation has drawn an increasing amount of attention in the past few years, as the quantitative measurements have the potential to be less vendor and scanner dependent than the conven-tional T1-weighted images (1), which are not normal-ized and are characternormal-ized by signal intensities and contrasts dependent on specific pulse sequences.
In clinical MRI, T1 mapping has been increasingly applied for the study of ischemic heart disease, add-ing valuable information to the more established tech-nique of late gadolinium enhancement (LGE) (2–4). With LGE, the relative signal difference between healthy and infarcted myocardium is used to assess tissue viability (5–8), but there is no calibrated quanti-fication and it also does not identify diffuse interstitial myocardial fibrosis. Recent work has shown that T1 mapping can differentiate between viable and necrotic tissues after contrast administration (4,9–11) and that it can be used to identify diffuse myocardial fibrosis (3,12). In preclinical research, myocardial T1 mapping has already proved capable of detecting the presence of edema in the myocardium (10,13). Another interesting preclinical application of T1 map-ping would be to enable the visualization and quanti-fication of injected labeled stem cells (14,15).
Several methods and sequences have been introduced to measure the T1 in the cardiovascular system. The most common approaches include the Look-Locker method, the variable flip angle method, and the CINE Inversion recovery method.
The use of Modified Look-Locker inversion recovery (MOLLI) sequences is frequently reported in humans (9,16,17) and also applied in small animals (18). It is a single-slice technique that acquires data during sev-eral consecutive inversion recoveries and merges that into one image set. In humans, the images are acquired in a single-shot balanced SSFP acquisition with an acquisition window of approximately 190 ms during the end diastolic phase when the myocardium
1Departments of Medical Informatics and Radiology, Erasmus MC, Rotterdam, The Netherlands.
2Department of Radiology, Erasmus MC, Rotterdam, the Netherlands. 3Agilent Technologies Inc, Yarnton, Oxford, United Kingdom. 4Department of Nuclear Medicine, Erasmus MC, Rotterdam, the Netherlands.
*Address reprint requests to: H.S., P.O. Box 2040, 3000 CA, Rotterdam, The Netherlands. E-mail: [email protected]
Received December 11, 2012; Accepted May 9, 2013. DOI 10.1002/jmri.24251
View this article online at wileyonlinelibrary.com.
JOURNAL OF MAGNETIC RESONANCE IMAGING 39:901–910 (2014)
CME
is relatively stable. However, in small animals where the RR interval is only 100–200 ms, this approach is not possible. A segmented acquisition can be per-formed but that leads to long scan times up to 43 min to create one T1 map (18). A recent work (19) used temporal undersampling and radial acquisition to reduce scan time. This led to reproducible cardiac T1 estimations but with an in-plane resolution of 0.60
0.60 mm. As the rat myocardium is 1.5–2 cm, it is desirable to achieve a higher resolution. The Look-Locker method is also used in combination with satu-ration recovery (20), which can reduce scan time and eliminate heart-rate induced variations. The MOLLI method has been reported to show a heart rate dependency of the estimated T1 values in humans (21,22). In most other works, the relation of the esti-mated T1 with heart rate is not investigated.
A three-dimensional variable flip angle method has been implemented in small animals (23) and has shown reproducible results on mouse myocardium where it was able to detect regional differences in mice with induced infarction. The drawbacks of this method are the long scan duration up to 50 min to ac-quire five different flip angles and the sensitivity to B1 imperfections. The CINE inversion recovery method (CINE-IR) sequence was first developed for human studies. That implementation consists of an inversion pulse played out after a cardiac trigger, followed by data acquisition in a segmented multi-phase manner (CINE) (24). A second heart cycle can be left unper-turbed to allow the longitudinal magnetization to recover (25,26). This approach could potentially cause problems for small animal imaging, because the T1 values found in the heart can go up to more than 1000 ms, especially with the high field magnets that are often used for small animal imaging. However, the RR interval is only around 150–180 ms. This suggests that, when the acquisitions are performed in one RR interval, there is only a partial recovery of longitudinal magnetization, and only a small part of the inversion recovery curve can be measured.
To deal with the fast heart rate of small animals, our study uses a modified version of the CINE inver-sion recovery (mCINE-IR) that has recently been applied for the estimation of myocardial T1 in humans (2). With respect to the original version of the CINE-IR sequence, in mCINE-IR the number of acquired car-diac phases is variable to allow sampling of a suffi-cient part of the relaxation curve. Because the sequence is applicable both on high and low heart beat rates and at various resolutions without modifi-cation, it may facilitate translational studies from small animal to human models.
The contribution of this work is that it evaluates this novel T1 mapping protocol for the first time on small animals in terms of reproducibility and sensitiv-ity. Two sources of potential error are studied in more detail. The first is that the excitation could be hetero-geneous due to the pulse profile and out of plane motion as mCINE-IR is a single-slice technique. This effect could lead to heterogeneous relaxation behavior. The second is the effect of different heart rates on the estimated T1 values, which change sequence timings
and could, therefore, affect the acquisition. The effect of these two sources of error on the reproducibility and sensitivity of the T1 estimations are investigated. To do this, a novel estimation method based on maxi-mum likelihood estimation is deployed, which is more accurate than the frequently reported (27–29) least squares method as it takes the Rician noise distribu-tion of the MR magnitude images into account (30). It also includes estimation of the noise level. and it cal-culates a lower bound on the standard deviation of the estimated T1, providing a reliable uncertainty measure. Simulations are used to investigate the propagation of the errors introduced by the heteroge-neous relaxation behavior, heart rate changes, and noise to the estimations and, therefore, the accuracy and precision of the estimated T1 values. Additionally, phantom and in vitro MRI studies with mCINE-IR are performed to investigate the precision and reproduci-bility of the estimations from real MR images. Finally, mCINE-IR is used for acquisitions on rats to investi-gate the reproducibility in vivo and to evaluate whether the accuracy and reproducibility of mCINE-IR is sufficiently high to detect T1 changes in the rat myocardium due to the late enhancement of a cryo-infarcted region.
MATERIALS AND METHODS
Pulse Sequence
The modified CINE acquisition (Fig. 1) is based on the original CINE Inversion Recovery sequence (24–26). It uses a nonselective adiabatic inversion pulse, applied immediately after a cardiac trigger. It is followed by a continuously applied Fast Spoiled Gradient Echo (FSPGR) acquisition. As demonstrated earlier this
Figure 1.The mCINE-IR pulse sequence. A FSPGR, RF¼5, CINE acquisition is performed between adiabatic inversion pulses. The number of cardiac cycles between two inver-sions, NRR, can be chosen freely to achieve sufficient
longitu-dinal regrowth of magnetization. In this example the magnetization of the tissue with T1¼400 has reached equi-librium in the given time, but for the tissue with T1¼1000 it could be beneficial to increase NRRto allow more regrowth
of magnetization. The points on the T1¼400 ms curve indi-cate the used points for the T1 estimation in the myocar-dium, taken during the diastolic phase.
continuous application of small angle RF pulses will affect the longitudinal relaxation of magnetization and decrease the apparent T1 (31). Unlike normal CINE sequences, the acquisition is not limited to one or two RR intervals (25,26), but the number of heartbeats between two subsequent inversions can be chosen freely and optimized for the application. A viewsharing algorithm and linear retrospective interpolation are performed on the recorded data to reconstruct the subscribed number of images of cardiac phases per RR interval (32). Each individual image experiences a different time delay after the inversion pulse and, therefore, has a different T1 weighting.
Data Acquisition
For the acquisitions a 7.0 Tesla (T) preclinical scanner (Discovery MR901TM, Agilent Technologies; GE Healthcare) was used with a 72-mm volume transmit coil and a four-channel phased-array surface receive coil. The acquisitions were performed using electro-cardiogram (ECG) triggering with a temporal resolu-tion of 1 ms. The T1 values measured in the rat myocardium were expected to be in the range of 700– 1000 ms, and with a typical RR interval (TRR) of 165
ms, the number of heart cycles between two inver-sions (NRR) was chosen to be 15 such that the
effec-tive repetition time (TReff ¼ TRR NRR) ranges up to
approximately 2500 ms providing enough time for a sufficient signal recovery. The number of views per segment was 6, and 12 images per RR interval were reconstructed. Because images were reconstructed from each of the NRRcardiac cycles in a CINE manner,
also NRRpoints of the inversion recovery curve in the
same cardiac phase are available. We selected images from the diastolic phase by visual inspection and cor-rected potential misalignments by performing an image registration between the images with different inversion times, as described in detail in the section describing the in vivo experiments. The resulting TI values depend on heart rate, starting from the first di-astolic phase and increasing with steps of TRR. For a
heart rate of 365 bpm, this resulted in TI values from 91 ms up to 2380 ms. During TReff, the selected slice
is continuously excited and sampled by the FSPGR RF pulses with a constant repetition time to maintain the steady state. For the FSPGR acquisition, the flip angle¼ 5 degree, the TR ¼3.8 ms and the echo time (TE)¼1.3 ms.
An open source electronics board (ARDUINO, http://arduino.cc) was used, for recording real heart rates from rats and for gating the scanner with simu-lated ECG pulses. We scaled the temporal resolution to 64 ms. For all in vitro scans, the temperature was controlled at a constant value with a hot air blowing system and a MR compatible thermometer (SA Instru-ments, Stony Brook, NY).
T1 Estimation
For the T1 estimation, a three parameter exponential signal model was fitted through the data. The
signal model used for the modified CINE acquisition was (31):
SuðTIÞ ¼ABe
TI
T1 [1]
with parameter vector u ¼ fA, B, T1g. To obtain u, a maximum likelihood (ML) estimator was used which takes the Rician noise distribution of the magnitude MR images into account and maximizes the joint probability of the measurements using a trust region optimization method, solving for each voxel:
fu;sg ¼argmaxu;s XNRR i¼1 lnp yijSuðTIiÞ;s ; [2] where yi is the measured signal corresponding to
inversion timeTIi, andpis the Rician probability
den-sity function. The standard deviation of the noise in the complex MR data s is also estimated during the optimization. To avoid that the estimator finds a local maximum, the optimization was iteratively initialized with a range of different values for u, after which the best fit was chosen. When using an ML estimator and when the derivative of the signal model touis known, the square root of the Cramer-Rao lower bounds (CRLBs) (30) can be calculated, which gives a lower
bound on the standard deviation of the estimated pa-rameters and can, therefore, be used as an indication of the uncertainty of the estimated parameters.
Two types of estimations are used in our work. The first is a region-based estimation, in which all the vox-els in a defined region are used for one single estima-tion. This is done by pooling all the data from a region and fit the model to all the acquired points. The sec-ond method is voxel-based, in which for each individ-ual voxel within a region T1 estimation is performed. The whole estimation pipeline was implemented in an in-house written Matlab (The Mathworks, 2008) script.
Simulation Experiments
Bloch simulations of signal intensities were performed in Matlab. Signal evolution distorted with Rician noise was simulated with the parameters of the mCINE-IR sequence. The T1 was estimated by the same proce-dure as for the real MR data. Three experiments were performed. The first was a simulation of the magnet-ization components of three different homogenous tis-sues with T1 values of 450, 1150, and 2400 ms during an mCINE-IR acquisition at an heart rate of 365 bpm to see the signal evolution during the acqui-sition. Other simulation parameters were flip angle ¼
3.5 degree, repetition time (TR)¼ 3.8 ms, equilibrium magnetization¼1, and thes of added Rician noise¼
0.05. The second experiment consisted of 1000 T1 estimations with the same three tissues as in the first experiment. The T1 was estimated for 12 different heart rates between 265 and 485 bpm to investigate whether a heart rate dependency exists. The third experiment was designed to study the effect of hetero-geneous relaxation behavior within a region of inter-est. As mCINE-IR is a single-slice technique, the excitation can be heterogeneous due to the pulse pro-file and out of plane motion. This could lead to
heterogeneous relaxation behavior within a volume, with different apparen T1 values. Also the T1 values in biological tissue are not likely to be completely homogenous, even in a small region. To investigate this, the second experiment was repeated but now with a signal that was a mix of the tissues with T1 ¼
100 and 2100 ms in a ratio 1:3, thus simulating a region with a small compartment of short T1 tissue. To quantify the heart rate dependency, a straight line was fitted through the mean T1 estimations plotted against the heart rate to obtain the slope with 95% confidence intervals.
Phantom Experiments
A phantom containing six different samples with dilu-tions of the T1 modifying contrast agent gadopente-tate dimuglumine (Magnevist, Bayer, Germany), concentration 0.5 mol/L, was constructed to perform MRI experiments. Six different distilled water solu-tions were created in which the Magnevist was diluted to concentrations of 0.67, 0.33, 0.22, 0.17, 0.13, and 0.11 mmol/L, respectively. The acquisition was always performed during NRR ¼ 15 cardiac cycles,
leading to TReff values from respectively 1856 ms to
3396 ms depending on the simulated heart rate. The scan parameters for the phantom scans were matrix
¼ 256 192, number of excitations (NEX) ¼ 6, field of view (FOV) ¼ 45 34 mm, in-plane voxel size ¼
0.170.17 mm, slice thickness¼2 mm, leading to a scan time of approximately 6 min. To simulate a phantom with heterogeneous relaxation behavior, the signals of the 0.67 and 0.11 mmol/L Gd dilutions were mixed by using all voxels in a single region-based fit. Because the protocol acquires 12 images per cardiac cycle, in total 12*NRR images were
acquired. Although all of these could be used in the T1 estimation because there is no motion in the phan-toms, only one from each cardiac cycle was used to mimic the procedure taken in vivo where only the images from the diastolic phase are selected. A region-based estimation was performed by drawing regions of interest in the tubes covering the whole tubes except the outer 1 mm to avoid boundary effects. In a first experiment to study the reproducibil-ity of the results of T1 estimation with the mCINE-IR the phantoms were scanned seven times with a heart rate of 365 bpm. The mean and standard deviation were calculated. The second experiment was to study the effect of different heart rates. The T1 of each indi-vidual phantom and of the mixed signal was esti-mated for 12 different heart rates between 265 bpm and 485 bpm with steps of 20 bpm. A line was fitted through the T1 values plotted against the heart rates to obtain the slope with 95% confidence intervals.
Ex Vivo Experiments
A rat heart was surgically removed from the body post mortem and fixated in agar gel. Scan parameters were acquisition matrix ¼256 192, NEX ¼ 6, FOV¼ 50
38 mm, in-plane voxel size ¼ 0.20 0.20 mm, slice thickness ¼ 2 mm, leading to a scan time of
approximately 6 min. A region of interest of approxi-mately 5 5 mm was drawn in the myocardium and a region-based T1 estimation was performed. To eval-uate the reproducibility, the specimen was scanned five times with a constant heart rate of 365 bpm. To study the heart rate dependency, the specimen was scanned with the same heart rates as the phantoms, ranging from 265 to 485 bpm, and the slope with 95% confidence intervals was estimated.
In Vivo Experiments
All experiments with animals were performed with prior approval of the institutional animal care com-mittee and according to Dutch law.
To study the characteristics of the heart rate of rats in vivo, 1000 RR intervals of two healthy rats and four infarcted rats were recorded during scanning. The du-ration of each RR interval was measured, and the mean and standard deviation were calculated. For the imaging experiments, the heart rate of the scanned rat at the beginning of the examination was stored in the DICOM header.
In a reproducibility experiment, one healthy rat was scanned in four different scanning sessions to test the reproducibility of the T1 estimations with mCINE-IR in vivo. Scan parameters were acquisition matrix ¼
256 192, NEX ¼ 6, FOV ¼ 60 45 mm, in-plane voxel size¼0.230.23 mm, slice thickness¼2 mm, leading to a scan time of approximately 6 min. The triggering was provided by peripheral pulse oxygen-ation level monitoring on the hind leg of the rats (SA Instruments, Stony Brook, NY). To define the region of interest, the inner and outer boundaries of the myo-cardium were manually drawn on the short axis image. Because the measurements were performed in separate scanning sessions, the positioning of the rat and the myocardium could be different for each case. Therefore, a two-step image registration was applied to define corresponding regions of interest. In the first step, five anatomical landmarks were selected, two points on the intersection of the ventricles and three points on a straight line through the apex and the centre of the right ventricle. These points were used for a rigid point based registration. The result of this registration was used as the initialization for the sec-ond step, which was intensity based rigid registration with a mutual information metric (33) using open source elastix software (34). The myocardium region was divided into six standardized regions (35) by using the selected landmarks. Then a voxel-based estimation was performed for all these segments. The voxels where the CRLBs was less than 15% of the T1
value were defined as successful fits. It has been shown in the literature that the median is more ro-bust than the mean when calculating a global T1 value (36), because the effect of outliers is minimized. In our method, the problem of outliers is treated by only taking the successful fits into account, which removes the outliers from the data as they typically have a high CRLBs. The mean T1 and the standard
deviation of the successful fits within one segment were calculated per segment. To look at the
circumferential variability, a balanced one-way analy-sis of variance (ANOVA) test was performed with the mean outcomes of each segment of the four different scans. A multiple comparison test with 95% confi-dence intervals was used to find possible significant differences between segments.
In two rats, a cryo-infarct was created by exposing the heart through a thoracotomy and applying a cry-oprobe for 14 s on the anterior LV wall. The rats were scanned at three time points with mCINE-IR: precon-trast and at 5 and 16 min after administration of the gadobutrol (Gadovist, Gadovist, Bayer Schering
Pharma AG, Berlin, Germany) with a concentration of 0.5 mmol/kg. Scan parameters were acquisition ma-trix¼256 192, NEX¼ 10, FOV¼5038 mm, in-plane voxel size¼ 0.200.20 mm, slice thickness ¼
2 mm, leading to a scan time of approximately 10 min. A standard T1 weighted inversion recovery fast gradient echo sequence was used to show the pres-ence of LGE 3–5 min after injection. The scan parame-ters were matrix¼192160, TE/TR¼1.2/3.4, NEX
¼ 40, flip angle¼ 14 degree, slice thickness¼ 2 mm, inversion time 100 ms, leading to a scan time of 2 min. In the processing, the myocardium was defined by drawing the inner and outer boundary on the image with the longest inversion time and, therefore, highest SNR. Voxel-based T1 maps were created for the three time points.
RESULTS
Simulation
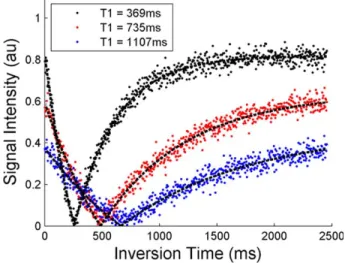
Figure 2 shows the results of the simulated signal evolution. The three different grayscales represent the three tissues. As can be seen, the magnetization goes to a different equilibrium value for each tissue. For longer T1 values, this equilibrium is lower, which is an effect of the constant application of RF pulses. The estimated T1 values are 369, 735, and 1101 ms, lower than the true values of 450, 1150, and 2400 ms. Figure 3a is the outcome of the simulations of 1000 estimations per tissue and per heart rate for the three tissues. The scattered points are the outcomes of the estimations, 1000 for each heart rate and each tissue, and the gray box with the black line is the mean with 95% confidence intervals. The results in Figure 3a show that for longer T1 values there is a larger variation in the estimations. This is in line with
Figure 2.The simulated inversion recovery signal evolutions of the three different T1 values. The estimated T1 values are 369, 735, and 1101 for three tissues. TR¼ 3.8 ms, equilib-rium magnetization¼1 and thes of the added Rician noise is 0.05. The figure shows that SNR decreases for higher T1 values. [Color figure can be viewed in the online issue, which is available at wileyonlinelibrary.com.]
Figure 3.Simulations of T1 estimations. (a) Estimations of the homogenous tissues. (b) Estimations of the combined tissue of the highest and lowest T1. There are 1000 estimations per tissue for each heart rate. The gray boxes behind the points show the mean and the 95% confidence interval of the mean. For the homogeneous tissues the uncertainty increases for higher heart rate and higher T1, but the means do not change with heart rate. The T1 estimations of the mixed signal decrease with heart rate with a slope of 0.51 ms/bpm.
the results in Figure 2, which shows that for longer T1 values the signal to noise ratio (SNR) is lower. Also a smaller part of the total recovery curve is sampled with longer T1 values. Higher heart rates also result in a larger variation of the estimations. However, there is no significant effect on the mean of the estimated T1 values. In Figure 3a, all means are close to each other and with a large margin within each other’s 95% confidence intervals. There is no trend that the estimated T1 goes up or down with heart rate.
In Figure 3b, the result of the simulation with the mixed tissue is shown, which was an approximation of a region with a long and a short T1 component. The T1 estimations show a significant slope, and a decrease of estimated T1 with an increasing heart rate occurs. With a linear fit through the means of the esti-mations, the result is that the slope of this line with 95% confidence interval is0.51 (0.54, 0.48) ms/bpm, meaning that the T1 for this mixed tissue decreases with 1 ms per extra two beats per minute.
Phantom
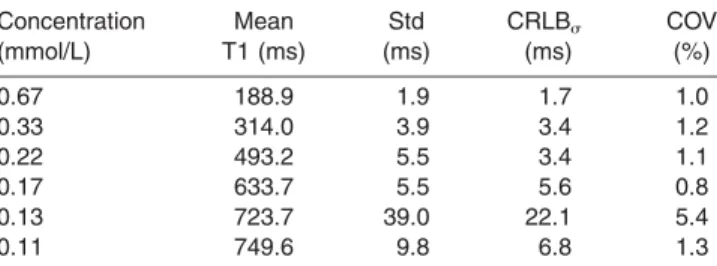
The results of the reproducibility experiments are in Table 1 with the mean outcome per phantom, the standard deviation of the seven experiments, the
mean CRLBs for the estimations and the COV. The
0.13 mmol/L dilution has a high T1 and was the far-thest from the receiver coil, which resulted in a poor SNR of a maximum value 1.5 at the equilibrium, which resulted in a relatively high COV of 5.4%. For the other five phantoms, the COV was within 1.3%. The CRLBsvalues are all in the same range, or a little
lower than the standard deviations, as expected from lower bounds on the standard deviation. In Figure 4, the results of the experiment with the different heart rates are displayed. The 0.13 mmol/L diluted phan-tom was excluded from this figure for clarity as the error introduced by the low SNR exceeded the effect of the changing heart rate. The black lines are for the five phantoms. The gray points are for the fit on the mixed signal. Next to each curve the fitted slope is displayed with 95% confidence intervals. It shows that as the T1 increases the slope also slowly increases, going from0.02 to0.27 ms/bpm, which was not observed in the simulations. For the mixed signal, the slope with 95% confidence intervals is
0.54 (0.61, 0.48) ms/bpm, significantly steeper than for each of the phantoms separately, which is in agreement with the simulation results.
Ex Vivo
The reproducibility experiment resulted in a T1 of 643.2 6 2.9 ms in the region of interest in the myo-cardium and a COV of 0.45%, showing a similar reproducibility as in the phantoms. The results of the heart rate dependency experiment are plotted with CRLBserror bars in Figure 5. The slope of the line
fit-ted through the points with 95% confidence intervals is 0.50 (0.60, 0.40) ms/bpm, which is in the same range as the mixed phantom and significantly steeper than the homogenous phantoms.
Figure 4.The outcome of the T1 estimations on the phan-toms for 12 different heart rates. The black scattered point are the estimated T1 values of the five phantoms. The gray points are the combination of the high and low dilution. The numbers printed on the right are the slopes of the dashed lines fitted through the measurements with the 95% confi-dence intervals. The slope for the mixed signal is steeper than for each of the dilutions individually. [Color figure can be viewed in the online issue, which is available at wileyonlinelibrary.com.]
Table 1
Outcomes of the T1 Estimations for The Six Different Gd Dilutions Concentration (mmol/L) Mean T1 (ms) Std (ms) CRLBs (ms) COV (%) 0.67 188.9 1.9 1.7 1.0 0.33 314.0 3.9 3.4 1.2 0.22 493.2 5.5 3.4 1.1 0.17 633.7 5.5 5.6 0.8 0.13 723.7 39.0 22.1 5.4 0.11 749.6 9.8 6.8 1.3
The measurement is repeated seven times and the mean, the standard deviation, the CRLBsand the COV of these seven
meas-urements are displayed.
Figure 5.The estimated T1 values for the myocardium speci-men. The scattered points are T1 estimations at different heart rates. The error bars are calculated with the Cramer-Rao lower bounds. The dashed line is fitted through the measurements and has a slope with 95% confidence interval of 0.50 (0.40, 0.60) ms/bpm, displaying a heart rate dependency.
In Vivo
The heart rate measurements of the four infarcted and two healthy rats resulted in a mean RR interval and standard deviation for each rat. For the infarcted rats, the average mean RR interval and the average standard deviation were 365 and 13 bpm and for the healthy rats 370 and 13 bpm.
Figure 6 shows the reproducibility results for the six segments of the myocardium. The percentage of successful fits, which have a CRLBsof less than 15%
of the estimated T1 value, is displayed for each seg-ment, as well as the mean T1 with standard devia-tions. The reproducibility and the percentage of successful fits are higher for the three anterior seg-ments than for the three inferior segseg-ments. The COV of the mean T1 is below 4.8% for the anterior seg-ments, while it is above 12% for the inferior segments. The mean heart rate was 355 bpm with a standard deviation of 10 bpm. The ANOVA test resulted in a
P-value of 1106, rejecting the null hypothesis that all segments have the same mean. The multiple com-parison test showed that the inferior segment is sig-nificantly different from all other segments, and no other significant differences between the means of the other segments were found.
In Figure 7 the results for the LGE experiments are displayed for both rats. On the left the precontrast T1 map estimated from mCINE-IR is displayed as an overlay over the myocardium. There are no distinct regions with a different T1. After contrast administra-tion the standard T1W IR was acquired to demon-strate the presence of LGE, shown in the figure with an arrow. For both the rats, a distinct region of bright
signal is visible in the myocardium. These regions are also present, at the same location, in the postcontrast T1 maps. As can be seen from the overlay the T1 in the infarcted regions is clearly lower than the T1 of the healthy myocardium. The infarcted T1 is also sim-ilar in both the time points, 5–15 min and 16–26 min after administration, while the T1 of the healthy myo-cardium is already increasing in the second time point with respect to the first.
DISCUSSION
Our results have shown the reproducibility in vitro and in vivo of a T1 mapping technique based on the mCINE-IR sequence, applied on small animals. The dependency of the estimated T1 on heart rate for bio-logical tissue is around 0.5 ms/bpm, as shown in Figures 4 and 5. The standard deviation of both the six recorded RR intervals and the heart rates of the reproducibility study was around 10 bpm, which would result in a T1 change of 5 ms. However, when the rats were under anesthesia, it was sometimes observed that their heart rate slowly decreased dur-ing the scan, up to heart rate differences in the order of 50 bpm, corresponding with T1 changes of 25 ms. This is still only a small error in comparison with the T1 difference between the infarcted and healthy myo-cardium, as shown in Figure 7. However, in research where the goal is to detect smaller T1 differences, the heart rates of the animals should be monitored to have the option to correct the T1 if large heart rate differences occur. But from the clear distinction in the T1 maps between infarcted and healthy
Figure 6.The results of the reproducibility study on the six segments of the rat myocardium. Mean and standard deviation are plotted for the four experiments. The mean T1 with standard deviation of the mean and the percentage of successful fits, which have a CRLBsof less than 15% of the estimated T1 value, are displayed as text. The range of the T1 values axis is
dif-ferent for the upper and the bottom row. The anterior segments show both a high fit success rate and a reproducible outcome with all COV values below 5%. The inferior segments have lower success rates and less reproducible outcomes, all with a COV above 12%.
myocardium, together with the reproducibility results which show that the COV in vivo is below 5%, it is clear that mCINE-IR is a promising technique for measuring the T1 in the myocardium of small ani-mals accurately.
In our sequence, due to the continuous application of the small angle RF pulses the relaxation is charac-terized by an apparent time constant T1 (often referred as to T1*), which is shorter than the original T1. The relation between the observed T1* and T1 can be described with the following formula (37):
1 T 1 ¼ 1 T1 1 TR lnðcosaÞ [3]
withaflip angle in degrees and TRthe repetition time
of the small excitations. However, this correction is very sensitive to small changes in a and, therefore, a
has to be known with a high precision. Although vari-ous B1 mapping methods exist (38,39), achieving such a precision is still a challenge. Another correc-tion factor that is proposed and used in literature (31,37) is: T1¼T1 B A1 [4] where A and B are the two fitting constants from the signal model in Eq. [(1)]. This correction factor can only be applied when the signal inversion recovery starts from the completely recovered equilibrium value. This is not the case, because the magnetization has a smaller equilibrium value due to the constant RF pulse application.
The simulation results show that for a mixture of long and short T1 values a heart rate dependency is introduced that is not present in homogenous tissues. As the heart rate gets higher, TReffgets shorter and a
shorter part of the recovery can be sampled, which affects the estimation and causes the apparent T1 to
be shorter. This is also shown by the results of the mixed phantom in Figure 4, which displayed a steeper heart rate dependency than each of the individual phantoms. However, the homogeneous solutions also show a mild heart rate dependency. Possible explanations are B1 inhomogeneities or the slice pro-file. When the flip angle changes over the volume, Eq. [3] shows that the apparent T1 will be influenced which could introduce a mixture of T1 values within a voxel or a region.
To address the heart rate dependency caused by a mixed signal, an approach could be bi- or multi-expo-nential fitting. Several other works have tried this with mixed results. In Larsson et al (40), mono- and bi-exponential fitting was evaluated for both T1 and T2 mapping in the human brain. For the T1 estima-tions, all the cases scored better with a mono-expo-nential fit. A problem of multi-expomono-expo-nential fittings is that the extra degrees of freedom increase the uncer-tainty of the T1 values. An iterative approach, starting with mono-exponential and increasing the number of fitted exponentials could be a solution. Likelihood ratio tests (41) could be applied to test whether the addition of extra variables really improves the estimation.
Another way to deal with the heart rate dependency could be to change NRRas demonstrated in (2). When
the heart rate increases, TReff decreases. By adding
extra cycles, the effective repetition time could then be increased again. However, this method has some limitations. It is not desirable to change the acquisi-tion protocol during a scan in which heart rate changes occur. Also, only steps of at least one RR interval, around 160 ms, can be added to or sub-tracted from the TReff. However, this corresponds with
heart rate changes of approximately 22 bpm and because that corresponds with a T1 change of only 11 ms, this step size could be small enough and could be
Figure 7.The results of the LGE experiments for both rats. The precontrast T1 map shows no distinct regions with a differ-ent T1. In the T1W images the LGE of the infarct is clearly visible and indicated with an arrow. The postcontrast T1 maps show a substantial lowering of T1 in the infarcted region.
an effective way to reduce heart rate dependency effects.
In the in vivo results, the percentage of successful fits, which have a CRLBsof less than 15% of the
esti-mated T1 value, was higher on the anterior segments than on the inferior segments. The inferior segment was also found to have a significantly different mean T1 than the other segments. The inferior segments are at the heart-lung interface which is known to give susceptibility problems (42). This could be a cause of the difference in results. In our case, another source of error could come from the use of a surface coil, as the inferior segments are farther from the coil than the anterior segments, which lowers the SNR.
In conclusion, in this work the reproducibility of myocardial T1 mapping in small animals with mCINE-IR is evaluated and demonstrated to be good, and the capability to detect the T1 differences caused by LGE is shown. Therefore, we think that mCINE-IR is a promising new technique that could enable trans-lational T1 mapping studies from small animal model to human with a single technique. Further experi-ments should investigate the sensitivity of the method and validate the accuracy.
ACKNOWLEDGMENTS
This study was performed through support from the CARISMA Perspective program funded by STW and from ENCITE, funded by the European Community under the 7th Framework Program. S.K. is financially supported by the Netherlands Organization for Scien-tific Research (NWO).
REFERENCES
1. Ashton E. Quantitative MR in multi-center clinical trials. J Magn Reson Imaging 2010;31:279–288.
2. Milanesi M, Barison A, Positano V, et al. Modified cine inversion recovery pulse sequence for the quantification of myocardial T1 and gadolinium partition coefficient 2012, J Magn Reson Imaging 2013;37:109–118.
3. Iles L, Pfluger H, Phrommintikul A, et al. Evaluation of diffuse myocardial fibrosis in heart failure with cardiac magnetic reso-nance contrast-enhanced T1 mapping. J Am Coll Cardiol 2008; 52:1574–1580.
4. Goldfarb JW, Arnorl S, Marguerite R. Gadolinium Pharmacoki-netics of chronic myocardium infarcts: implications for late gado-linium-enhanced infarct imaging. J Magn Reson Imaging 2009; 30:763–770.
5. Edelman RR. Contrast-enhanced MR imaging of the heart: over-view of the literature. Radiology 2004;232:653–668.
6. Kim RJ, Fieno DS, Parrish TB, et al. Relationship of MRI delayed contrast enhancement to irreversible injury, infarct age, and con-tractile function. Circulation 1999;100:1992–2002.
7. Klem RJ, Judd RM, Elliott M, et al. Improved detection of coro-nary artery disease by stress perfusion cardiovascular magnetic resonance with the use of delayed enhancement infarction imag-ing. J Am Coll Cardiol 2006;47:1630–1638.
8. Ingkanisorn WP, Rhoads KL, Aletras AH, Kellman P, Arai AE. Gadolinium delayed enhancement cardiovascular magnetic reso-nance correlates with clinical measures of myocardial infarction. J Am Coll Cardiol 2004;43:2253–2259.
9. Sparrow PS, Messroghli DR, Reid S, Ridgway JP, Bainbridge G, Sivananthan MU. Myocardial TI mapping for detection of left ven-tricular myocardial fibrosis in chronic aortic regurgitation: pilot study. Am J Radiol 2006;187:W630–W635.
10. Messroghli DR, Walters K, Plein S, et al. Myocardial T1 mapping: application to patients with acute and chronic myocardial infarc-tion. Magn Reson Med 2007;58:34–40.
11. Piechnik SK, Ferreira VM, Dall’Armellina R. Shortened Modified Look-Locker Inversion recovery (ShMOLLI) for clinical myocardial T1-mapping at 1.5 and 3 T within 9 heartbeat breath-hold. J Cardiovasc Magn Reson 2010;12:69–80.
12. Broberg CS, Chugh SS, Conklin C, Sahn DJ, Jerosch-Herold M. Quantification of diffuse myocardial fibrosis and its association with myocardial dysfunction in congenital heart disease. Circula-tion 2010;3:727–734.
13. Protti A, Sirker A, Shah A, Botnar R. Late gadolinium enhance-ment of acute myocardial infarction in mice at 7T: cine-flash versus inversion recovery. J Magn Reson Imaging 2010;32: 878–886.
14. Liu W, Frank J. Detection and quantification of magnetically la-beled cells by cellular MRI. Eur J Radiol 2009;70:258–264. 15. Daldrup-Link HE, Rudelius M, Metz S, et al. Cell tracking with
gadophrin-2: a bifunctional contrast agent for MR imaging, opti-cal imaging, and fluorescence microscopy. Eur J Nucl Med 2004;31:1312–1321.
16. Messroghli DR, Radjenovic A, Kozerke S. Modified Look-Locker Inversion recovery (MOLLI) for high-resolution T1 mapping of the heart. Magn Reson Med 2004;52:141–146.
17. Kawel N, Nacif M, Zavodni A, et al. T1 mapping of the myocar-dium: intra-individual assessment of the effect of field strength, cardiac cycle and variation by myocardial region. J Cardiovasc Magn Reson 2012;1:27.
18. Waghorn B, Edwards T, Yang Y, et al. Monitoring dynamic altera-tions in calcium homeostasis by T1-weighted and T1-mapping cardiac manganese-enhanced MRI in a murine myocardial infarc-tion model. NMR Biomed 2008;21:1102–1111.
19. Messroghli DR, Nordmeyer S, Buehrer M, et al. Small Animal Look-Locker Inversion Recovery (SALLI) for simultaneous genera-tion of cardiac T1 maps and cine and inversion recovery-prepared images at high heart rates: initial experience. Radiology 2011; 261:258–265.
20. Li W, Griswold M, Yu X. Rapid T1 mapping of mouse myocardium with saturation recovery look-locker method. Magn Reson Med 2010;64:1296–1303.
21. Messroghli DR, Plein S, Higgins DM, et al. Human myocardium: single-breath-hold MR T1 mapping with high spatial resolution— reproducibility study. Radiology 2006;238:1004–1012.
22. Slavin GS, Song T, Stainsby JA. The effect of heart rate in look-locker cardiac T1 mapping. Proceedings of the 18th Annual Meet-ing of ISMRM, Stockholm, Sweden, 2010. (abstract 2947). 23. Coolen BF, Geelen T, Paulis LEM, Nauerth A, Nicolay K, Strijkers
GJ. Three-dimensional T1 mapping of the mouse heart using variable flip angle steady-state MR imaging. NMR Biomed 2011; 24:154–162.
24. Ho VB, Hood MN, Montequin M, Foo TK. Cine Inversion Recovery (IR): rapid tool for optimized myocardial delayed enhancement imaging. Proceedings of the 13th Annual Meeting of the ISMRM, Miami Beach, Florida, 2005. (abstract 1675).
25. Goldfarb JW, Mathew ST, Reichek N. Quantitative breath-hold monitoring of myocardial gadolinium enhancement using inversion recovery TrueFISP. Magn Reson Med 2005;53: 367–371.
26. Gupta A, Lee VS, Chung Y-C, Babb JS, Simonetti OP. Myocardial infarction: optimization of inversion times at delayed contrast-enhanced MR imaging. Radiology 2004;233:921–926.
27. Li XC, Ma B, Link T, et al. In vivo T1 and T2 mapping of articular cartilage in osteoarthritis of the knee using 3T MRI. Osteoarthri-tis Cartilage 2007;15:789–797.
28. Maier CF, Tan SG, Hariharan H, Potter HG. T2 quantitation of articular cartilage at 1.5T. J Magn Reson Med 2003;17: 358–364.
29. Van Breuseghem I, Palmiere F, Peeters RR, Maes F, Bosmans HTC, Marchal GJ. Combined T1-T2 mapping of human femoro-tibial cartilage with turbo-mixed imaging at 1.5T. J Magn Reson Imaging 2005;22:368–372.
30. Sijbers J, Den Dekker AJ, Raman E, et al. Parameter estimation from magnitude MR images. Int J Imaging Syst Technol 1999;10:109–114.
31. Deichmann R, Haase A. Quantification of T1 values by snapshot-FLASH NMR imaging. J Magn Reson 1992;96:608–612.
32. Feinstein JA, Epstein FH, Arai AE, et al. Using cardiac phase to order reconstruction (CAPTOR): a method to improve diastolic images. J Magn Reson Imaging 2005;7:794–798.
33. Thevenaz P, Unser M. Optimization of mutual information for multiresolution image registration. IEEE Trans Image Process 2000;9:2083–2099.
34. Klein S, Staring M, Murphy M, et al. Elastix: a toolbox for inten-sity-based medical image registration. IEEE Trans Med Imaging 2010;29:196–205.
35. Cerqueira MD, Weissman NJ, Dilsizian V. Standardized myocar-dial segmentation and nomenclature for tomographic imaging of the heart a statement for healthcare professionals from the car-diac imaging committee of the Council on Clinical Cardiology of the American Heart Association. Circulation 2002;105:539–542. 36. Positano V, Salani B, Pepe A, et al. Improved T2* assessment in
liver iron overload by magnetic resonance imaging. Magn Reson Imaging 2009;27:188–197.
37. Deichmann R, Hahn D, Haase A. Fast T1 mapping on a whole-body scanner. Magn Reson Med 1999;42:206–209.
38. Yarnykh VL. Actual flip-angle imaging in the pulsed steady state: a method for rapid three-dimensional mapping of the trans-mitted radiofrequency field. Magn Reson Med 2007;57:192–200. 39. Sacolick LI, Wiesinger F, Hancu I, Vogel MW. B1 mapping by
Bloch-Siegert shift. Magn Reson Med 2010;63:1315–1322. 40. Larsson HB, Frederiksen J, Kjaer L, Henriksen O, Olesen J. In
vivo determination of T1 and T2 in the brain of patients with severe but stable multiple sclerosis. J Magn Reson Med 2005; 7:43–55.
41. Dickey DA, Fuller WA. Likelihood ratio statistics for auto-regressive time series with a unit root. J Econ Soc 1981:1057– 1072.
42. Atalay MK, Poncelet BP, Kantor HL, Brady TJ, Weisskoff RM. Car-diac susceptibility artifacts arising from the heart-lung interface. Magn Reson Med 2001;45:341–345.