Text mining for insurance claim cost
prediction
Prepared by Inna Kolyshkina and Marcel van Rooyen
Presented to the Institute of Actuaries of Australia XVth General Insurance Seminar 16-19 October 2005
This paper has been prepared for the Institute of Actuaries of Australia’s (Institute) XVth General Insurance Seminar 2005. The Institute Council wishes it to be understood that opinions put forward herein are not necessarily those of the
Institute and the Council is not responsible for those opinions.
PricewaterhouseCoopers 2005
The Institute will ensure that all reproductions of the paper acknowledge the Author/s as
the author/s, and include the above copyright statement:
The Institute of Actuaries of Australia Level 7 Challis House 4 Martin Place
Sydney NSW Australia 2000
Telephone: +61 2 9233 3466 Facsimile: +61 2 9233 3446 Email: actuaries@actuaries.asn.au Website: www.actuaries.asn.au
Abstract.
The paper presents the findings of an industry-based study in the utility of text mining. The purpose of the study was to evaluate the impact of textual information in claims cost prediction. The industrial research setting was a large Australian insurance company. The data mining methodologies used in this research included text mining, and the application of the results from the text mining in subsequent predictive data mining models. The researchers used software of the leading commercial vendors. The research found commercially interesting utility in textual information for claim cost prediction, and also identified new risk management factors.Key words: text mining, predictive model, insurance claim prediction, risk management.
Introduction
Claims cost prediction is an important focus area for insurance companies. The reason is that proactive case management can significantly reduce the final claims pay-out value. The issue is particularly relevant, when considered that a small number of cases amount to a disproportionately big portion of total claims out value. It follows that small improvements in claims pay-out value prediction, may bring significant financial benefits to insurance companies.
There has been recognition for some time now that data about incidents contain information which allows for a proactive risk management approach (Feyer and Williamson 1998, p.1). The large size of insurance databases is making data mining an increasingly attractive tool for analysis compared to traditional analytical methods (Kolyshkina, Steinberg et al. 2003, p.493). Up to 80% of this data is in unstructured textual format (Feldman 2003, p.481). Realising the potential value of information resident in this textual data, there is growing interest by insurers in the application of new text mining techniques (Feyer, Stout et al. 2001). We refer to an example where text mining analysis of narrative fields about claims, resulted in beneficial claims management and fraud detection in the occupational injury insurance domain (Stout 1998). In the example, the benefits stemmed from information in the textual narrative data, which was not present in the existing coding system.
potency of textual data in such predictive models. The researchers therefore set out to investigate the utility of unstructured textual data in improving predicted pay-out value of insurance claims.
The research was done using data provided by a large Australian insurance company. That insurer first wanted to asses the potential value that using text mining facilities could add to the organisation in increasing the precision of claim cost prediction; second to explore the possibilities and benefits of augmenting their existing incident coding system using free text; and thirdly to suggest how text mining could be used for improvement in other areas of the business.
Our approach was to create a model identifying at the time of the incident report, whether the incident would result in a claim pay-out value within the top 10 percent by value, by the end of the next quarter. We assessed the model in terms of the predictive power of textual information on its own, and in terms of textual information adding predictive power to other, non-textual predictors.
1
Description of algorithms used
The researchers used both SAS® Enterprise Miner and SPSS® Clementine text mining software for textual data preparation and text mining. The discovered concepts were similar irrespective of the software package used.
Predictive feature selection and predictive modelling was done using both CART® and TreeNet® (Hastie, Tibshirani et al. 2001). The choice of TreeNet® was because of its high precision in predictive modelling, its effectiveness in selecting predictors, and its resistance to overtraining. CART® models are more easily interpretable than TreeNet® models, therefore the researchers used CART® in conjunction with TreeNet® to assure understandability about the predictive models.
2
Data Description
The first group of data comprised features about claimant demographics, claims pay-out value information, and codings about various aspects of the incident (e.g. about the body part injured). To facilitate the discussion, we name this first group of data TransData. The textual data contained unstructured free-type text fields of about 200 characters each. These fields described the incident and the resulting injury. We name this second group of textual data TextData.
Both data groups were identified by claim numbers. The data sets represented all claims reported between 30 September 2002 and 31 March 2004, which were still open at the time of the research. This was an 18 month data history, which provided approximately 56,000 records. The target variable for prediction was a binary indicator (yes/no) of whether or not that injury report had resulted in a claim pay-out value within the top 10 percent by the end of the quarter of the report. The quarter represents a three-month time window of investigation.
3
Description of analytical techniques
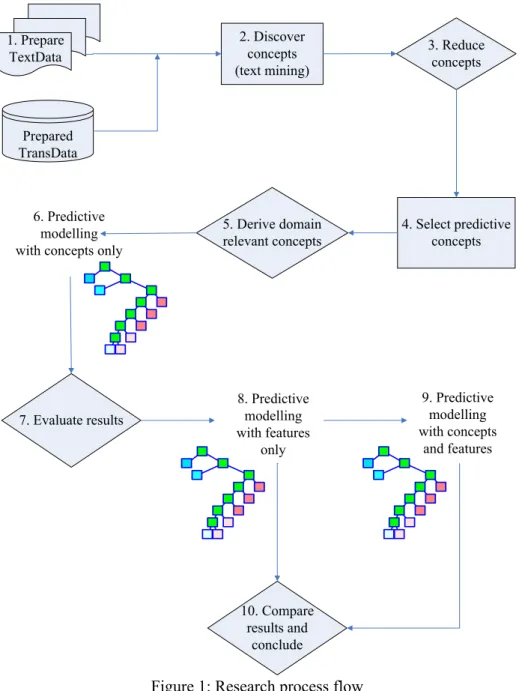
In Figure 1 we present the research process flow:
1. Prepare TextData 2. Discover concepts (text mining) 3. Reduce concepts 5. Derive domain relevant concepts 4. Select predictive concepts 6. Predictive modelling with concepts only
8. Predictive modelling with features only Prepared TransData 7. Evaluate results 10. Compare results and conclude 9. Predictive modelling with concepts and features
Figure 1: Research process flow
We will discuss our research process under the following headings. These headings are the same as the labels of the elements of Figure 1.
3.1 Prepare TextData
The process started at point one with the preparation of TextData for text mining. The preparation included routine activities of extracting data, and merging TextData and TransData by the unique claim identity.
3.2 Discover concepts
Text mining is the discovery of concepts from unstructured data. Concepts are words or word combinations resident in the text. These concepts can then be mined in isolation, or in combination with other data. Within this context, text mining can be considered a way of pre-processing unstructured data for use in subsequent modelling.
The researchers mined TextData at point two to discover concepts from it. The mining of TextData required not only considerable time and effort, but also expertise in the insurance domain, and in the used software packages.The mining process was characterised by iterative experimentation to find optimal algorithm settings. These settings included both language and mathematical weightings.
3.3 Reduce concepts
About 8000 concepts were discovered in the preceding activity. Not only did it prove difficult to make sense of so many concepts, but it would also make subsequent analysis intractable. Further, concepts with a low frequency would not be relevant within our context. Therefore at point three the researchers filtered out those concepts which had a frequency of less than 50 in TextData. After filtering 860 concepts remained. The issue of the predictive value of concepts now needed resolution. We had prior knowledge about the predictive value of the data features in TransData from existing modelling by the insurer.
3.4 Select predictive concepts
The researchers resolved the issue of concept predictability by using TreeNet® at point four to identify the most predictive of the 860 concepts. We present the nine most predictive concepts from this step in Table 1. The first column of Table 1 lists the concept names which were selected by TreeNet®, and the second column states each concept’s relative predictive importance.
Table 1: Concept importance using TreeNet®
Concept name importance Concept
LEG 100 LACERATED 99.43 FRACTURE 92.56 STRESS_STRESS 92.27 EYE 86.56 HERNIA 84.11 TRUCK 82.62 BURN 73.06 LADDER 58 ... ...
3.5 Derive domain-relevant concepts
The researchers depended on insurance domain expertise for deriving additional features at point five. This encompassed the grouping and combining of concepts e.g. ‘to injure’ and ‘to hurt’ were set as equivalent terms. Concept derivation was assisted by referring to other targets in addition to the predicted target.
3.6 Predictive modelling with concepts only
At point six the researchers built one TreeNet® and one CART® predictive model for claims cost, using only the predictive concepts and the derived concepts. The CART® model was built for interpretability of results. The purpose with building these two models was to discover any predictive potential of the textual concepts only.
3.7 Evaluate results
At point seven the researchers evaluated these two models based on the concepts alone by referring to model topology, gains charts, and model accuracy. The TreeNet® model was 75.7% precise on test data. We present the gains charts for the two models in Figure 2:
Figure 2: Gains chart TreeNet® (left)and CART® (right)
From these CART® and TreeNet® gains charts we evaluated that the concepts had predictive potential. We show the reduced model topology from CART® in Figure 3:
Figure 3: Topology CART® model using concepts only
The first split is on the concept ‘eye’, followed by ‘lacerated’, ‘stress’, ‘fracture’, ‘hernia’, ‘truck’, and ‘ladder’. This topology made domain sense, since eye-related claims have a relatively low cost, as do laceration-related claims.
Table 2: Concept importance using CART®
Concept name importance Concept
GROUP_EYE 100 GROUP_LACERATED 72.61 FOREIGNBODY 60.85 GROUP_STRESS 60.25 GROUP_FRACTURE 50.45 HERNIA 20.91 KNIFE 14.43
GROUP_TRUCK 11.82
In Table 2 we present the most important concepts as identified by this CART® model. The concept names which start with GROUP_, are derived concepts from step five.
The positive evaluation of the predictive results encouraged the researchers to further experiment about the predictability of the concepts in combination with TransData features. We describe that experimentation below.
3.8 Predictive modelling with features only
At this point the researchers build one CART® model and one TreeNet®
model, predicting claims pay-out value. We build these models to create points of comparative reference for the combined models which we will describe in point 9.
In both models we used only TransData features i.e. there were no concepts in these models. The CART® model (called C1) we built on data sets (or observations), which captured all the insurer's incident codes.
Domain experts suggested that textual information may be particularly useful for improving prediction precision for those incident codes which cover many cases and have high pay-out value variance. We therefore build the TreeNet® model (called T1) on data sets (or observations) which represented such an incident injury nature code (i.e. type of injury).
3.9 Predictive modelling with features and concepts
At point nine the researchers build one more CART® model and one more TreeNet® model, also predicting claims pay-out. In these two models we combined TransData features with predictive concepts from TextData. The combined CART® model (called C2) we built on the same data sets as C1 above. The combined TreeNet® model (called T2) we build on the same data sets as T1 above.
In the next section we will compare the results from these four models, and make inference about the contribution of the concepts to predictive accuracy about claims cost.
3.10 Compare results and conclude
We present the gains charts of the C1 and C2 models in Figure 4:
Figure 4: Gains chart CART® models – C1 left and C2 right
Comparing the two gains charts shows about a 5% increase in predictive performance of C2 over C1. In Figure 5 we present the gains charts of TreeNet® models T1 and T2:
Figure 5: Gains charts TreeNet® – T1 left and T2 right
The gains chart of T2 shows about a 10% improvement over the gains chart of T1. We note that this improvement is twice as much as the improvement over the full data set (C2 over C1). This is consistent with the idea that textual features add value to claims pay-out prediction in large code categories.
We attribute the increase in predictive value of the combined models, to resolution which is added to the models by the addition of the concepts. In Figure 6 we display the additional resolution in the C2 CART® model.
INJDISLC MECHINJC INJDISLC INJDISLC MECHINJC INJDSNAT MECHINJC INJDISLC MECHINJC INJDISLC INJDSNAT MECHINJC INJDISLC MECHI NJC DISC SHOULDER TRUCK LEG STRESS_STRESS EYE STRAINEDRIGHTSHOULDE MECHI NJC RESIDENT INJDISLC INJDSNAT MECHINJC INJDISLC INJDISLC INJDSNAT
Figure 6: Additional CART® model resolution from concepts
The binary splits outside the square area in Figure 6, are on features
from TransData e.g. injury location (part of body), nature of the injury,
and mechanism of the injury. The splits inside the square were on
concepts from TextData. The concepts found in the square are not
covered by the insurer’s existing coding system. Examples of such
concepts were ‘truck’, ‘roof’, and ‘ladder’. Such concepts can also be
useful in identifying particular industry OH&S issues, which require
proactive risk management strategies.
From the above results, the researchers conclude that the combined
models had increased predictive precision in claim cost prediction,
compared to the models with TransData features only. The conclusion
is valid for the full data set, as well as for the high frequency and
variance data subset.
Mining unstructured textual data therefore did improve the prediction
of insurance claims cost. We also discovered new concepts which
complement the insurer’s existing coding system. The next section
contains ideas about how text mining could be used for improving other
areas of the insurer’s business.
4
Potential applications of text mining by the insurance industry
The researchers offer their impressions of some possible uses of text mining in the insurance industry;
• first, we perceive application in an insurer’s capital management. Improved prediction about future insurance claims cost, should bring about improvements in the quantification of re-insurance needs. Such quantification about needs will be invaluable in negotiating favourable re-insurance premiums, and terms and conditions, with re-insurers. Further,
such quantification should assist with better planning about working capital requirements for that portion of their risk which is not re-insurable;
• a second potential application is where textual data from the incident investigation is available for analysis. Insurers could identify new risk factors, and previously unknown interactions between known risk factors. Such knowledge would enable insurers to develop industry-specific proactive risk management practices with their insured clients, with consequential financial benefits to both parties;
• a third potential application is where textual data is available from after-the-event therapy sessions with victims. Here, text mining could be used to discover concepts about victims’ attitude about and perception of risk, leading up to the risk event (Dedobbeleer and Béland 1998). Knowing such psychographic factors will enable insurers to develop industry-specific, proactive behaviour management programs with their clients. Such programs could bring about paradigm shift in the approach to risk management;
• a further potential application is quality control of the application of incident codlings in reporting systems, and for development of new incident reporting and investigation business rules;
• further, in those cases where textual data is available from market research interviews with potential retail insurance customers, text mining can be used to discover consumers’ attitudes about, and needs for insurance. Such concepts can then be used for segmenting the retail market simultaneously for attitude and need, using conceptual clustering techniques. Such multi-dimensional market segmentation would enable insurance retailers to develop campaign offers which are much better matched to consumer needs and attitudes, than what is possible, for instance, with demographic segmentation approaches. Such campaign offers will result in better campaign response rates, and improved competitive advantage for insurers (Berry and Linoff 2004) Chapter 4;
• data mining has been proven as an effective tool in fraud detection and prevention (Phua, Lee et al. Submitted). Text mining is already being used in the insurance claims fraud discovery and prevention arena (Mailvaganam Accessed February 2005) (Ellingworth and Sullivan Accessed February 2005), and the researchers perceive an underutilised opportunity by the insurance industry. This entails mining unstructured textual data from claimants’ contact with the insurer. Such mining would be focused at discovering both known and new concepts from that data, upon which to base both proactive and remedial fraud management.
Future work
The researchers identify a number of issues which require further research. The first is researching the value of text mining in predicting other targets of interest to the insurance industry. Such other targets could be ‘number of days off work’, ‘cost of medical treatment’, or ‘exact claim pay-out amount’.
Further, research could extend the modelling time horizon about the target past the current three-month period, to for instance six months or even 12 months. This will enable insurers to accordingly extend their planning horizon about claims cost. Research about the utility of text mining for business rule development and fraud management could be valuable.
Research is also required into some of the opportunities identified in the previous section to:
• quantify the dollar benefits from improved capital management which is realisable from text mining;
• discover new risk factors or interactions between risk factors;
• use text mining as a psychographic profiling and segmenting tool; and
• quantify the monetary benefits from marketing campaigns based upon this psychographic approach compared to traditional marketing approaches.
Acknowledgements
The researchers acknowledge the contributions to this research of Michael Playford and Anne-Marie Feyer, both PricewaterhouseCoopers partners, for offering help and valuable insights; Dominic Roe, consultant PricewaterhouseCoopers, and Bianca Zubac, student UNSW for their assistance in project facilitation and data analysis; SAS Institute and SPSS, both for providing text mining software for the project as well as for assistance and guidance in using text mining software.
References
Berry, M. J. A. and G. S. Linoff, 2004, Data Mining Techniques for Marketing, Sales, and Customer Relationship Management, Indianapolis, Wiley.
Dedobbeleer, N. and F. Béland, 1998, Is risk perception one of the dimensions of safety climate? Occupational Injury: Risk, Prevention and Intervention. A.-M. Feyer and A. Williamson. London, Taylor & Francis: 73-81.
Ellingworth, M. and D. Sullivan, accessed February 2005, 'Text Mining Improves Business Intelligence and Predictive Modeling in Insurance',
http://www.dwreview.com/article_sub.cfm?articleId=6995.html. 2005. Feldman, R., 2003, Mining Text Data. The Handbook of Data Mining, N. Ye. London, Lawrence Erlbaum Associates: 481-517.
Feyer, A.-M., N. Stout, et al, 2001, 'Use of narrative analysis for comparisons of the causes of fatal accidents in three countries: New Zealand, Australia, and the United States', in Injury Prevention7: i15-i20.
Feyer, A.-M. and A. Williamson, 1998, Introduction. Occupational Injury: Risk, Prevention and Intervention. A.-M. Feyer and A. Williamson. London, Taylor & Francis: 1-3.
Hastie, T., R. Tibshirani, et al, 2001, The elements of statistical learning: Data mining, inference and prediction, New York, Springer-Verlag. Kolyshkina, I., D. Steinberg, et al, 2003, 'Using Data Mining for Modeling Insurance Risk and Comparison of Data Mining and Linear Modeling Approaches', in Intelligent and Other Computational Techniques in Insurance: Theory and Applications, A. F. Shapiro and L. C. Jain. London, World Scientific. Volume 6: 493-421.
Mailvaganam, H., accessed February 2005, 'Text Mining for Fraud Detection: Creating cost effective data mining solutions for fraud analysis',
http://www.dwreview.com/Data_mining/Effective_Text_Mining.html, 2005. Phua, C., V. Lee, et al. (Submitted). 'A Comprehensive Survey of Data Mining-based Fraud Detection Research.' Submitted.
Stout, N. (1998). 'Analysis of narrative text fields in occupational injury data', in Occupational Injury: Risk, Prevention and Intervention, A.-M. Feyer and


![The construction of a selection index combining a major gene and quantitative traits : [microform] a thesis presented in partial fulfilment of the requirements for the degree of Master of Agricultural Science in Animal Science at Massey University](data:image/gif;base64,R0lGODlhAQABAIAAAP///wAAACH5BAEAAAAALAAAAAABAAEAAAICRAEAOw==)