Editors
Mark O Brien1 and Thia Hennessy1
Jasmina Behan2, James Carroll3, Thia Hennessy1, Mary Keeney4, Carol Newman3, Mark O Brien1 and Fiona Thorne1
1 Rural Economy Research Centre, Teagasc, Athenry, Co Galway, Ireland. 2 Skills and Labour Market Research Unit, FAS, Clyde Rd, Dublin 4. 3Department of Economics, Trinity College Dublin, College Green, Dublin 2.
4 Central Bank of Ireland, Dame St, Dublin 2.
An Examination of the
contribution of off-farm income to the viability and
sustainability of farm households and the productivity
of farm businesses
Contents
Acknowledgements 3
Chapter 1 Introduction 4-7
Chapter 2
The Contribution of Off-Farm Income to the Viability of Farming in Ireland
8-37
Chapter 3 Is Off-Farm Income Driving On-Farm Investment? 38-49 Chapter 4 Understanding the Effects of Off-Farm Employment on Technical
Efficiency Levels in Ireland
50-62
Chapter 5 The Impact Of Agricultural Policy on Off-Farm Labour Supply 63-84
Chapter 6 Examining the role of Off-Farm Income in Insulating Vulnerable Farm Households from Poverty
85-147
Chapter 7 Assessing the Availability of Off-Farm Employment and Farmers’ Training needs
148-191
Chapter 8 Main Conclusions and Policy Recommendations 192-199
References 200-210
Project Outputs 211-212
ACKNOWLEDGEMENTS
The research team are grateful to the Department of Agriculture, Fisheries and Food for the provision of Research Stimulus Funding, without which this project would not have been possible. The research conducted during the course of this project drew from a number of data sources. The researchers would like to express their appreciation to Liam Connolly and the National Farm Survey team for the provision of data and the support provided in interpreting the data. Similarly, thanks are due to the Central Statistics Office of Ireland for providing access to the Quarterly National Household Survey, the Living in Ireland Survey and the Survey on Income and Living Conditions in Ireland (SILC). The researchers would also like to acknowledge the contributions of their colleagues in the Rural Economy Research Centre, FÁS, the Central Bank of Ireland and Trinity College Dublin and for the helpful comments received from them during the course of this project. Any errors or omissions in the final report remain the sole responsibility of the authors.
CHAPTER 1 INTRODUCTION
Mark O’ Brien and Thia Hennessy
Rural Economy Research Centre, Teagasc, Athenry, Co. Galway, Ireland.
The number of farm households in Ireland participating in the off-farm labour market has increased significantly in the last decade. According to the National Farm Survey (NFS), the number of farm households where the spouse and/or operator is working off-farm has increased from 37 per cent in 1995 to 58 per cent in 2007. The important contribution of non-farm income to viability of farm households is highlighted in the results of the Agri-Vision 2015 report, which concluded that the number of economically viable farm businesses is in decline and that a significant proportion of farm households are sustainable only because of the presence of off-farm income. Research conducted by Hennessy (2004) demonstrated that approximately 40 percent of farm households have an off-farm income and that almost 30 percent of the farming population are only sustainable because of off-farm income. Clearly, the future viability and sustainability of a large number of farm households depends on the ability of farmers and their spouses’ to secure and retain gainful off-farm employment. The Department of Agriculture, Fisheries and Food (DAFF) have recognised the importance of off-farm income to the sector and they have recommended that future policies focus on farm household viability in all its dimensions, including farm and off-farm income sources (2000).
The strong growth in the macro-economy in the 1990s and early 2000s led to a significant contraction in the number of unemployed and an enlargement of the labour market. Against the backdrop of this strong economic growth, farmers found it relatively easy to secure employment off the farm, most commonly in the construction and traditional manufacturing sectors. While unemployment still remains low in Ireland, government policy in recent years has tended to support the knowledge based economy concept and as a result the majority of job creation has tended to be at the higher skilled end of the employment spectrum. Such policy and economic developments may threaten the ability of farmers to secure and retain employment in the traditional sectors. It was in this context in 2006 that the
Department of Agriculture, Fisheries and Food provided funding through the research stimulus fund for a project examining the contribution of off-farm income to the viability and sustainability of farm households and the productivity of farm businesses.
This principal aim of the project was provide quality scientific based policy advice and recommendations on issues pertaining to farm viability, off-farm employment and the implications for the productivity of the farming sector. The main objectives of the project were to examine the contribution of off-farm income to farming, to project future numbers of part-time farmers and to explore the productivity effects of an increase in part-time farming. To deliver on these objectives, a number of tasks were carried out. These tasks are outlined in the following chapters;
1. Examining the contribution of off-farm income to the viability of farming 2. Investigating whether off-farm income is driving on-farm investment
3. Understanding the effects of off-farm employment on technical efficiency levels in Ireland
4. Examining the effect of decoupling on farmers labour allocation decision. 5. Examining the role of off-farm income in insulating vulnerable farm households
from poverty
6. Assessing the availability of off-farm employment and farmers training needs
What follows is the final report of this project, summarising the main findings of the research. The report is structured in a number of chapters relating to each project task. Chapter 2 presents a review of the number and types of farmers and farmers’ spouses with off-farm income. The chapter outlines the recent trends in the labour market in Ireland and in particular focuses on the types of off-farm employment taken up by farmers and their spouses. The chapter also presents a number of estimates of total farm income using a number of data sources. These estimates highlight the importance of off farm income to farm households.
The objective of Chapter 3 is to explore the contribution of off-farm income to the viability of the farm business; specifically the focus of the analysis is the link between off-farm income and farm investment. The hypothesis tested is; does off-farm
income drive on-farm investment? Economic models are developed to estimate the effect of off-farm income on the probability and level of farm investment.
Chapter 4 provides an insight into the effects of off-farm employment on technical efficiency levels in Ireland. An increase in the number of farmers working off the farm may have implications for the productivity of the farming sector. To date, relatively little research has been conducted in Ireland about the productivity of farms that are operated on a part-time basis. Internationally, the issue has been studied by Chavas and Aliber (1993) using stochastic frontier analysis. The recent Agri-Vision 2015 report recommended ‘that research be carried out on the socio-economic determinants of the productivity performance of Irish agricultural production so to inform our understanding of the sector’s competitive potential’. This chapter describes economic models that have been developed to measure the rate of technical change and efficiency on farms. In particular, the emphasis is on the efficiency of part-time farms relative to full-time farms.
Chapter 5 will contribute to a deeper understanding of the factors affecting the decisions to work off-farm and how those factors may change as a result of decoupling. In particular this chapter focuses on the impact of the recent decoupling policy reform on the incidence of part-time farming. Economic models are developed to estimate the impact of decoupling direct payments from production on the probability of a farmer working off farm.
Chapter 6 examines the role of off-farm income in insulating vulnerable farm households from poverty. Keeney (2005) has found a significantly higher risk of consistent poverty (relative income poverty plus a consideration of non-monetary deprivation) for rural households relying solely on the returns from farming. The objective of chapter 7 is to update this research and to explore whether low incomes in farm households are chronic or involuntary. The research reported in chapter 7 applies models of variance decomposition to ascertain the strategies that farm households can take to sustainably withstand the greater poverty risk of relying on farming.
Chapter 7 involves an assessment of the availability of off-farm employment and farmer training needs. The employability of farmers and their spouses is critical to
the future viability of farming. Concerns have been expressed about the employability of farmers, who typically tend to participate in vulnerable sectors and in low skilled positions. This chapter examines the education and skill profiles of farmers. These profiles are compared to labour market projections to assess the likelihood of farmers securing and retaining employment in a changing labour market. Where gaps are identified training recommendations are made.
The concluding chapter of the report summarises the main research findings and makes some policy recommendations.
CHAPTER 2
THE CONTRIBUTION OF OFF-FARM INCOME TO THE VIABILITY OF FARMING IN IRELAND.
Mark O’ Brien and Thia Hennessy
Rural Economy Research Centre, Teagasc, Athenry, Co. Galway, Ireland.
2.1 Introduction:
The reliance of farm households on non-farm income is a growing phenomenon in Irish farming. The Agri-Vision 2015 report (Dept of Agriculture and Food, 2004) concludes that the number of economically viable farm businesses is in decline and that a large number of farm households are sustainable only because of the presence of off-farm income. The results show that approximately 40 percent of farm households have an off-farm income and that almost 30 percent of the farming population are only sustainable because of off-farm income (Hennessy (2004)). This suggests that the future viability and sustainability of a large number of farm households is dependent on farmers and their spouses’ ability to secure employment off the farm.
The objective of this chapter is to review the contribution of off-farm income to the viability of farming. Issues addressed include:
1. 2. 3. 4. 5. 6.
Macroeconomic developments in Ireland over the last twenty years The number of farmers employed off farm
The number of spouses employed off farm Types of off farm employment
Measures of off-farm income
The contribution of off-farm income to the sustainability of Irish farm households
The chapter begins by reviewing changes in the Irish economy over the last ten years, identifying potential reasons for the increased proportion of farm operators and spouses participating in the off-farm labour market. We will then focus on the evolving agricultural sector, examining the farm, socio-economic and governmental
characteristics which may have influenced the increasing participation of farm households in the off-farm labour market and the contribution that this additional income makes ensuring the sustainability of the farm business. Finally, we provide an estimate of the total farm household income for the farms included in the 2004 National Farm Survey.
2.2 Review of Recent Trends
This section of the chapter presents an overview of the major developments affecting Irish labour markets for the last twenty years or so. This information helps to provide context to the changes in farm labour and especially the increasing participation of farmers in the non-farm labour market.
2.2.1 The Irish Economy
The Irish economy was transformed during the 1990s and a period of exceptional growth was experienced (Figure 2.1). During the 1990s the Irish economy experienced a series of favourable demand-side shocks, emanating from exchange rate and interest rate developments, the global economic boom, and increased mobility of foreign direct investment and its increased sensitivity to tax differentials. The dramatic response to these developments was facilitated by a set of favourable supply side developments: an elastic labour supply underpinned by a strong demographic situation; the growing stock of human capital due to rising levels of educational attainment in the inflow to the labour force; wage moderation induced by centralised wage bargaining and declining union power; a reduction in the tax wedge on earnings; a fall in the unemployment replacement ratio; and a stricter approach to unemployment benefit claimants (Walsh, 2004). The juxtaposition of so many favourable demand and supply side developments created what was known as the ‘Celtic Tiger’.
Figure 2.1: GDP Volume change as % (1995-2007)
1995 1996 1997 1998 1999 2000 2001 2002 2003 2004 2005 2006 2007
Source: CSO
A key feature of this exceptional growth was the unprecedented employment boom. This reduced the unemployment rate, raised the participation rate, and reversed the outflow of population from the country. The resultant increase in the employment rate played a large part in Ireland’s belated, but very rapid, catch-up in living standards with the leading economies.
Figure 2.2: Unemployment Rate (1983 to 2007)
1 8 16 14 12 10 % 8 6 4 2 0
Source: CSO (Labour Force Survey and QNHS)
The impressive rate of employment growth led to a reduction in the unemployment rate from 16% to 4% between 1988 and 2007 (Figure 2.2). Between 1986 and 2003 total employment grew by 60 per cent, with non-agricultural employment, and in particular private sector employment, growing at a faster rate of 80 per cent. Over the same period, labour force participation rates rose markedly and emigration was
4 2 0
replaced by a rising net inflow of population. The improvements in labour market outcomes were widely spread across regions, age groups, and educational levels. Employment in agriculture and the traditional industrial sectors continued to decline but rapid employment growth occurred in newer manufacturing sectors such as electronics, pharmaceuticals and medical instrumentation, construction, tourism and internationally traded financial sectors.
2.2.2 Sectors of Employment
It is evident from Figure 2.3 that the agricultural sector has declined in terms of its contribution to total employment in Ireland. In the 1960s, even before accession to the EU, there was significant restructuring in the Irish economy away from agriculture towards industry and services. Between 1960 and 1973 the share of agriculture in GDP fell from 25 to 19 percent. This decline continued in subsequent years, so that by 1998 agriculture accounted for only 6 per cent of total value added, in comparison to the 53 percent share by services (Kennedy, 2001). In 1973 agriculture (farming sector) accounted for 24 percent of total employment compared to approximately 5 percent in 2006. Simultaneously, the numbers working in the services sector has grown from under half a million in 1973 to almost 1.2 million in 2003, a total increase of over 700,000 persons. In 2006, approximately two thirds of the working population were employed in the Services sector.
Figure 2.3: Comparisons of Employment by Sector (1973 & 2006)
Source: National Income and Expenditure, various issues; ESRI Quarterly Economic
Commentary, December2000; data compiled for the ESRI Medium-Term Review 1999-2005
Most of the employment growth experienced in Ireland occurred in newer sectors such as electronics, pharmaceuticals, and medical instrumentation where foreign-
1 9 7 3 Agriculture Industry Services Agriculture Industry Services
owned firms account for over 90 per cent of output. However, these sectors were badly affected by the slowdown after 2001, leading to an overall decline in manufacturing jobs. According to the 2006 census, manufacturing as a whole accounted for 12 per cent of total employment, compared with almost 20 per cent in the mid-1980s. Employment in construction has more than doubled since the early 1990s, increasing at the fastest rate of any sector. In 2007, it accounted for 13 per cent of all employment (CSO; QNHS Quarter 4), compared with 8 per cent in 1997. Employment in the publicly financed health and educational services has also increased quite rapidly, especially in recent years, but the numbers in core public administration have been contained.
2.2.3 Women in the Workplace
Against the backdrop of strong growth, the economy also benefited by the increasing level of female participation in the labour market. In 1983, only one-third of Irish women were in employment. The share has increased from 34 per cent in 1991 to 37 per cent in 1996 and then to approximately 55 per cent in 2007.
Empirical Research in Europe has found that re-entry to the workforce and length of leave is strongly related to women’s human capital in the form of education and accumulated work experience (Macran et al., 1996; Jonsson and Mills, 2001a; Blossfeld and Drobnic, 2001) and family–cycle characteristics, such as age, number of children and age of mother at birth (Blossfeld and Drobnic, 2001).
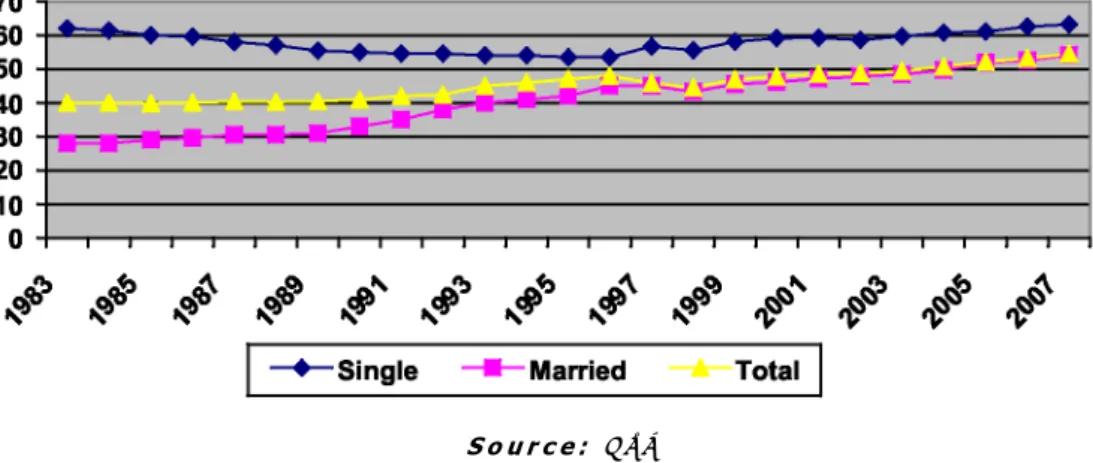
Figure 2.4: Female Participation Rates in Ireland (1983-2007)
In 1990, 55 per cent of women aged between 20 and 40 were in the paid labour force, whereas by 2000 it was just under 70 per cent. In addition, in 1990 4 per cent of women in that age group were students compared to 10 per cent in 2000. In the five years 1995-2000, the single biggest factor underlying the rise in labour supply was increased female participation - contributing 1.5 percentage points a year to the growth in the potential output of the economy.
The increasing labour force participation of women is partly due to equality legislation, but mainly due to improving economic conditions and flexible working patterns. In 1973, there were 287,800 females in employment, representing 27 percent of total employment. In the thirty years since 1973, female employment grew by 464,000 while male employment grew by less than 262,000. According to Quarterly National Household Survey, in 2007 females accounted for over 43% of the numbers at work. As shown in figure 2.4 most of the increase in female participation comes from more married women in the workplace, which is due to a reverse of the traditional trend of women leaving the labour force on marriage.
Figure 2.5: Female labour force changes (1997-2007)
Source: ’analysis done by Teagasc/FÁS using the CSO; QNHS’
The most notable change of interest in this study is that the number of women employed in the agriculture, forestry and fishing sector has declined by 25% between 1997 and 2007 while there has been significant increases in female participation rates in the education, wholesale and retail trade, financial and other
100 80 60 40 20 0 -20
Agriculture, forestry and fishing Construction
Hotels and restaurants
Financial and other business services Education
Other services
Other production industries Wholesale and retail trade
Transport, storage and communication Public administration and defence Health
business services and health sectors (Figure 2.5).
The decline in female participation in farm employment is substantiated by the increasing numbers of farmers’ spouses participating in the off-farm labour market. In 1995, 15 per cent of farmer’s spouses had off-farm employment, this trend has continued to grow and by 2006, 35 per cent of farmer’s spouses were participating in the off-farm labour market.
This decrease in female participation in the farm labour market may be a result of the pull factors of higher salaries and better working conditions in the non-agricultural sector or the push factor of the poor economic outlook for farming.
2.2.4 Education
The factors pertaining to the strong economic growth experienced by Ireland in the 1990’s have been outlined in the previous section. The economy transformed from being characterised as a labour surplus economy as evidenced by high unemployment rates to a situation of excess demand for labour which heralded increased participation rates by females. The growing stock of human capital due to rising levels of educational attainment in the inflow to the labour force may also have had a profound influence on the demand for labour in that it proved an attraction to foreign enterprise, which in its absence might have chosen another location (Kennedy, 2001).
The move towards a more knowledge based economy has been facilitated by the increasing level of third level educational attainment and the increasing levels of female participation in the Irish labour market. Ireland has experienced substantial increases in participation in higher education since the 1960s. It has been argued that the expansion in educational participation, at both second and third level, has been one of the main factors underlying Ireland’s rapid economic growth during the 1990s (Fitzgerald, 2000).
The national rate of admission to higher education was 54 per cent in 2003 (Figure 2.6), which means that 54 percent of school leavers continued in fulltime education. This is an increase of 10 points on the 1998 admission rate of 44 per cent. Indeed,
admission rates have increased to such an extent that the rate of admission in 2003 was more than twice the 1980 rate.
Figure 2.6: Trend in Admission Rates to Higher Education, (1980-2003) % 60 50 40 30 20 10 0 1980 1986 1992 1998 2003
Source: HEA; WHO WENT TO COLLEGE IN 2004? A NATIONAL SURVEYOF NEW ENTRANTS TO HIGHER EDUCATION.
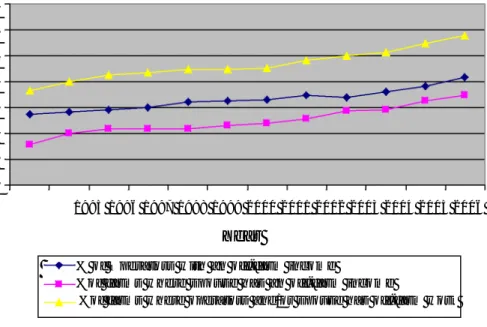
The data presented in Figure 2.7 confirms the trend of increasing numbers of people pursuing further education with the numbers with a third level qualification almost doubling between 1999 and 2005.
Figure 2.7: Persons aged 15 to 64 years with a third level qualification (‘000s) 800 700 600 500 400 300 200 100 0 Males Females Total 1999 2000 2001 2002 2003 2004 2005
Source: ’analysis done by Teagasc/FÁS using the CSO; QNHS Module on Educational
Attainment, 2002-2005’
It has been argued that the rapid development of Irish society over the past four decades entailed a process of occupational upgrading to meet the skill needs of a rapidly modernising economy. As a consequence, educational credentials have come to assume major importance in determining the economic prospects of individuals
(O’Connell, 2000). The importance attached to the attainment of a third level educational qualification is evident from Figure 2.8. The unemployment rate for those aged 25-64 with a degree or above is just 1.8 percent compared with 7.4 percent for persons whose highest educational attainment level was primary or below.
Figure 2.8: Unemployment rate of persons aged 25 to 64, classified by the highest level of education attained, 1999 to 2005
1 2 1 0 8 6 4 2 0
Source: ‘analysis done by Teagasc/FÁS using CSO; QNHS, Module on Educational
Attainment, 1999-2003, 2002-2005’
2.2.5 Conclusion
The economic growth experienced in the 1990s resulted in Ireland’s transformation from being traditionally characterised as a labour surplus economy where the unemployment rate was held in check only by emigration, low labour force participation rates, and a continued reliance on subsistence farming to one of excess demand for labour, as witnessed by the significant decrease in unemployment rates in the 1990s. As stated by Kennedy (2001), the growth in human capital stock, as evidenced by increasing levels of educational attainment, had a significant influence on the demand for labour by attracting foreign enterprises. The excess demand for labour resulted in increased labour force participation rates by females and led to a restructuring of the labour market.
Section 2.3 analyses how economic growth has affected the agricultural sector, identifying the numbers employed in the agricultural sector and analyses the
economic status of the farming population represented in the 2004 National Farm Survey (NFS).
2.3 The Farm Economy
The total number of farms in Ireland has been decreasing by approximately 2 percent per year for the last decade or so. The most recent statistics show that there were approximately 130,000 farms in Ireland in 2002 (CSO 2002). The farming population of 130,000 farms is comprised of both full and part-time farms.
Here we classify the farming population according to their economic status. Farms are classified as being economically viable businesses. An economically viable farm is defined as one having (a) the capacity to remunerate family labour at the average agricultural wage, and (b) the capacity to provide an additional 5 per cent return on non-land assets, (Frawley and Commins 1996). Farms that are not economically viable but where the farmer and/or spouse participate in off-farm employment are classified as sustainable. Although these farms are not economically viable as businesses, the farm household may be sustainable in the longer term due to the presence of an farm income. Non-viable farms where neither farmer nor spouse is involved in off-farm employment are considered economically vulnerable. Due to the poor economic return on these farms and the lack of any other gainful activity, the farm business is unlikely to be sustainable in the longer term. The economic status of the 2006 farming population is presented in Figure 2.10.
Figure 2.10: Viability of Farming in 2006
S o u r c e : N F S , 2 0 0 6
Viable Sustainable Vulnerable
% 60 70 50 40 30 20 10 0
The National Farm Survey in 2006 comprised of 1,159 farms representing 113,100 farms nationally. In relation to these farms, 30 per cent were classified as economically viable, 40 per cent were sustainable and 30 per cent were vulnerable. These figures indicate that without the contribution of off-farm employment to the farm household income, 40 per cent of the farming population would be in a vulnerable position, in addition to the 30 per cent already in this category. However, the variation in the economic status of farms is more apparent when analysed with respect to the systems of farming.
The specialist dairy system has the highest percentage of economically viable farms with 58 per cent. The cattle farming systems have the fewest viable farms. While there is a significant difference across farming systems the importance of off-farm income to the sustainability of farm households in general is evident.
The analysis of the total farming population shows that 70 percent of farm households would be in an economically vulnerable position if it were not for the presence of off-farm income. Clearly, off–off-farm income has assumed an integral role in ensuring the sustainability of farm households.
2.3.1 Off-Farm Employment
This section will address the increasing trend of farm households’ participation in the off-farm labour market. Increasing non-farm wages and restricted farm incomes have affected the relative earnings from activities on and off the farm and thus have resulted in increasing numbers of farmers working off-farm (Keeney and Matthews, 2000). In 1995, Teagasc’s National Farm Survey (NFS) recorded that on 36.5 percent of the farms sampled (1,201) the farmer and/or spouse had an off-farm job. By 2006, this figure had increased to over 58 percent.
From figure 2.11, we can see that in 1995, 26 percent of farm operators were engaged in off-farm employment and this figure has risen to a little over 40 percent by 2006. For the spouse, growth in off-farm employment has been even more dramatic growing from 15 percent of spouses in 1995 to 35 percent in 2006. These trends mirror the general macroeconomic trend in relation to female participation. The percentage of households with at least one off-farm income source i.e. either
the farmer or the spouse or both are employed off the farm, has risen from 36 percent in 1995 to 58 percent in 2006 across all farm systems.
Figure 2.11: Off-farm employment status (1995-2006)
70 60 50 % 40 30 20 10 0 1995 1996 1997 1998 1999 2000 2001 2002 2003 2004 2005 2006 Year S o u r c e : D e r i v e d f r o m T e a g a s c , N F S 1 9 9 5 - 2 0 0 6
The sectors associated with providing off-farm employment opportunities for farm households are recorded by the NFS. Statistics show that operators who work off the farm tend to be employed in the more “traditional” sectors of the economy such as, agriculture (20%), construction (20%) and manufacturing (10%). The positions most commonly held by farmers include building tradesmen, labourers, drivers or machine operators.
With regards to the off-farm occupations of farmers’ spouses, the data shows that a significant share of them are employed in a professional, associate professional and clerical capacity. Results from the National Farm Survey of 2006 show that 25 per cent of the spouses participating in the off-farm labour market are employed in clerical duties. More than 29 per cent of spouses are nurses or teachers; this is an increase of approximately 5 percentage points on 2002 figures. There are also a significant number (8%) of spouses employed in the domestic services industry. Over 3 per cent of spouses work in hotel and catering related activities, either as proprietors of lodging and catering establishments or as workers, a decrease of 4 per cent on 2002 figures, while in excess of 5 percent are employed in the retail sector.
% of Operators w ith an off-farm income
%of farms w here spouse has an off-farm income
As outlined previously, there have been increasing participation levels in the off-farm labour market by farm households. The off-farm income earned has assumed an important role in the sustainability of farm households. Given the buoyancy of the macro economy in recent years, off-farm employment opportunities have been readily available for operator and spouse alike. However, it is important to consider the longer-term prospects for off-farm employment, which will be discussed in Chapter 7.
2.4 Theoretical Drivers of Off-Farm Employment:
This section of the chapter examines the increasing phenomenon of part-time farming from a theoretical viewpoint by reviewing literature and identifying the factors that may be driving this trend.
An extensive literature has evolved that investigates the determinants of farm household involvement in nonfarm labour markets. A number of studies have considered various demographic factors relevant to participation in off-farm labour markets, including age, household size, experience, and the presence of small children in the household (Goodwin and Holt; Huffman and Lange; Lass and Gempesaw; and Sumner). In addition, a number of farm characteristics have been shown to be relevant to the degree of participation in off-farm labour markets. One of the principal theories used to describe farmers’ labour allocation decisions is the theory of time allocation.
2.4.1 Theories of Time Alocation
In his seminal paper, Becker (1965) assumed that households behave to maximise the household’s utility function defined over consumption commodities and that their time is allocated between work and leisure so as to maximise that utility function. The allocation of farm labour can be modelled using an agricultural household model that integrates agricultural production, consumption and labour supply decisions into a single framework and operates to maximise Becker’s utility function. The agricultural household model developed by Singh, Squire and Strauss (1986) has been frequently applied to the study of labour allocation (for example, Huffman and Lange, 1989; Gould and Saupe 1989; and Weersink et al 1998).
If we consider the labour allocation decision from a farm operator’s perspective only, then we assume that the farm operator maximises his utility function, U, which, drawing from Becker (1965), is derived from purchased goods, G, and leisure, L, and is affected by environmental factors, E, such as age, which are assumed to be exogenous to current consumption decisions.
U=U(G,L;E) (2.1)
Utility is maximised subject to constraints on time, income and farm productivity. The farmer has a fixed amount of time, T, which can be allocated to either leisure or work, which consists of time spent on the farm, TF, plus the hours spent on off-farm work, TO. It is normally assumed that time allocated to leisure and farm work is positive but for some individuals the time allocated to non-farm work may be zero, hence the inequality in equation 2. Thus the time constraint can be expressed as:
T=TL+TO +TF TO~0 (2.2)
The consumption of market goods at the price PG is limited by the amount of available income earned from farm profits, off-farm wages, and other exogenous household income, V. Farm profit is equal to the price of farm output, P, multiplied by output, Q, less variable costs of production, RX, where R is the input price vector and X is the quantity of inputs used. Off-farm income is the product of the wage rate, W, and the hours worked off-farm, TO. The budget constraint is therefore:
P.Q- R.X+ W.TO + V=PG.G (2.3)
The technology available to produce farm output represents the final constraint to the household:
Q=f(F,X;ZF, H) (2.4)
where f(·) is a strictly concave production function and Z
F is a vector of exogenous farm specific characteristics. Human characteristics are included in the production function to account for the increased efficiency assumed to be related to factors such as age and formal education. These same human capital variables will also influence the off-farm earning potential of the farmer along with other market conditions, Z, which implies that the wage rate should be expressed as:
W=W(H,Z) (2.5)
Drawing from the neo-classical labour theory, the framework assumes that anindividual maximises utility by choosing hours of farm labour, off-farm labour and leisure so that at the optimum, the marginal utilities of these hours are equal. The decision to participate in off-farm employment is binary. Rational individuals are expected to participate when the off-farm wage offered exceeds their reservation wage. This can be expressed as follows,
E[I¦X]=P(O
i=1)=P(w
r<w
i)=ß’X (2.6)
where
P(O
i= 1)
is the probability ofO
i= 1,
that is participating in off-farm employment, which occurs ifw
r<w
i,
that is the reservation wage rate is less than thewage offered off-farm. The probability of participating in off-farm work is estimated using a vector of exogenous variables
X
that are hypothesised to influence the latent reservation wage and off-farm wage rates and therefore the participation decision. Variables that increase the off-farm wage rate relative to the reservation wage increase the probability of off-farm work and the opposite is true for variables that decrease the off-farm wage rate (Huffman, 1988).The agricultural household model outlined the factors that theoretically influence the off-farm employment decision. In the following section of the paper some of these factors are outlined in more detail.
2.4.2 The Effect of Farm Household Characteristics
Theoretically, farm household characteristics such as the presence of children and other family members, the size of the family and other sources of income have been incorporated into the agricultural household model through their effect on the budget constraint.
In theory, if the household is comprised of a significant number of young children, this increases the demand for consumption and subsequently increases the pressure on the budget constraint. Therefore, this increases the necessity to allocate more time to off-farm employment activities so as to generate more income. If the off-farm household is composed of older children, then this may increase the farm labour supply and reduce the demand on the farmer’s labour time. Empirically, the presence
of children and other household members has been shown to significantly affect both the off-farm participation decision and off-farm hours supplied by the farm operator and spouse (Sumner, 1982, Lass et al, 1989). Mishra and Goodwin (1998) state that the presence of children under the age of thirteen years in the household significantly reduces the supply of off-farm labour. Lass, Findeis and Hallberg (1991) state that this effect is typically confirmed for the spouse but in relation to the operator, on the one hand, childcare may require a husband’s time, but on the other, the presence of more children may generate higher pressure for obtaining additional income to meet the consumption needs of a larger family.
Family size generally has a significant impact on the off-farm participation of operators and spouses. According to Woldehanna, et al. (2000), households with a larger family size have a relatively higher marginal utility of income and a stronger desire to participate in off-farm work. Therefore, the increasing number farmers’ spouses participating in the off-farm labour market (increased by 17 per cent between 1995 and 2007) may be due to pressure on the budget constraint caused by the size of the family household.
2.4.3 The Effect of Household Wealth
An increase in the farm household income from sources other than labour income is hypothesised to relax the budget constraint and reduce the probability of farm households participating in the off-farm labour market. Wealthier farm households may be less likely to seek off-farm jobs for two main reasons. First, wealthier households may be less risk averse relative to poorer ones, which may reduce their incentives to seek a more stable source of income other than farm earnings. In this context wealth represents a form of self insurance. Second, wealth may be a source of non-labour income (e.g., interests, dividends, rents, etc.), which may further reduce incentives to work off the farm.
The effect of sources of exogenous wealth such as non-labour income, social transfers and other income on the farm households’ decision to participate in the off-farm labour market, have been tested empirically by Huffman and EL Osta (1998). These alternative incomes increase the net farm income, inflating the marginal value of farm labour, which determines the reservation wage that must be exceeded
before an off-farm job is considered, thereby reducing the probability of off-farm participation (Serra et al, 2003).
2.4.4 Policy
The implementation of agricultural policies may also affect the income of farm households and may determine whether members of the farm household participate in the off-farm labour market. The Luxembourg Agreement on reform of the Common Agricultural Policy (CAP) has allowed for the decoupling of all direct payments from production from 2005 onwards. Decoupling payments are fixed income transfers that do not subsidize production activities, inputs, or practices. To date, in Ireland, most direct payments have been coupled to production, and therefore farmers were required to grow crops or stock animals to qualify for support. Decoupled payments can be considered as a source of non-labour income or exogenous household wealth, represented by V in equation 2.3 in the earlier discussion of the household model. As they are not linked to labour activity, it follows then that replacing coupled payments with decoupled payments is likely to affect the relative return to farm work and is likely to result in two conflicting effects. Burfisher and Hopkins (2003) suggest that if an individual receives an increase in non-labour income, i.e. wealth, the household budget constraint is relaxed and the individual can work less and enjoy more leisure while maintaining consumption that is a move to a higher indifference curve. On the other hand however, decoupled payments are likely to change the relative returns to farm and off-farm labour. If the returns to farm labour decrease relative to non-farm labour, the household model suggests, that the individual will increase the number of hours allocated to off-farm labour. This is referred to as a substitution effect. Therefore, decoupling is likely to result in both a wealth and substitution effect, whichever effect is greater will determine the impact of decoupling on labour allocation. The effect of decoupling on the labour allocation decision of Irish farm operators will be investigated in chapter 6 of this report.
2.4.5 The Effect of Human Capital
The most common human capital variables used in previous empirical studies on off-farm labour participation have been age and education. In the context of the agricultural household model, age can influence the time allocation decision as it affects the returns to both farm and non-farm labour through human capital effects.
Many models have supported the hypothesis of a life cycle effect (Huffman 1980 and Sumner 1982), which contends that individuals will increase their work effort in earlier years in order to accumulate assets to draw on later in life. Previous research has found that older farm operators are less likely to work off the farm, which may reflect differences in attitudes regarding work that are correlated with age (Mishra and Goodwin 1998).
Although education would be expected to enhance farm and off-farm productivity, one might expect that increased education raises individuals’ human capital stock, which has a positive impact on potential market earnings, thereby raising the relative wages off-farm compared to on farm (Goodwin & Holt, 2002). Orazem and Mattila (1991) have shown that schooling produces occupational specific human capital and that the returns to schooling are higher for non-agricultural occupations. Hence, higher levels of schooling, in particular non-agricultural related schooling, would be expected to influence the probability of entering full-time farming negatively, but may influence the decision on part-time farming or the choice of a non-farming occupation positively. With regards to Ireland, there has been a significant increase in the third level education participation rates, the rates of admission have doubled since the 1980s with 54 per cent of school leavers continuing in full time education. O’ Connell et al (2006) have shown increased that third level participation rates of farm operators children have increased significantly between 1998 and 2004. In 2004, 12.4 per cent of new entrants to higher education were from the socio economic group of farming. Therefore, the increased levels of educational attainment raises human capital stock and raises the relative off-farm wages compared to the farm income and decreases the likelihood of entering full time farming.
2.4.6 The Effect of Farm Characteristics
Another important element of the farm household model is that farming provides an income source: the higher the farm income the lower the need for off-farm income to satisfy the budget constraint. Previous studies note the impact of different farming systems on the decision to work off the farm (Sumner 1982; Lass et al 1989, Gould and Saupe 1989). The reason for such a specification is that farming systems that are labour intensive will be less likely to have operators involved in off-farm employment. The profitability of farming systems also assumes an important role in the decision to participate in the off-farm labour market. For example, in Ireland
specialist dairy farms tend to have the lowest probability of farmer participation in off-farm employment.
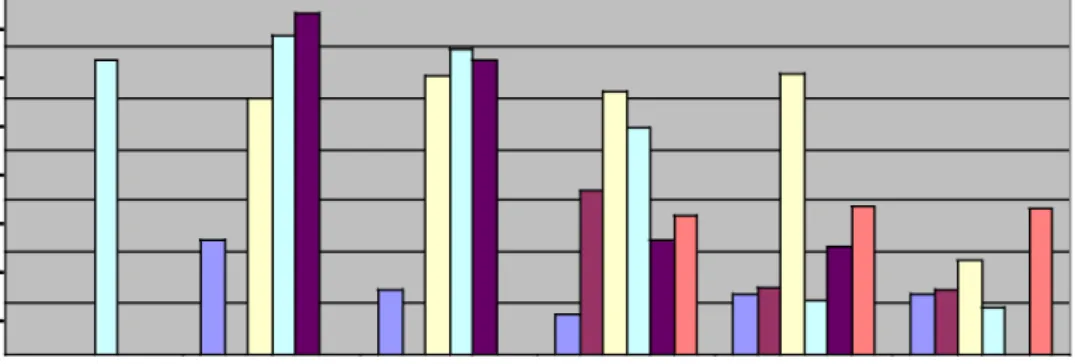
Figure 2.12 shows the stark contrast between systems in terms of the percentage of operators involved in off-farm activities. The figure shows that there has been an increase in the levels of off-farm participation across all farming systems, with the exception of the dairying and other system since 1995. It is evident from the diagram that the cattle rearing system has a larger proportion of farms with off-farm employment than any other system. The systems with the lowest percentage of farms with off-farm employment were the specialist dairying (14.1 per cent) and the dairying and other system (13.8 per cent), these are the most labour intensive systems requiring a larger allocation of time and subsequently resulting in less hours allocated to off-farm employment.
Figure 2.12: Off-Farm Employment by System of Farming
60 50 40 % 30 20 10 0 1995 1996 1997 1998 1999 2000 2001 2002 2003 2004 2005 2006 S o u r c e : D e r i v e d f r o m T e a g a s c , N F S 1 9 9 5 - 2 0 0 6
Many authors contend that the larger the farm, the lower the probability that a farmer works farm. Mishra and Goodwin (1997) found a negative correlation between off-farm jobs and off-farm acreage. However, Mishra et al (2002) found that dual careers are often pursued even in households operating very large farms.
In relation to the sample of farms which participated in the 2006 NFS, it is evident from Figure 2.13 that as the farm size increases, the number of farmers with off-
specialist dairy cattle and other
dairying & other mainly sheep
cattle rearing ti llage
farm employment decreases. This is apparent, in particular, in the dairying and dairying and other farming systems, where the percentage engaged in off-farm employment decreases from a high of 22% (dairying) with a farm size of 10-20 U.A.A. to 12% with a farm size in excess of 100 U.A.A. The system of farming most consistent with off-farm employment over all farm sizes is cattle rearing, where there are high numbers engaged in off-farm employment irrespective of the size of the farm.
Figure 2.13: Off-farm employment by size and system of farming:
70 60 50 % 40 30 20 10 0 <10 10-20 20-30 30-50 50-1 00 >100 S o u r c e : N F S 2 0 0 6
2.4.7 The Effects of Local Labour Markets
Local labour market characteristics theoretically affect the off-farm income earnings in the agricultural household model. If the local unemployment rate is high, the relative off-farm wages decrease compared to the farm wage, which results in less hours worked off the farm. Tokle and Huffman (1991) state that the labour force participation decisions of households are also affected by changes in anticipated local economic conditions. For farm households, the probability of wage work increases when expected farm output prices decline and decreases when local labour demand grows.
2.5 Measures of Non-Farm Income
It is evident that there has been an increasing trend of farm households participating in the off-farm labour market. Off-farm income now plays a vital role in ensuring the sustainability of farm households. To assess how reliant farm households are on off-
farm income, we need to gauge the contribution of this source of income to the total farm household income. In order to address this issue, we need to estimate the off-farm income for the operator and/or spouse participating in the off-off-farm labour market.
Household income is defined by the CSO “to include all money receipts of a recurring nature which accrue to the household regularly at annual or more frequent intervals, together with the value of any free goods and services regularly received by household members and the retail value of own farm or garden produce consumed by the household.” (CSO, 2002; 63) Taking this definition we define gross household income as the gross income of all household members from all sources, including the farm income, other earned and non-earned income, together with state transfers.
Figure 2.14: Components of farm household income
S o u r c e : O E C D , 2 0 0 3
Farm households derive a significant share of their income from sources other than farming. In 2007, approximately 58 percent of farm households had an operator and/or spouse with off-farm employment and 40 percent of farms were only sustainable due to the presence of an off-farm income source. However, in order to reflect the income situation of farm households, all sources of income should be taken into account. According to the OECD (Figure 2.14), total farm household income consists of farm and off-farm income. Off-farm income comprises of gross wages and salaries, property income, social transfers and other income, while farm
+ Gross wages and salaries + Property income + Social transfers + Other income Farm income + Off-farm income Disposable farm household income --Taxes and mandatory contributions Total farm household income + Market receipts + Budgetary payments + Other receipts Gross receipts --Cash expenses Net operating income --Depreciation Farm income
income is defined as gross output less total net expenses. In this section we will use three data sources to estimate total farm household income. Initially, the data sources will be outlined before discussing the advantages and disadvantages of each in relation to the estimation of total farm household income. Finally, an estimate will be provided incorporating the differing data sources.
1) EU-SILC: The Survey on Income and Living Conditions (SILC) is an annual survey conducted by the Central Statistics Office (CSO) to obtain information on the income and living conditions of different types of households. The survey also collects information on poverty and social exclusion. A representative random sample of households throughout the country is approached to provide the required information. The survey is voluntary from a respondent’s perspective. The 2006 sample comprised of 14,634 individuals and 5,836 households.
2) Household Budget Survey (HBS): In the HBS, data is collected in both cross-sectional (pertaining to a given time in a certain time period) and longitudinal (pertaining to individual-level changes over time) dimensions. Therefore, certain households will be surveyed on an annual basis. In 1999-2000, 7,644 households participated in the HBS. This represented a response rate of 55% which was somewhat below the rate achieved in the 1994-95 HBS. The main purpose of the HBS is to determine in detail the current pattern of household expenditure in order to update the weighting basis of the Consumer Price Index. The maintenance of a detailed diary of household expenditure over a two-week period by the surveyed households is thus the main distinguishing feature of the HBS. Detailed information is also collected on all sources of household income and on a range of household facilities.
3) National Farm Survey (NFS): The objectives of the National Farm Survey (NFS) are to
1. Determine the financial situation on Irish farms by measuring the level of gross output, costs, income, investment and indebtedness across the spectrum of farming systems and sizes,
2. Provide data on Irish farm incomes to the EU Commission in Brussels (FADN), 3. Measure the current levels of, and variation in, farm performance for use as
standards for farm management purposes, and
4. Provide a database for economic and rural development research and policy analysis.
To achieve these objectives, a farm accounts book is recorded for each year on a random sample of farms, selected by the CSO, throughout the country.
The National Farm Survey is designed to collect and analyse information relating to farming activities as its primary objective. Information and data relating to other activities by the household are considered secondary and as such where this information is presented it should be interpreted with caution. For 2007, there are 1,151 farms included in the analysis, representing 111,913 farms nationally.
2.5.1 Advantages and Disadvantages of Each Data Source:
The EU-SILC provides detailed information with regard to the off-farming activities of farm operators, which makes it easier to provide an estimation of off-farm income. However, unlike the NFS, it does not provide detailed information regarding the farming activities of farm households. The farm household income is calculated using the broad definition of a farm household, which is defined as farm households (including those in urban areas) that have an income from farming. It also provides information pertaining to non labour income, social transfers and other direct income. A potential problem with the EU-SILC is that the questionnaire is completed on a voluntary basis and only 520 questionnaires were collected in 2004. Therefore, there are question marks over the integrity of the farm household income estimates.
The National Farm Survey (NFS) produced annually by Teagasc provides estimates of family farm income for different categories of farms. While the NFS collects valuable data in relation to the farm, socioeconomic and demographic characteristics pertaining to the farm operator employed on the farm, it provides limited information regarding off-farm occupations of farm operators/spouses. The off-farm income
earned by operators are allocated to income ranges, however, there is no information relating to off-farm income earnings by spouses. Therefore, it is difficult to provide a precise approximation of off-farm income. The NFS also does not collect information pertaining to non labour income, social transfer payments or any other direct income, thus an estimate of total farm household income is unattainable.
The Household Budget Survey (HBS) provides estimates of the total income of farm households. Primarily designed as an expenditure survey, there are issues relating to the reliability of the income data; however it can still be useful for comparison purposes if the degree of income under-reporting is assumed the same for farm and non-farm households. The advantage of the HBS over the NFS is that it provides information on both the farming and off farm activities of the farm household, incorporating socioeconomic variables such as education levels of operator/spouse which are not collected by the NFS. The farms included in the data are the same farms as the NFS and farm data is provided by Teagasc, the main disadvantage of the HBS is that it is only undertaken every four years.
In analysing the data one of the issues of concern is the classification of farm households. This is a concern, as many farm households only derive a small proportion of their income from farming. Following on from these concerns the CSO have provided two sets of analysis, one based on a broad definition of farm households, which is outlined in the previous section, and another based on a narrow definition. The CSO’s Household Budget Survey used a narrower approach to define farm households. It defines a farm household as a household in which the head of the household is a farmer or the head of the household is a retired farmer and there is at least one other farmer in the household. This definition would exclude part-time farmers who have another major occupation and who are not living with a retired farmer. This makes it difficult to estimate off-farm income.
2.5.2 Estimating off-farm income
In the absence of a data source that comprehensively records total farm household income every year, an alternative is to use the information collected by the NFS on non-farm activities to estimate the non-farm income arising from those activities. The NFS survey provides a list of 37 off-farm employment occupational categories. It also provides information on the number of hours worked off the farm for both the
operator and spouse and the various ranges of off-farm income earned by the operator. However, the difficulty with providing an estimate of the farm households off-farm income using the NFS sample is that there is no information with regards to the ranges of off-farm income earned by spouses. Therefore, we have provided an estimate of the off-farm income for the farm households participating in the off-farm labour market by multiplying the earnings per hour for the various off-farm occupations by the number of hours worked off the farm provided by the NFS. The earnings per hour estimates for the different off-farm occupations have been extracted from various data sources which can be found in Appendix 2A of the Appendix section1.
Table 2.1 provides a comparison of the estimated off-farm income of farm households using the EU-SILC and NFS data. The EU-SILC estimates have been ascertained from the annual review 2005/2006 published by the Department of Agriculture and Food and are contrasted against the estimate we have provided encompassing the NFS 2004 data.
Table 2.1: Estimates of Farmhousehold income
EU-SILC HBS NFS
Farm Income €14,382 €18,320 €25,019
Non-farm employment €21,692 €14,369 €13,629
Other Direct In come €806 €930 n/a
State Transfers €6,825 €6,228 n/a
Gross Income €43,704 €39,847 €38,648
Source: Annual Review 2005/2006, Dept of Agri & Food, NFS 2004
The off-farm income estimates provided by the Annual Review are calculated based on the broad and narrow definition of a farm household, the latter which is used by the HBS and which has been described in the previous section. From the table it is evident that there is a considerable difference between the family farm incomes generated using the two datasets. The difference could be contributed to the size of
1 The problem with using different sources is that there may be issues concerning the
the samples included in the two datasets. The EU-SILC consisted of 520 completed farm questionnaires in contrast to the NFS which encompassed 1,194 farms.
The EU-SILC estimate of farm income is calculated by taking the average income for farm size and system while the family farm income collected by the NFS represents the financial reward to all members of the family, who work on the farm, for their labour, management and investment.
In relation to the off-farm income, the estimate generated using the NFS is close to the approximation provided by the HBS data. However, there is a considerable difference between the off-farm income estimate provided by the broad definition of a farm household of the EU-SILC and the NFS estimate. Unfortunately, the NFS does not provide information on state transfers or other direct income for the farms included in their sample; therefore, no estimate can be provided.
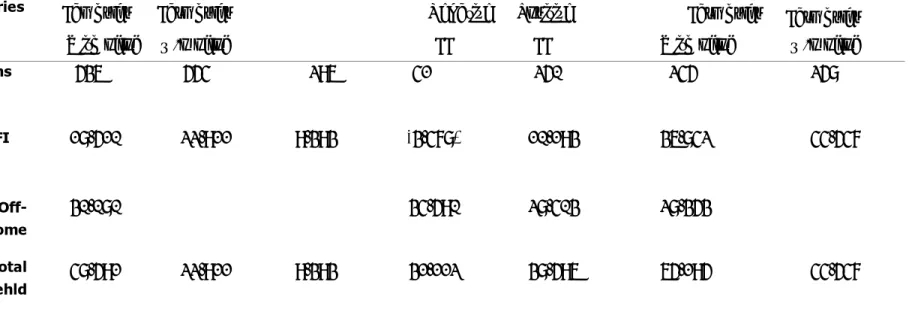
Table 2.2: Farm household Income (€’s) by Economic Category for the Farms in the NFS 2004 Sample
All Farms Sustainable
Economic
Categories Famhslds Farmhslds
Vulnerable
Negative Positive
Viable
Farmhslds Farmhslds With ofjob w/o ofjob FFI FFI With ofjob w/o ofjob
No. of farms 536 554 296 41 250 245 258 Average FFI 18,510 22,911 9,393 (3,478) 10,193 36,842 44,547 Average Off- 30,080 34,590 28,403 28,353 farm Income Average Total 48,591 22,911 9,393 31,112 38,596 65,195 44,547 Farmhousehld Income
The estimate of off-farm income we have provided allows us to assign the farm households included in the NFS to different economic categories. The economic status of the farm households encompassed in the NFS sample are outlined in Table 2.2. The table outlines the estimated total farm household income for the farms included in the 2004 NFS. These farms are then assigned according to their participation in the off-farm labour market.
In relation to the 2004 NFS, the farms with and without off-farm employment are evenly distributed. However, there is a significant difference between the total farm household income estimates for the two groups. In relation to family farm income, as anticipated, those farms not participating in the off-farm labour market have a higher estimate. While those farms with off-farm employment have a significantly higher total farm household income, the average income earned by those farms was €30,080.
Figure 2.15: Farm Household Income by Economic Category for the Farms in the NFS 2004 Sample
Source: Based on Authors calculations using NFS 2004 data
The economic status of the farms included in the NFS can be dissected even further. As illustrated in figure 2.15, the viable category includes farms with and without off-farm employment, while the sustainable category can be divided on the basis of family farm income. Off-farm employment assumes an integral role in protecting farm households from a vulnerable economic position. Particularly when family farm
income is insufficient to cover family labour and returns on assets, the off-farm income ensures the sustainability of farm households. The contrasting fortunes of farms is highlighted by the fact that 7 per cent of all farms are sustainable but have a negative family farm income, as shown in figure 2.15. For these farms, off-farm income assumes an even greater importance, as the off-farm income sustains both the household and the loss making business. Results also show that off-farm income accounts for between 60 to 100 per cent of the total farm household income for 63 per cent of the farms located in the sustainable with a positive family farm income category (see Appendix 2).
The most surprising result is the number of viable businesses with farmers or spouses participating in the off-farm labour market. Our results show that almost half of all viable farms also have an off-farm income and typically off-farm income accounts for between 20-50 per cent of total farm household income in these households. This represents a significant proportion of total income and it would be interesting to investigate what function this income has in ensuring the viability of these farm households.
2.6 Conclusions
The macroeconomic changes brought about by strong economic growth have led to the restructuring of sectoral employment in Ireland. The contribution of traditional industries, such as agriculture, to both GDP and total employment decreased and emphasis was placed on a move towards a more knowledge based economy. Ireland transformed from a labour surplus economy to one of excess demand for labour and resulted in increased labour market participation rates by females. The increase in human capital stock attributable to increased educational attainment levels was one of the factors in attracting the foreign direct investment necessary to facilitate the strong economic growth.
This era heralded a change in the agricultural sector. Over the last decade the number of farm households participating in the off-farm labour market has increased significantly and reached a high of almost 58 per cent of the farms in the 2007 NFS. Off-farm income now assumes an important role in ensuring the sustainability of farm households, as evidenced in the NFS 2006 where 40 per cent of farms were sustainable. The NFS has shown that the majority of farm operators with off-farm
employment have occupations residing in traditional manufacturing, construction or agriculture sectors, while the farmers’ spouses participating in the off-farm labour market were typically associated with employment in teaching, nursing or clerical occupations.
The importance attached to off-farm income was emphasised when we provided an estimate of the total farm household incomes and examined the economic status of the farms included in the 2004 NFS. It was shown that approximately 7 per cent of the farms required off-farm income to sustain not only the farm household but also the farm which was operating at a loss. It also showed that a significant proportion of viable farms (20 per cent) were participating in the off-farm labour market.
CHAPTER 3
IS OFF-FARM INCOME DRIVING ON-FARM INVESTMENT?
Thia Hennessy and Mark O’ Brien
Rural Economy Research Centre, Teagasc, Athenry, Co. Galway, Ireland
3.1 Introduction
The previous chapters of this report have outlined the growing reliance by farm households on non-farm incomes. Chapter 2 has highlighted the large number of farm households that are sustainable only because of the presence of off-farm income. The objective of this chapter is to explore the contribution of off-farm income to the viability of the farm business; specifically the focus of the analysis is the link between off-farm income and farm investment. The hypothesis tested is; does off-farm income drive on-farm investment?
Despite the ever growing divergence between farm and non-farm incomes, farmers continue to invest in agriculture. Data for Ireland shows that in the ten year period from 1995 to 2005 average farm incomes declined by almost 17 percent in real terms while net new investment increased by almost 30 percent over the same period (Connolly et al. 2005). Moreover, anecdotal evidence drawn from advertisements in the farming print media suggests that the market for agricultural farm machinery remains buoyant. Given that agriculture is a sector in relative decline, with farm numbers in decline and farm and non-farm incomes continuing to diverge, it is surprising then that new investment in farming has remained so positive, especially when one considers the alternative investment opportunities available in a buoyant economy like Ireland. It is, therefore, somewhat counter-intuitive that given the apparent disincentives to invest in farming that agricultural investment levels remain positive.
The chapter begins by exploring the factors affecting farm investment decisions with a view to identifying why farm investment has increased despite the apparent poor returns to farming. The chapter begins by providing a clear definition of farm investment and some background information on farm investment trends in Ireland.
between farm investment and off-farm income. These theories are investigated using the National Farm Survey dataset. The chapter concludes with a discussion of the results of the analysis.
3.2 Defining Investment
The National Farm Survey (NFS) records data on both gross and net new investment. Net new investment is defined as investment (including both purchase and repair) in buildings, land improvements, machinery, and production quotas, less all sales, grants and subsidies. The net new investment measure does not include land purchases. It is a very apt definition of farm investment as it excludes all grants and subsidies and therefore accounts for only “actual” investment. Furthermore, the exclusion of investment in land purchases means that it does not include any potentially speculative investment, such as farmers buying land with the intention of re-selling for a profit.
NFS data show that over the period 1995 to 2004, average family farm income declined by 17 percent in real terms, while net new investment increased by almost 30 percent. Figure 3.1 shows net new investment as a percentage of income for the various farm systems that are defined in the NFS.
Figure 3.1: Net New Investment as a Percentage of Farm Income
Source: NFS
The data in Figure 3.1 show that while investment levels are volatile across the period, there is a consistent trend of increasing investment levels across most farm
systems over time.2 When all farm systems are combined, the percentage of farm income being reinvested in farming grew from 20 percent in 1995 to just over 30 percent in 2004.
Figure 3.2: Investment Type – 2004 National Farm Survey Data
1
Source: NFS
It is also interesting to consider the types of farm investment. Figure 3.2 decomposes the net new investment data into the different types of investment. Machinery is the most common source of investment, accounting for over 60 percent of net new investment. About 31 percent of investment relates to new buildings or repair to existing ones while investment in production quotas accounts for just 1 percent of net new investment across all farms in 2004.
3.3 The relationship between off-farm income and farm investment
It seems counter-intuitive that investment in farming would remain buoyant despite falling real farm incomes. It is possible however that farmers may use income earned off the farm, by either themselves or their spouse, to supplement the operation of the family farm and to reinvest in the farm business.
There are a number of economic theories as to why off-farm income may affect farm investment. These theories can be developed within the agricultural household as discussed in detail in previous chapters. They are briefly summarised and simplified